A Look at Summer 2018 Extremes in the U.S. Climate Reference Network
Special Stories
22 Feb 2019 8:38 AM
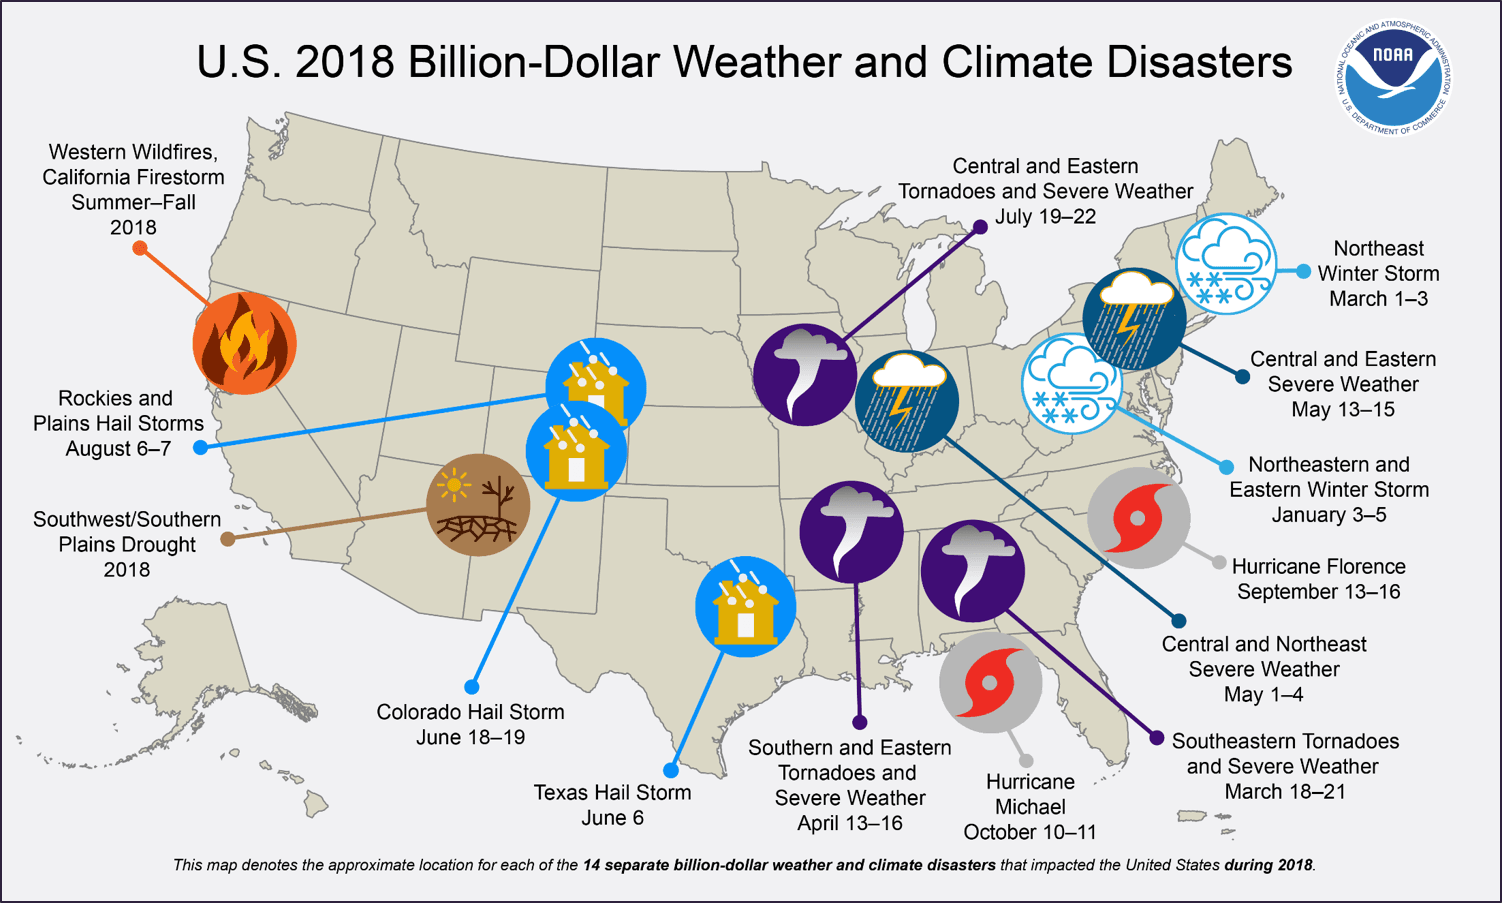
[NOAA by Michael Palecki] 2018 saw an unusual number of amazing—and deadly—weather events. Some had national coverage, especially Hurricanes Florence and Michael and their impacts on the eastern U.S., and the drought and heat triggering record fires in California and other parts of the western U.S.
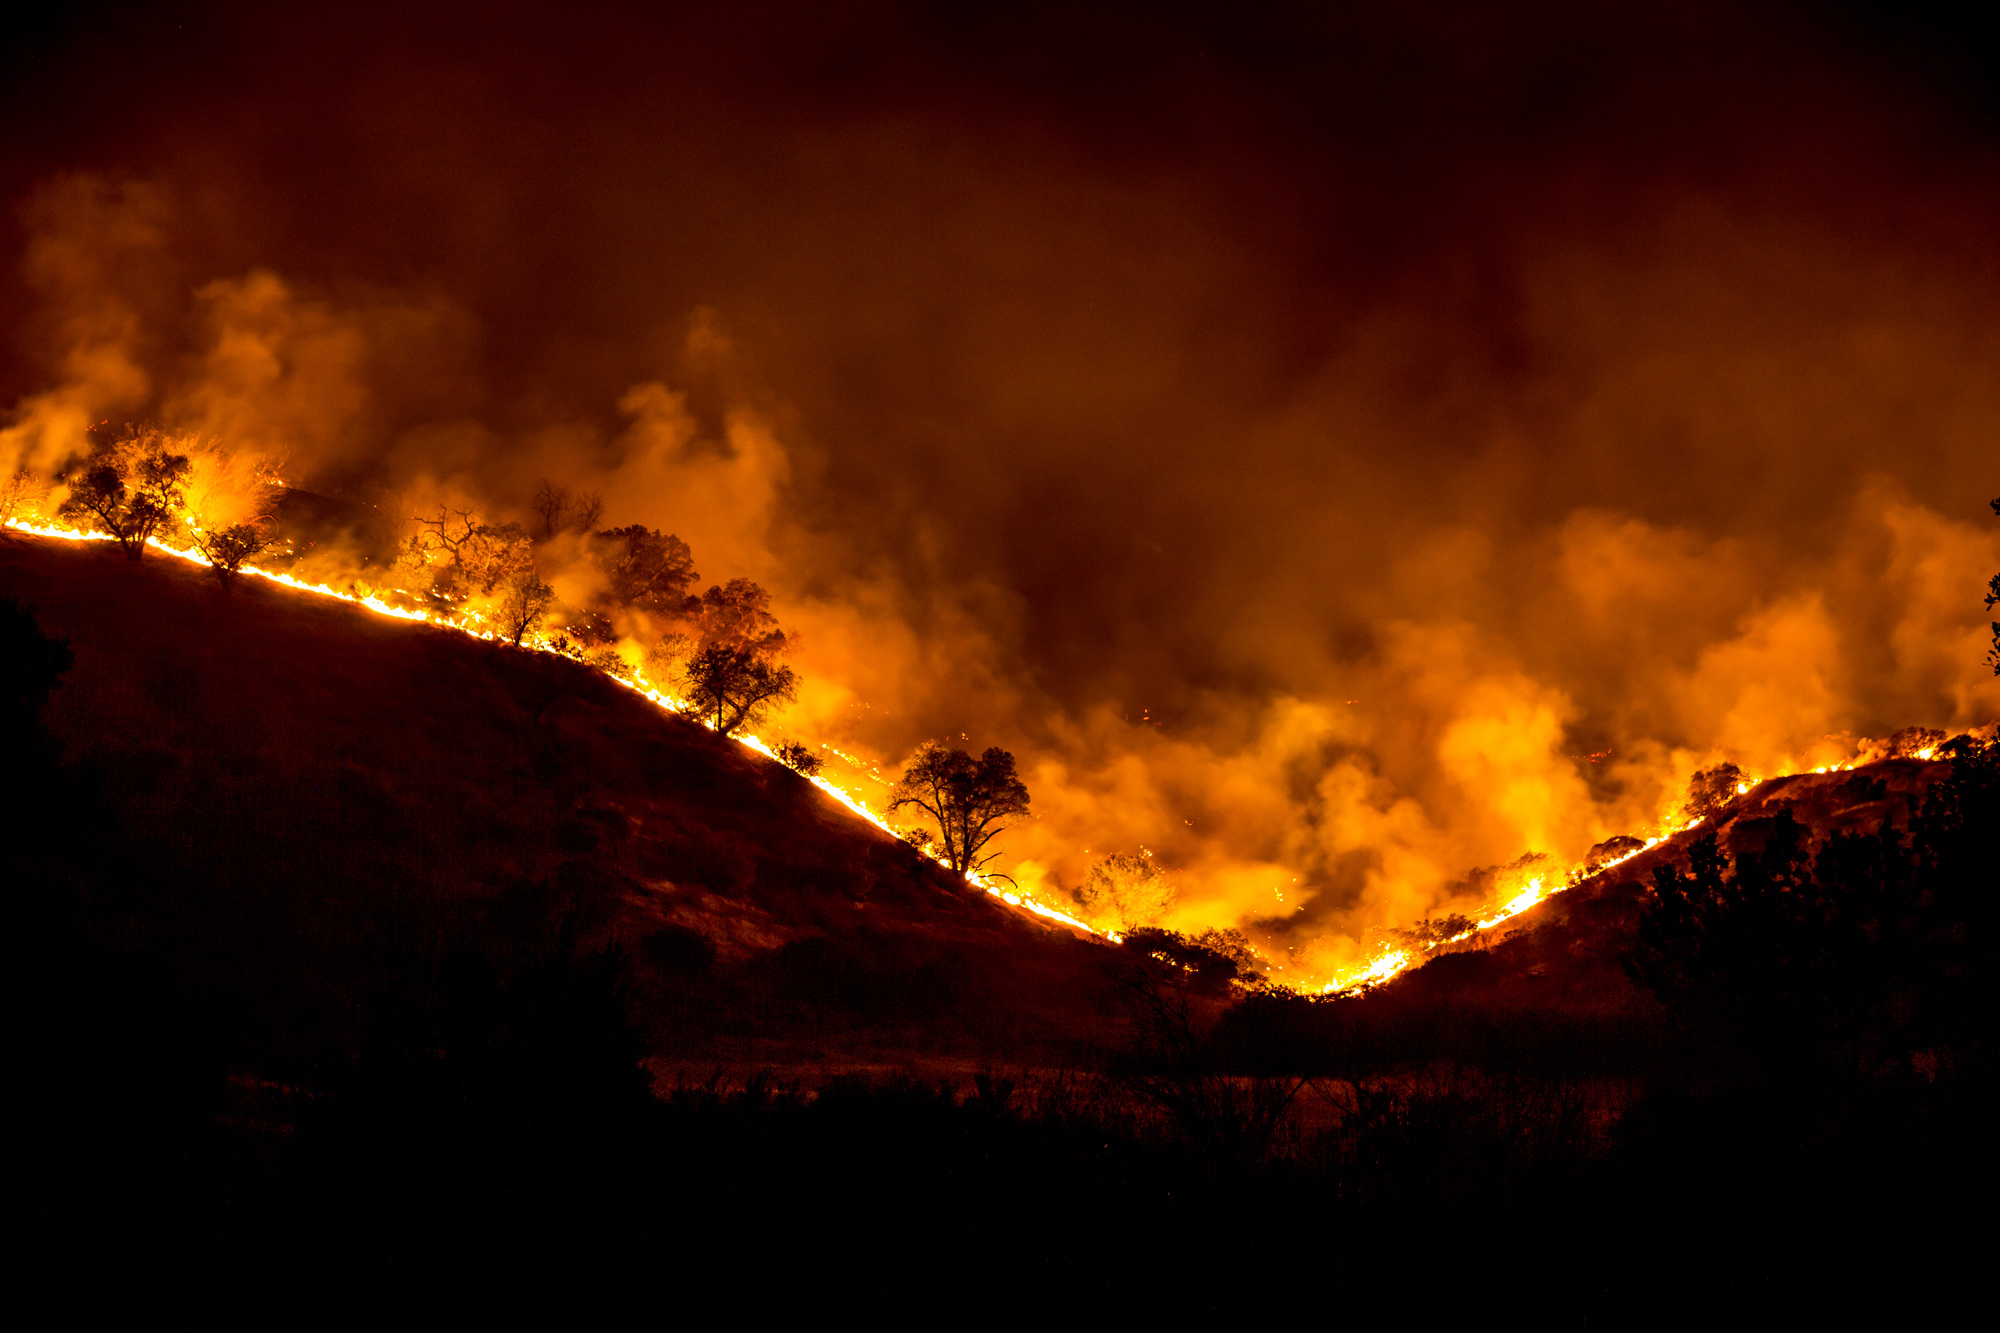 [The Woolsey Fire in California. Started on November 8, 2018, the fire burned more than 96,000 acres; destroyed 1,500 structures; and took three lives. Photo by Peter Buschmann, U.S. Forest Service.]
Many networks across the U.S. collect air temperature and precipitation observations we use to characterize these events. As the nation’s official climate scorekeepers, scientists at NOAA’s National Centers for Environmental Information (NOAA NCEI) receive, quality control, store, and make these data accessible to the public.
Almost all of those surface weather stations are run by NOAA’s National Weather Service, the U.S. Department of Agriculture, the Federal Aviation Administration, and other groups, including citizen science organizations. However, there is only one climate network that originated at NOAA NCEI: the U.S. Climate Reference Network (USCRN), which was launched in the early 2000s.
[The Woolsey Fire in California. Started on November 8, 2018, the fire burned more than 96,000 acres; destroyed 1,500 structures; and took three lives. Photo by Peter Buschmann, U.S. Forest Service.]
Many networks across the U.S. collect air temperature and precipitation observations we use to characterize these events. As the nation’s official climate scorekeepers, scientists at NOAA’s National Centers for Environmental Information (NOAA NCEI) receive, quality control, store, and make these data accessible to the public.
Almost all of those surface weather stations are run by NOAA’s National Weather Service, the U.S. Department of Agriculture, the Federal Aviation Administration, and other groups, including citizen science organizations. However, there is only one climate network that originated at NOAA NCEI: the U.S. Climate Reference Network (USCRN), which was launched in the early 2000s.
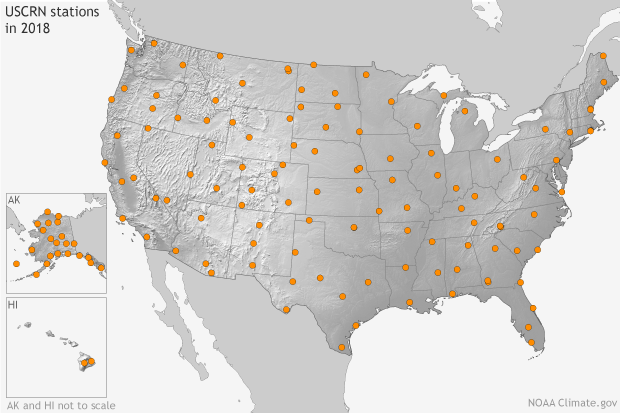 [Location of stations (orange dots) in the U.S. Climate Reference Network, with 114 sites in the conterminous United States, 22 sites (and growing) in Alaska, and two sites in Hawaii. Map by NOAA Climate, based on data from Michael Palecki.]
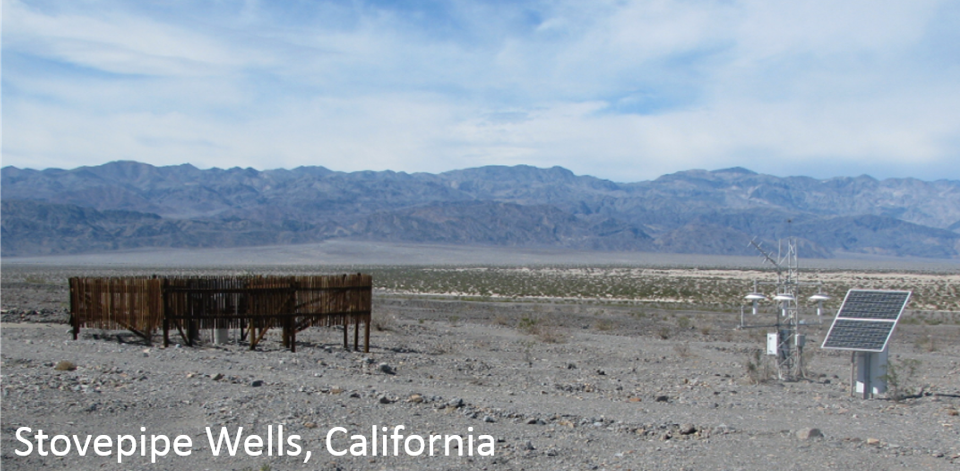
The sites at Hilo, Hawaii (the largest town on the Big Island), and Stovepipe Wells, California (in Death Valley), are examples of some of the varied environments we measure. As their photos below show, USCRN stations are located in open places with a stable surrounding landscape.
[Location of stations (orange dots) in the U.S. Climate Reference Network, with 114 sites in the conterminous United States, 22 sites (and growing) in Alaska, and two sites in Hawaii. Map by NOAA Climate, based on data from Michael Palecki.]
The sites at Hilo, Hawaii (the largest town on the Big Island), and Stovepipe Wells, California (in Death Valley), are examples of some of the varied environments we measure. As their photos below show, USCRN stations are located in open places with a stable surrounding landscape.
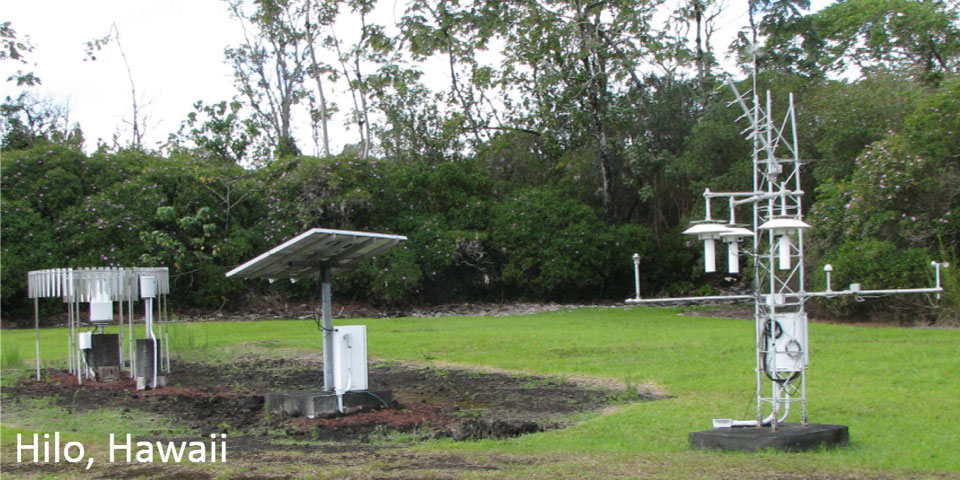 [U.S. Climate Reference Network Station Sites near Hilo, Hawaii. The station is solar powered and has two rain gauges surrounded by wind shield fencing and an instrument tower. On the the tower are three shielded and fan-aspirated platinum resistance thermometers and other devices for measuring solar radiation, surface temperature, wind speed, relative humidity, wetness, and soil moisture/temperature at several depths. Photo courtesy Michael Palecki.]
They are equipped with high-quality, laboratory-calibrated sensors that traditionally would be found in scientific field studies. The unique aspect of USCRN stations is that air temperature, precipitation, and soil moisture measurements are made with three sets of independent instruments to make sure the results are accurate and continuous even if any individual instrument fails.
[U.S. Climate Reference Network Station Sites near Hilo, Hawaii. The station is solar powered and has two rain gauges surrounded by wind shield fencing and an instrument tower. On the the tower are three shielded and fan-aspirated platinum resistance thermometers and other devices for measuring solar radiation, surface temperature, wind speed, relative humidity, wetness, and soil moisture/temperature at several depths. Photo courtesy Michael Palecki.]
They are equipped with high-quality, laboratory-calibrated sensors that traditionally would be found in scientific field studies. The unique aspect of USCRN stations is that air temperature, precipitation, and soil moisture measurements are made with three sets of independent instruments to make sure the results are accurate and continuous even if any individual instrument fails.
[The Woolsey Fire in California. Started on November 8, 2018, the fire burned more than 96,000 acres; destroyed 1,500 structures; and took three lives. Photo by Peter Buschmann, U.S. Forest Service.]
Many networks across the U.S. collect air temperature and precipitation observations we use to characterize these events. As the nation’s official climate scorekeepers, scientists at NOAA’s National Centers for Environmental Information (NOAA NCEI) receive, quality control, store, and make these data accessible to the public.
Almost all of those surface weather stations are run by NOAA’s National Weather Service, the U.S. Department of Agriculture, the Federal Aviation Administration, and other groups, including citizen science organizations. However, there is only one climate network that originated at NOAA NCEI: the U.S. Climate Reference Network (USCRN), which was launched in the early 2000s.
Lab-tuned sensors with multiple back ups
The USCRN stations are engineered and maintained by the measurement science experts (and NCEI partners) at NOAA’s Atmospheric Turbulence and Diffusion Division (ATDD). A map of the current network shows that these stations are evenly distributed across the nation. Due to the wide spacing between USCRN stations, we do not see every extreme event with this one network. But over time, we will observe enough—a representative sample—of these extremes that the national course of climate can be traced and confirmed.
[Location of stations (orange dots) in the U.S. Climate Reference Network, with 114 sites in the conterminous United States, 22 sites (and growing) in Alaska, and two sites in Hawaii. Map by NOAA Climate, based on data from Michael Palecki.]
The sites at Hilo, Hawaii (the largest town on the Big Island), and Stovepipe Wells, California (in Death Valley), are examples of some of the varied environments we measure. As their photos below show, USCRN stations are located in open places with a stable surrounding landscape.
[U.S. Climate Reference Network Station Sites near Hilo, Hawaii. The station is solar powered and has two rain gauges surrounded by wind shield fencing and an instrument tower. On the the tower are three shielded and fan-aspirated platinum resistance thermometers and other devices for measuring solar radiation, surface temperature, wind speed, relative humidity, wetness, and soil moisture/temperature at several depths. Photo courtesy Michael Palecki.]
They are equipped with high-quality, laboratory-calibrated sensors that traditionally would be found in scientific field studies. The unique aspect of USCRN stations is that air temperature, precipitation, and soil moisture measurements are made with three sets of independent instruments to make sure the results are accurate and continuous even if any individual instrument fails.
A stable standard for detecting change and ranking extremes
In addition to monitoring climate, one of the main features of USCRN is to serve as a “reference network,” a group of observations that can be used as a standard against which other observations can be referenced, or checked. Why have a “reference” network? People in the U.S. have been measuring the atmosphere and recording the passage of weather systematically since the 1870s, and even before. Over time, the ways in which temperature and precipitation are measured at thousands of different locations have slowly changed, the locations of observations themselves have changed, and the land surrounding the stations has often been built up and urbanized. Each of these factors can affect our ability to detect temperature trends.[The U.S. Climate Reference Network Station near Stovepipe Wells, California, in the northern part of Death Valley. The wind-shielded rain gauges are at left, and the instrument tower and solar panel powering the station are at right. Photo by Michael Palecki.]
Scientists and math experts have to make tremendous efforts to remove these non-climate effects on temperature through statistical testing and corrections that lead to the creation of a homogenized dataset. Homogenized records allow observations from 50 or 100 years ago to be compared accurately with today’s measurements. Those efforts would be vastly easier—and have less uncertainty—if climate experts had a standard for comparison that they knew hadn’t changed over time in terms of sensors or surroundings. The key goal with USCRN is to collect measurements at locations that will not undergo the types of changes seen at other networks over the next 50 years. In this way, the USCRN will act as a “reference” against which other networks can be compared in the U.S.
As an example of USCRN’s role as “reference”, two USCRN stations experienced extreme events of great note last year. During the hot and dry 2018 summer in the western U.S., the USCRN station near Stovepipe Wells, California, experienced its warmest and driest summer on record. Meanwhile, on the Big Island of Hawaii, the USCRN station near Hilo experienced a drenching rain associated with Hurricane Lane that rivaled the deluges experienced on the U.S. mainland in recent years with Hurricane Harvey in 2017 and Hurricane Florence in 2018.
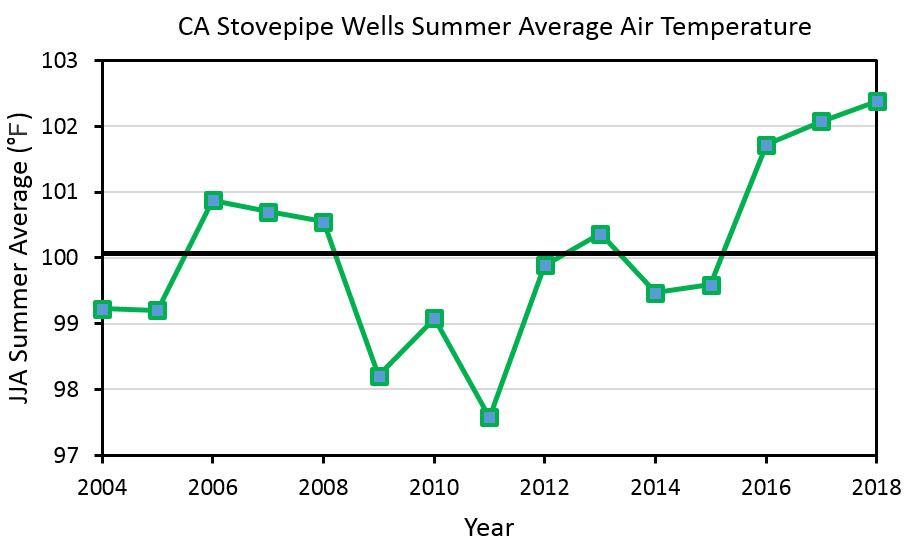 [Summer average air temperature at the U.S. Climate Reference Network station near Stovepipe Wells, California, from 2004 to 2018. Summer 2018 was the warmest on record. Graph by Michael Palecki, NOAA NCEI.]
Adjusting for the elevation difference between the two stations, the two temperature values were very similar. This could potentially be the warmest summer (JJA) ever recorded on earth at a reliable observation station, and may also be the first time summer average air temperature was observed to exceed 104°F (40°C). High-quality reference measurements will contribute to the analysis and confirmation of this event.
[Summer average air temperature at the U.S. Climate Reference Network station near Stovepipe Wells, California, from 2004 to 2018. Summer 2018 was the warmest on record. Graph by Michael Palecki, NOAA NCEI.]
Adjusting for the elevation difference between the two stations, the two temperature values were very similar. This could potentially be the warmest summer (JJA) ever recorded on earth at a reliable observation station, and may also be the first time summer average air temperature was observed to exceed 104°F (40°C). High-quality reference measurements will contribute to the analysis and confirmation of this event.
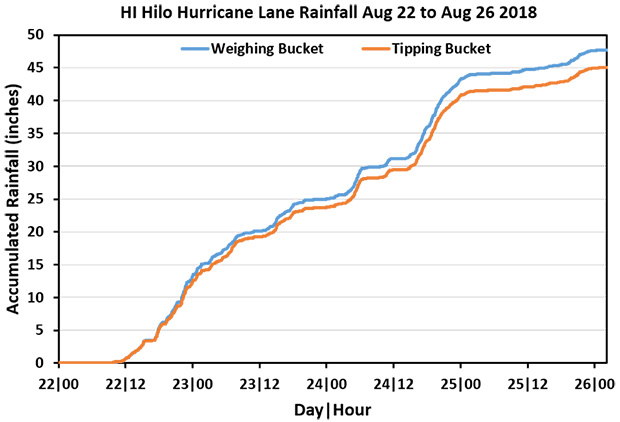 [Rainfall accumulation at 5-minute intervals at the U.S. Climate Reference Network station near Hilo, Hawaii, during Hurricane Lane, August 22-26, 2018. The official rainfall record for the station is measured by the weighing bucket gauge (blue line); the tipping bucket gauge (orange line) cannot keep up with the rainfall rate at times of great intensity. Graph by Michael Palecki, NOAA NCEI.]
Looking at this event in context, the Hilo area of Hawaii has a wet climate due to its coastal location facing the northeasterly trade winds in the tropical Pacific, especially in the fall and winter months. But August is not usually considered part of the wet season, with the previous 12 Augusts averaging 11.27 inches (286.3 millimeters) at the Hilo station. During August of 2018, the USCRN Hilo station received a staggering 67.10 inches (1704.4 millimeters), the largest calendar month total ever recorded at any USCRN station.
Hilo also set a new network-wide, 30-day record of 67.35 inches (1710.6 millimeters) between July 30 and August 28. However, it was the shorter duration rainfall totals around the time of Hurricane Lane’s passage that were most unusual. Using statistics from many other stations on the Big Island over the last century, one can estimate how often rain totals of this size would occur. These are the estimates for Hurricane Lane at the USCRN Hilo station:
[Rainfall accumulation at 5-minute intervals at the U.S. Climate Reference Network station near Hilo, Hawaii, during Hurricane Lane, August 22-26, 2018. The official rainfall record for the station is measured by the weighing bucket gauge (blue line); the tipping bucket gauge (orange line) cannot keep up with the rainfall rate at times of great intensity. Graph by Michael Palecki, NOAA NCEI.]
Looking at this event in context, the Hilo area of Hawaii has a wet climate due to its coastal location facing the northeasterly trade winds in the tropical Pacific, especially in the fall and winter months. But August is not usually considered part of the wet season, with the previous 12 Augusts averaging 11.27 inches (286.3 millimeters) at the Hilo station. During August of 2018, the USCRN Hilo station received a staggering 67.10 inches (1704.4 millimeters), the largest calendar month total ever recorded at any USCRN station.
Hilo also set a new network-wide, 30-day record of 67.35 inches (1710.6 millimeters) between July 30 and August 28. However, it was the shorter duration rainfall totals around the time of Hurricane Lane’s passage that were most unusual. Using statistics from many other stations on the Big Island over the last century, one can estimate how often rain totals of this size would occur. These are the estimates for Hurricane Lane at the USCRN Hilo station:
 In conclusion, the U.S. Climate Reference Network is unique in the United States and provides an invaluable service to the nation by supporting—allowing us to trust—the weather and climate observations of other networks. USCRN is also frequently used for validating the earth surface measurements of NOAA and NASA satellites; that is a story for another day.
Edited for WeatherNation by Meteorologist Mace Michaels
In conclusion, the U.S. Climate Reference Network is unique in the United States and provides an invaluable service to the nation by supporting—allowing us to trust—the weather and climate observations of other networks. USCRN is also frequently used for validating the earth surface measurements of NOAA and NASA satellites; that is a story for another day.
Edited for WeatherNation by Meteorologist Mace Michaels
Hot and Dry: Summer 2018 at Stovepipe Wells
The average air temperature for June-July-August (JJA) 2018 was 102.4°F (39.1°C), which was higher than the previous two record years in 2017 and 2016. This was also the driest summer in the station record, with only 0.02 inches (0.4 millimeters) of precipitation, which fell on the last day of July. The importance of these temperature observations at the USCRN station was that they could be used as a reference to verify the warmest summer average air temperature (104.2 F or 40.1 C) ever observed at the nearby NOAA NWS Cooperative Observer Program (COOP) Network station in Death Valley. That station, near Furnace Creek, California, is in a lower and warmer part of Death Valley: -194 feet (-59.1 meters) elevation relative to mean sea level, while the Stovepipe Wells station is at +84 feet (+25.6 meters).
[Summer average air temperature at the U.S. Climate Reference Network station near Stovepipe Wells, California, from 2004 to 2018. Summer 2018 was the warmest on record. Graph by Michael Palecki, NOAA NCEI.]
Adjusting for the elevation difference between the two stations, the two temperature values were very similar. This could potentially be the warmest summer (JJA) ever recorded on earth at a reliable observation station, and may also be the first time summer average air temperature was observed to exceed 104°F (40°C). High-quality reference measurements will contribute to the analysis and confirmation of this event.
Warm and Wet: August 2018 at Hilo
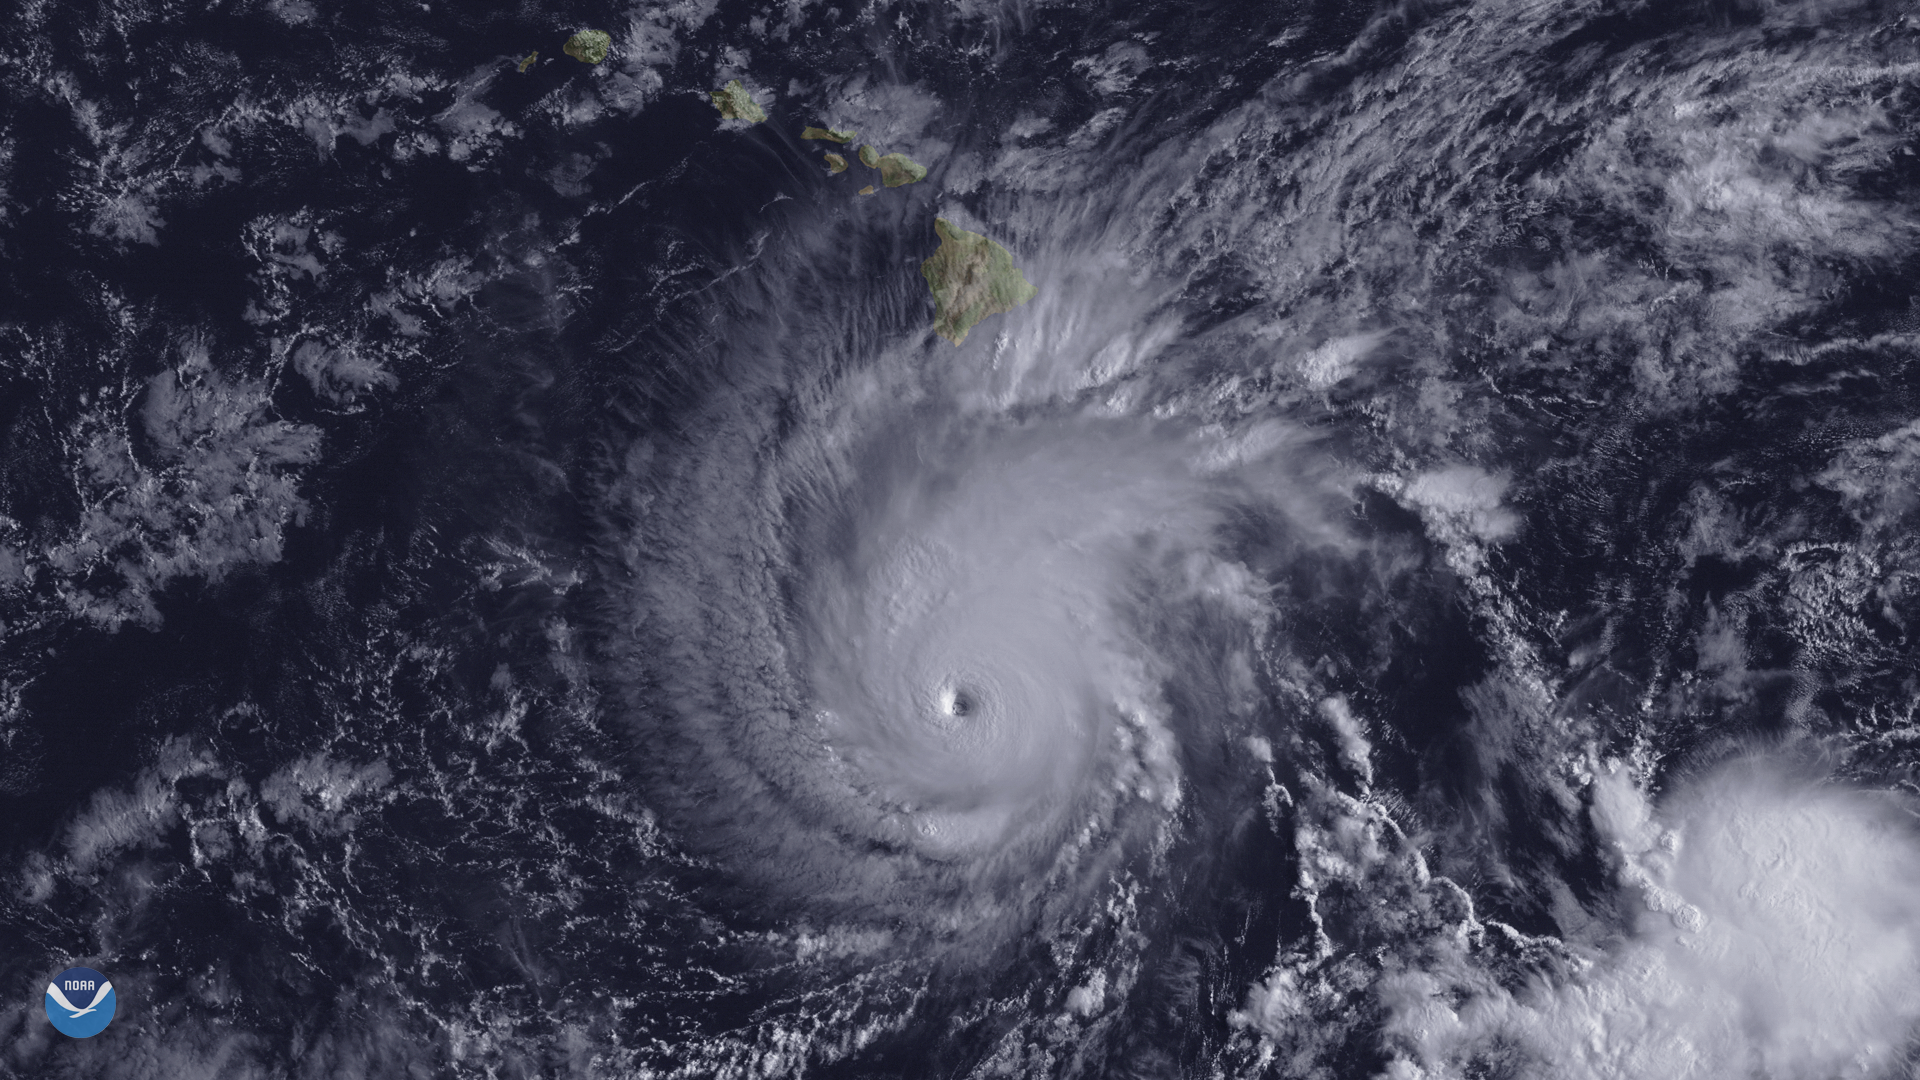
The hurricane season in the central North Pacific was unusually active this year, with the Hawaiian Islands impacted by an unprecedented pair of tropical storms approaching from the eastern Pacific: Hurricane Lane and Hurricane Olivia. Of these, Lane had the greatest impact, drenching the Big Island of Hawaii with enormous rain bands for several days as the storm slowly approached and then stalled south of Oahu from August 22-26. At the USCRN station near Hilo, a 4-day rainfall total of 47.61 inches (1209.2 millimeters) was recorded from August 22 to August 25. To place this in perspective, this amount was similar to those measured in the Houston area during Hurricane Harvey in 2017 and in the Wilmington area during Hurricane Florence last year. Looking at how the rain accumulated over these days at 5-minute increments, it is easy to see when the heavier rain bands passed over the site.
[Rainfall accumulation at 5-minute intervals at the U.S. Climate Reference Network station near Hilo, Hawaii, during Hurricane Lane, August 22-26, 2018. The official rainfall record for the station is measured by the weighing bucket gauge (blue line); the tipping bucket gauge (orange line) cannot keep up with the rainfall rate at times of great intensity. Graph by Michael Palecki, NOAA NCEI.]
Looking at this event in context, the Hilo area of Hawaii has a wet climate due to its coastal location facing the northeasterly trade winds in the tropical Pacific, especially in the fall and winter months. But August is not usually considered part of the wet season, with the previous 12 Augusts averaging 11.27 inches (286.3 millimeters) at the Hilo station. During August of 2018, the USCRN Hilo station received a staggering 67.10 inches (1704.4 millimeters), the largest calendar month total ever recorded at any USCRN station.
Hilo also set a new network-wide, 30-day record of 67.35 inches (1710.6 millimeters) between July 30 and August 28. However, it was the shorter duration rainfall totals around the time of Hurricane Lane’s passage that were most unusual. Using statistics from many other stations on the Big Island over the last century, one can estimate how often rain totals of this size would occur. These are the estimates for Hurricane Lane at the USCRN Hilo station:
- 7-day: 1305.6 mm (51.40 in) 200-year return interval
- 4-day: 1215.6 mm (47.86 in) 500-year return interval
- 3-day: 1124.6 mm (44.28 in) 750-year return interval
- 2-day: 812.6 mm (31.99 in) 200-year return interval
- 1-day: 501.2 mm (19.73 in) 50-year return interval
[Hurricane Lane in the Pacific Ocean about 300 miles south of Hawaii's Big Island. The storm set multiple new records for most rainfall over a given period. NOAA GOES-15 satellite image captured at 2 p.m. ET on August 22, 2018. Image by NOAA EVL.]
While these are lengths of time in days, the “day” may start and end at any 5-minute period, thus capturing the biggest possible rain amount for each interval tested. In addition, these statistics are based on year-round precipitation histories, so the likelihood of having these events in relatively dry August is even more unusual. The 3-day and 4-day rainfall amounts were the most unusual. A 500-year return interval means that there is a 0.2% chance of this occurring in any given year. A 750-year event has a chance of occurring only slightly above 0.1% in any given year. The ability of the USCRN station to function accurately during such extreme events is a testament to its design and engineering.
All Weather News
More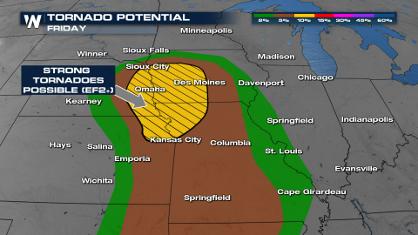
Significant Storm Threat Today, Friday
The spring season often means rounds of inten
25 Apr 2024 9:50 PM
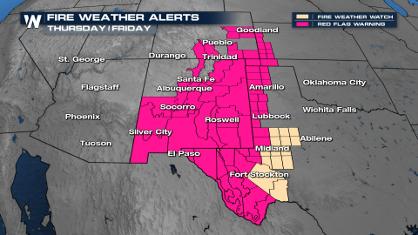
Critical Fire Risk in West Texas, New Mexico
A critical fire risk is in place for west Tex
25 Apr 2024 9:45 PM
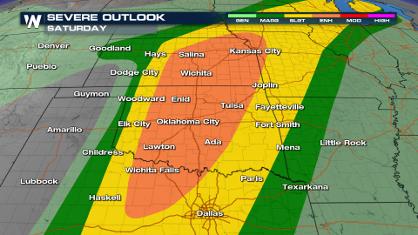
Weekend Forecast: More Severe Weather
We are looking at the threat of another sever
25 Apr 2024 9:40 PM
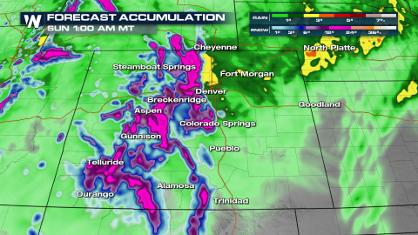
Spring Snow on the Horizon in Colorado
Snow is in the forecast for Denver, which cou
25 Apr 2024 9:35 PM
National Park Week: Get Out and Explore
National Park Week started Saturday, April 20
25 Apr 2024 9:30 PM
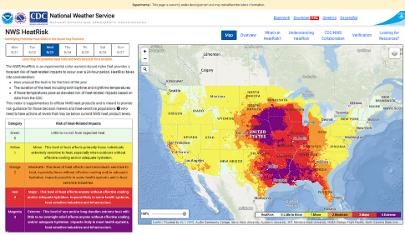
NOAA Debuts "HeatRisk" Tool Nationwide
More people die from heat every year than ALL
25 Apr 2024 9:00 PM

Double Trouble: Cicadas Take to the Skies this Spring
It’s the soundtrack to the summer. Nature’s n
25 Apr 2024 8:45 PM