The Pacific-North American Pattern: the Stomach Sleeper of the Atmosphere
Special Stories
24 Apr 2019 5:15 AM
[NOAA by Michelle L'Heureux] Some people like to sleep on their backs. Some people prefer to sleep on their stomachs or on their sides. Some people don’t sleep much at all! There are certain states we gravitate to when we sleep, often to maximize comfort. They are our preferred states. Would you be surprised if I were to tell you the atmospheric circulation operates in the same way, that certain patterns or flows appear more often than others because we’re not the only ones who like routine? One of these preferred states is the Pacific-North American Pattern, or as we scientists like to shorthand it: The Almighty P-N-A! (Ok, we don't shout “Almighty!” every time… we whisper it.)
I know the presence of a fixed atmospheric pattern sounds a touch odd because most satellite loops of our planet show a fast, chaotic swirl of movement—weather fronts racing through the Plains, cyclones threatening the global tropics, and so on (check out the ever-mesmerizing GOES loops). There’s nothing particularly fixed-looking about it. But, if you slow it down, there are some quite enormous atmospheric flows that appear to be stuck on repeat. But they are not always present, and when they re-occur, they do so irregularly.
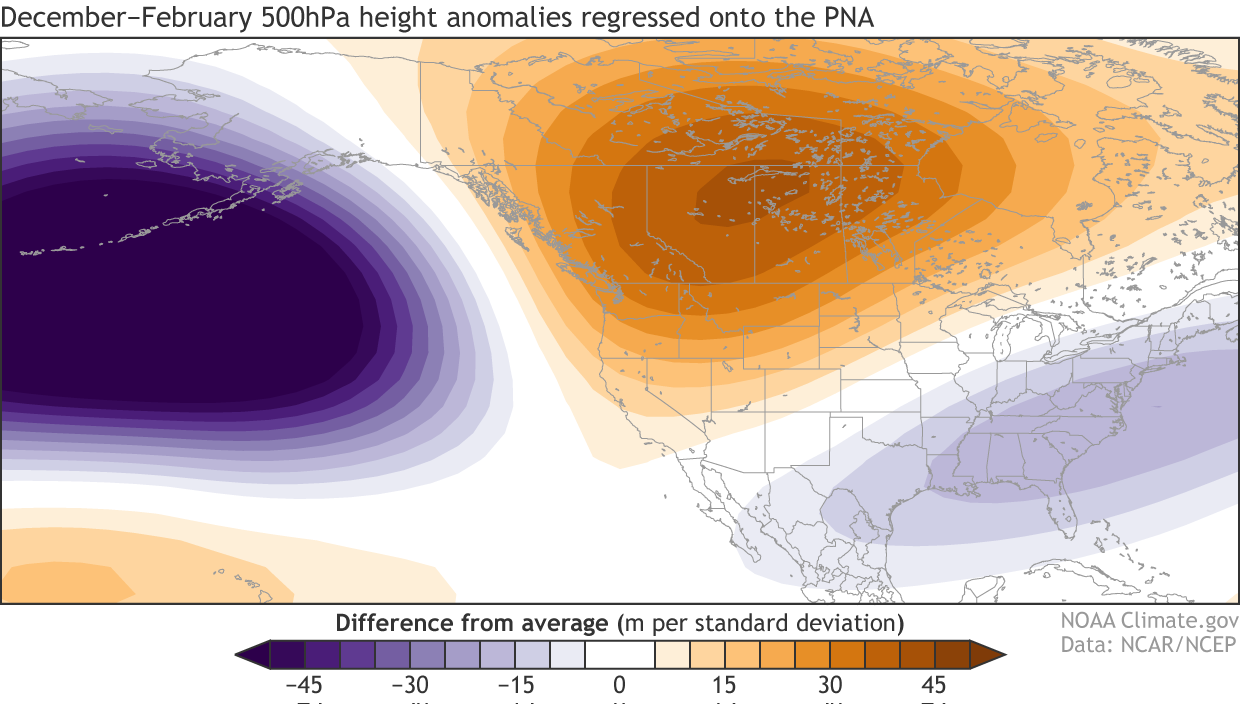 [December-February 500-hPa geopotential height anomalies regressed onto the monthly PNA index (available here). Data shown for 1979-80 to 2018-19. Purple shading indicates below-average pressure and winds that flow counter-clockwise following the contours. Orange shading denotes above-average pressure and winds that flow clockwise. NOAA Climate map using NCEP/NCAR reanalysis data.]
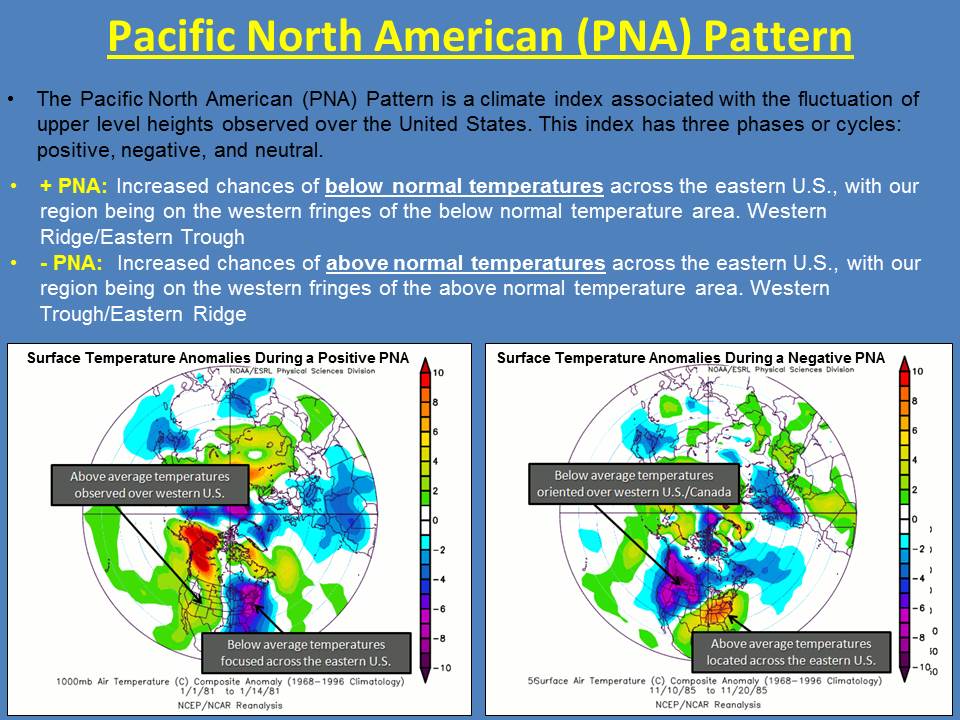
We could measure the PNA with winds, but it is more often measured by pressure patterns, which are strongly related to winds (many of the atmosphere’s preferred patterns have very visible footprints in pressure) (2). In the positive state of the PNA, above-average pressure is found over the subtropical Pacific (close to Hawaii) and centered over western Canada. Below-average pressure occurs over the North Pacific Ocean and along the southeastern United States. The negative state of the PNA results in the same pattern except with opposite anomalies (regions that have above-average pressure become below-average and vice versa).
These changes to the atmospheric circulation influence surface climate conditions. During the positive PNA, a big anomalous ridge of high pressure over Canada results in fewer cold air outbreaks over Alaska, Canada, and the northern tier of the United States (the opposite is true for negative PNA… brrrr!). Texas, the Southeast United States, and most of the East Coast trend colder thanks to the anomalous trough of low pressure over this region.
[December-February 500-hPa geopotential height anomalies regressed onto the monthly PNA index (available here). Data shown for 1979-80 to 2018-19. Purple shading indicates below-average pressure and winds that flow counter-clockwise following the contours. Orange shading denotes above-average pressure and winds that flow clockwise. NOAA Climate map using NCEP/NCAR reanalysis data.]
We could measure the PNA with winds, but it is more often measured by pressure patterns, which are strongly related to winds (many of the atmosphere’s preferred patterns have very visible footprints in pressure) (2). In the positive state of the PNA, above-average pressure is found over the subtropical Pacific (close to Hawaii) and centered over western Canada. Below-average pressure occurs over the North Pacific Ocean and along the southeastern United States. The negative state of the PNA results in the same pattern except with opposite anomalies (regions that have above-average pressure become below-average and vice versa).
These changes to the atmospheric circulation influence surface climate conditions. During the positive PNA, a big anomalous ridge of high pressure over Canada results in fewer cold air outbreaks over Alaska, Canada, and the northern tier of the United States (the opposite is true for negative PNA… brrrr!). Texas, the Southeast United States, and most of the East Coast trend colder thanks to the anomalous trough of low pressure over this region.
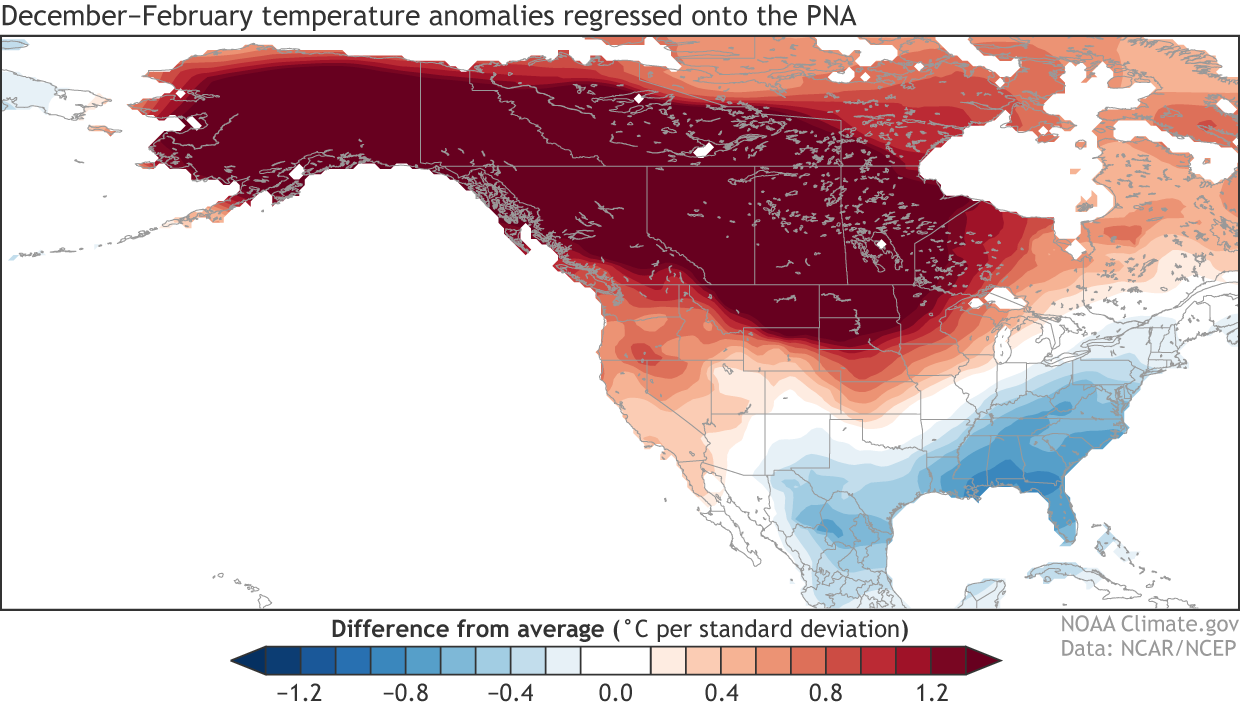 [December-February surface temperature anomalies regressed onto the monthly PNA index (available here). Data shown for 1979-80 to 2018-19. Red shading indicates above-average temperatures and blue shading indicates below-average temperatures. NOAA Climate map using CPC GHCN+CAMS data.]
A positive PNA is also linked to increased precipitation next to the Gulf of Mexico and Florida and over most of the southern coast of Alaska, while it decreases precipitation over the Ohio and Tennessee Valleys, stretching up to the Great Lakes and over the Pacific Northwest and Northern Rockies.
[December-February surface temperature anomalies regressed onto the monthly PNA index (available here). Data shown for 1979-80 to 2018-19. Red shading indicates above-average temperatures and blue shading indicates below-average temperatures. NOAA Climate map using CPC GHCN+CAMS data.]
A positive PNA is also linked to increased precipitation next to the Gulf of Mexico and Florida and over most of the southern coast of Alaska, while it decreases precipitation over the Ohio and Tennessee Valleys, stretching up to the Great Lakes and over the Pacific Northwest and Northern Rockies.
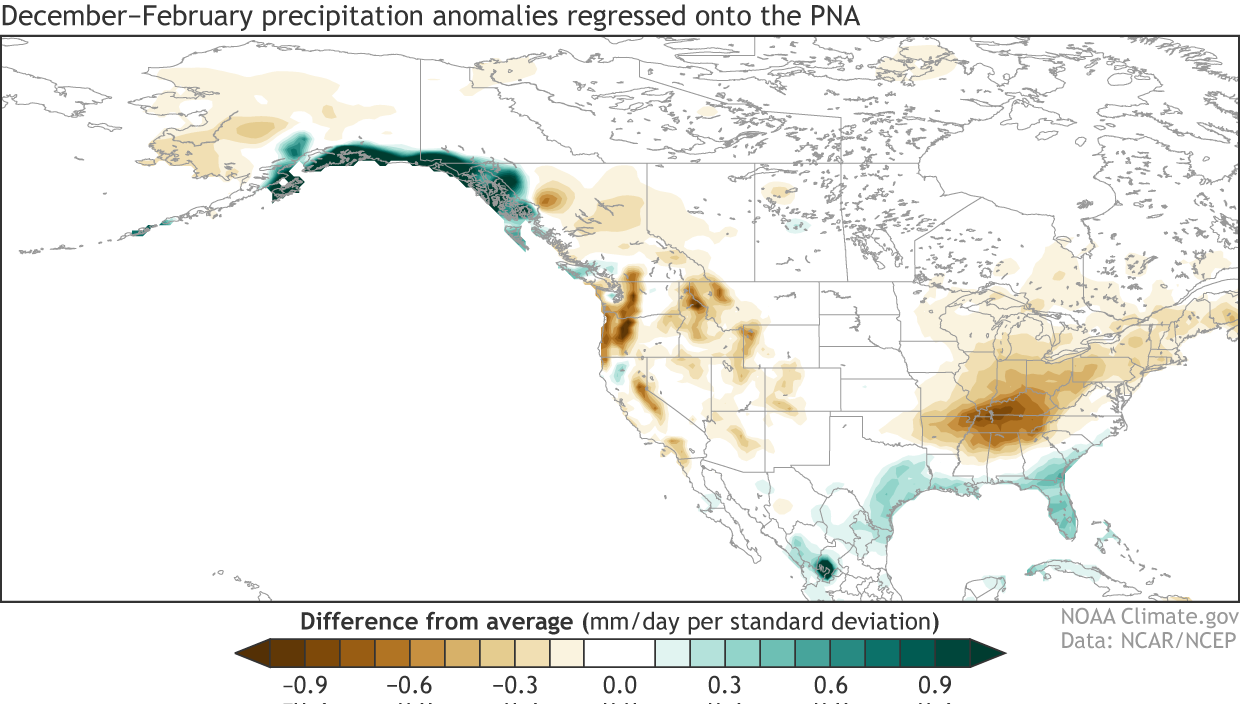 [December-February surface precipitation anomalies regressed onto the monthly PNA index (available here). Data shown for 1979-80 to 2018-19. Green shading indicates above-average precipitation and brown shading indicates below-average precipitation. NOAA Climate map using CPC Unified precipitation data.]
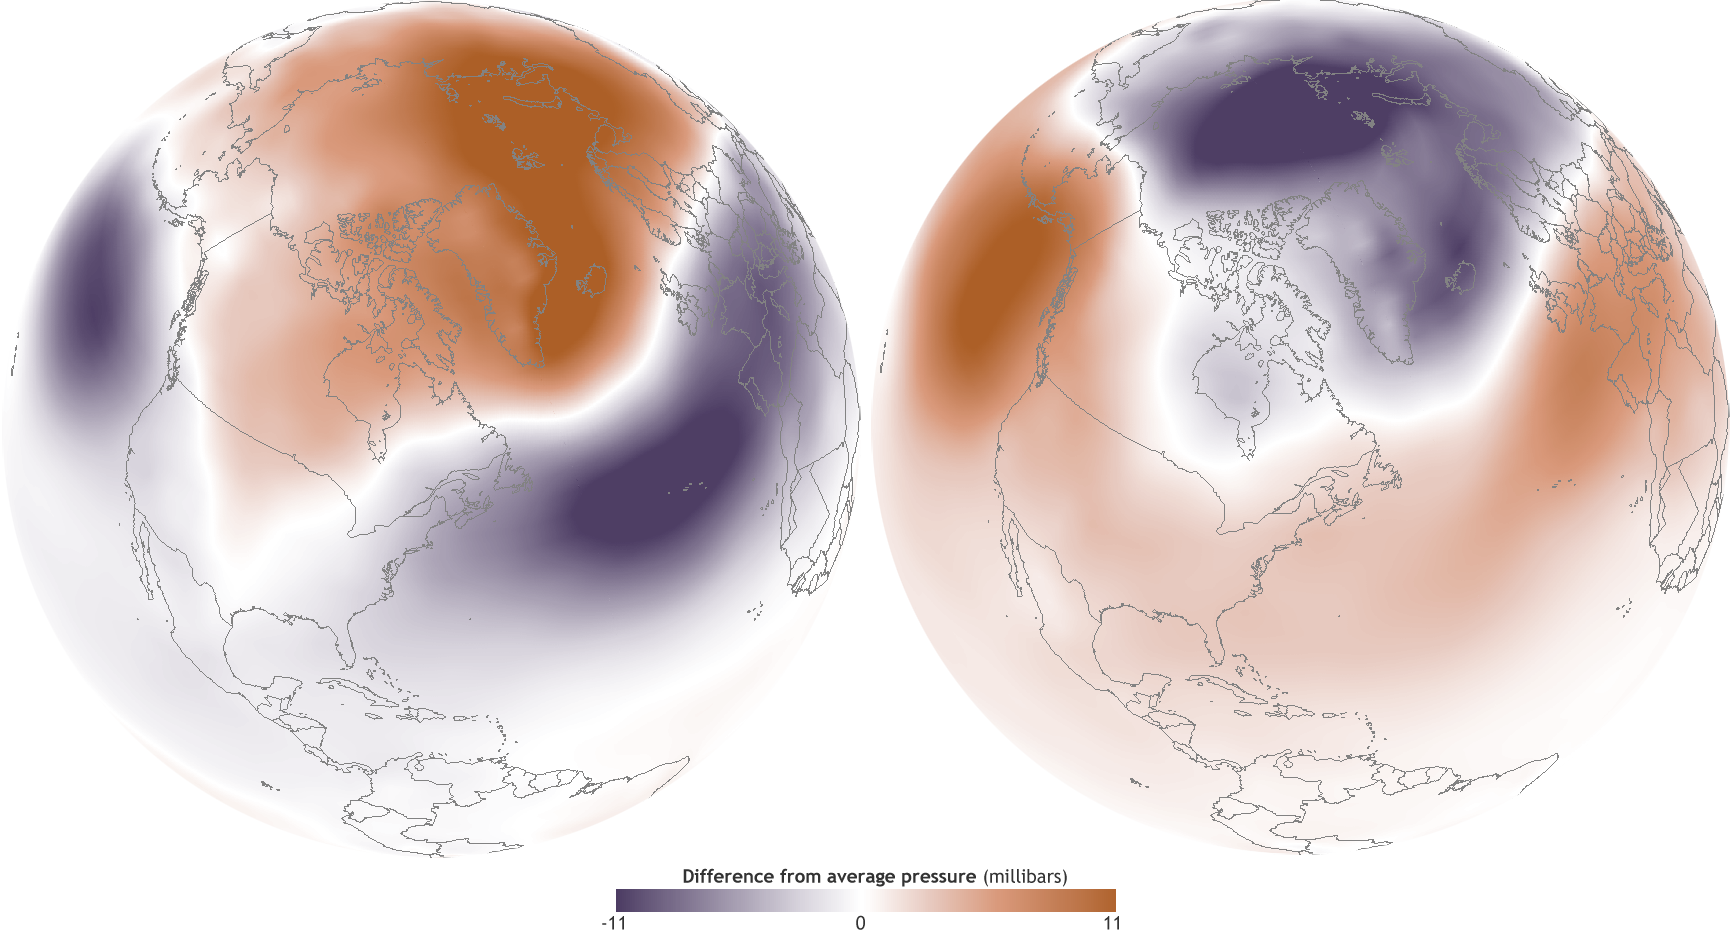 [Difference from average pressure at sea level during strongly negative (left, December 2009-February 2010) and positive (right, December 1988-February 1989) phases of the Arctic Oscillation. Higher-than-average pressure is orange; lower-than-average pressure is purple. Maps by NOAA Climate, based on NCEP Reanalysis data provided by NOAA ESRL, Physical Sciences Division.]
A pressure pattern quartet
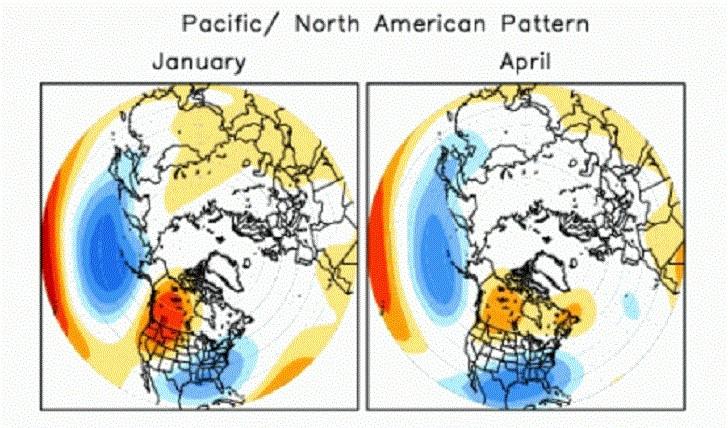
Similar to how a river will flow faster when pinched between two boulders, the atmosphere has similar disruptions due to Earth’s geography, the spin of the planet, and differences in solar heating. One such semi-permanent feature is the Asian-Pacific jet stream, a fast moving river of air that rips off the coast of Japan and crosses over a large swath of the North Pacific Ocean. We’ve talked about this jet stream before because of how it moves sometimes in association with El Niño and La Niña (ENSO). This jet stream is a major reason the PNA pattern exists; the PNA prefers to exist near the exit region of this jet—and in fact derives some energy from this jet, especially in the winter (1).
[December-February 500-hPa geopotential height anomalies regressed onto the monthly PNA index (available here). Data shown for 1979-80 to 2018-19. Purple shading indicates below-average pressure and winds that flow counter-clockwise following the contours. Orange shading denotes above-average pressure and winds that flow clockwise. NOAA Climate map using NCEP/NCAR reanalysis data.]
We could measure the PNA with winds, but it is more often measured by pressure patterns, which are strongly related to winds (many of the atmosphere’s preferred patterns have very visible footprints in pressure) (2). In the positive state of the PNA, above-average pressure is found over the subtropical Pacific (close to Hawaii) and centered over western Canada. Below-average pressure occurs over the North Pacific Ocean and along the southeastern United States. The negative state of the PNA results in the same pattern except with opposite anomalies (regions that have above-average pressure become below-average and vice versa).
These changes to the atmospheric circulation influence surface climate conditions. During the positive PNA, a big anomalous ridge of high pressure over Canada results in fewer cold air outbreaks over Alaska, Canada, and the northern tier of the United States (the opposite is true for negative PNA… brrrr!). Texas, the Southeast United States, and most of the East Coast trend colder thanks to the anomalous trough of low pressure over this region.
[December-February surface temperature anomalies regressed onto the monthly PNA index (available here). Data shown for 1979-80 to 2018-19. Red shading indicates above-average temperatures and blue shading indicates below-average temperatures. NOAA Climate map using CPC GHCN+CAMS data.]
A positive PNA is also linked to increased precipitation next to the Gulf of Mexico and Florida and over most of the southern coast of Alaska, while it decreases precipitation over the Ohio and Tennessee Valleys, stretching up to the Great Lakes and over the Pacific Northwest and Northern Rockies.
[December-February surface precipitation anomalies regressed onto the monthly PNA index (available here). Data shown for 1979-80 to 2018-19. Green shading indicates above-average precipitation and brown shading indicates below-average precipitation. NOAA Climate map using CPC Unified precipitation data.]
Tropical teleconnections
The PNA is considered a climate pattern because we usually define it using monthly or seasonal averages (in this post I’m displaying monthly averages during December–February —more in footnote #4), but the PNA often fluctuates quite a bit from week to week. Some of those fluctuations relate to other climate phenomena like the Madden-Julian Oscillation (MJO). Our blogging colleague, Nat Johnson, was part of such a study that showed that when the MJO-related convection (an area of rising air that lead to clouds and rainfall) is located over the Indian Ocean and Maritime Continent, negative PNA-like patterns become more likely, while a positive PNA is more likely when MJO-related convection is located closer to the central Pacific. Tropical rainfall can modulate the PNA because the rising air and atmospheric heating that accompanies tropical cloud formation can cause tremendous motion in the upper levels of our atmosphere (first image in this post). That motion and the rotation of our planet can help extend or retract the jet stream. Shifts in the jet cause large changes in pressure not only near the jet stream, but downstream of it as well because a big change in pressure in one area can cause it to subsequently change nearby (3). Because tropical heating can cause changes in the jet stream, it is not surprising that ENSO also has a relationship with the PNA, where La Niña can be associated with the negative state of the PNA, and El Niño is linked to the positive state of the PNA. This link doesn’t always occur (and it certainly didn’t this past winter), but they are correlated, which is why the images shown above have some similarities to ENSO (4).
A preferred pattern, but not necessarily predictable
This brings me to a very important, but not often discussed issue in climate variability and the prediction of it, which is that a big chunk of the PNA is internally driven. Many folks don’t like to discuss this internal variability because (a) I mean, honestly, can you think of a more boring or confusing term? and (b) it is generally considered the part of climate we cannot predict. It’s related to chaos, uncertainty, and all the stuff that makes it hard to sleep at night. Who wants to talk about that? A great example of this is in this article that Tom recently wrote in which he pointed out there was a prominent negative PNA pattern during February 2019 (to compare, mentally flip the colors in the images above), which, well, kind of disrupted the winter outlook because it was not anticipated in advance. In this context, internal variability means mechanisms and physical processes internal to the atmosphere. There is no clear “forcing” like warmer-than-average sea surface temperature anomalies or a massive volcanic eruption that can be observed in advance and then its influence predicted because of some known cause-and-effect process. Every now and then the PNA pattern will become more prominent or shift states and we simply don’t know why (5). It just does because the atmosphere is a wild and crazy place. The PNA is considered the second “leading” pattern of the Northern Hemisphere, with the Arctic Oscillation or North Atlantic Oscillation in first place because it describes slightly more of the atmospheric variations across the hemisphere.
[Difference from average pressure at sea level during strongly negative (left, December 2009-February 2010) and positive (right, December 1988-February 1989) phases of the Arctic Oscillation. Higher-than-average pressure is orange; lower-than-average pressure is purple. Maps by NOAA Climate, based on NCEP Reanalysis data provided by NOAA ESRL, Physical Sciences Division.]
Footnotes
(1) Check out Simmons et al., (1983) and Frederikson (1983) for details on “the barotropic instability of the mean flow.” Definitely not going to cover it comprehensively here, but this type of instability arises from horizontal shear in the flow due to variability in the jet intensity. This instability provides energy to wave fields that may be nearby, such as Rossby waves arising from tropical heating. Though the PNA may partially exist due to this barotropic instability from the Asian-Pacific jet, it is not likely to be exclusively due to it, as other baroclinic effects (e.g. diabatic heating, transient eddies) can play a role as well (Feldstein, 2002) (2) Winds on a map can sometimes look messy, while the sort of pressure patterns we examine in climate are quite smooth and large-scale, so easier to see. At the level we’re looking at here (500mb), the winds are strongly geostrophic. Where you see above-average pressure (orange shading in the image), the winds blow clockwise following the contours. Where you see below-average pressure (purple shading in the image), winds blow counter-clockwise. (3) The downstream centers of the PNA are due to the linear dispersion of these waves. I’ll let NOAA GFDL’s Isaac Held explain the dynamics of this on his blog. Bonus: there are movies! (4) I want to make a subtle, but important point here in the safety of the footnotes. The maps I’m generating in the blog post are based on monthly average data during December-February. If I use seasonal average data instead (averaging together December-February) then I get slightly different maps. What happens when I use seasonal average data is that the PNA maps look a lot like the maps that are associated with ENSO. And that’s not surprising because the seasonal average PNA index is correlated with the seasonal average ENSO index (Niño-3.4) at a level of 0.61, which means that about 37% of the seasonal variability in one index explains the other index. That’s a pretty strong relationship! However, if I look at monthly average data then the correlation drops to 0.37, meaning that about 14% of the monthly variability is related between ENSO and the PNA. The reason for this difference is that the PNA pattern is more strongly forced (or driven) by ENSO on a seasonal timescale than on a monthly timescale. If you read between the lines, this higher association with ENSO also indicates the seasonal PNA is more predictable than the monthly PNA, which is more internally driven and therefore unpredictable. This issue of climate timescales is something I got more into in this post. The climate drivers will change depending on whether you’re looking at a weekly average versus a monthly average versus a seasonal average. [thanks to Steve Baxter (CPC) for an enlightening conversation about the differences in the monthly versus seasonal average PNA.] (5) Nat thinks I should clarify this statement some more and I agree. Part of why the PNA is unpredictable is the tiny, butterfly-sized uncertainties in the initial conditions that we can’t possibly anticipate. Emily also talked about this concept in her blog post on chaos in climate models. So, while it may sometimes seem as if “we don’t know why” is reflecting ignorance, internal variability may represent a fundamental, inherent limit on predictability. Feldstein (2000) showed the PNA has a short e-folding timescale (~10 days), which in English says the predictability of daily changes (as displayed in CPC’s teleconnections page) is typically limited out to about 10 days. Edited for WeatherNation by Meteorologist Mace MichaelsAll Weather News
More
Significant Storm Threat Today, Friday
The spring season often means rounds of stron
25 Apr 2024 1:55 PM
Weekend Forecast: More Severe Weather
We are looking at the threat of another sever
25 Apr 2024 1:50 PM

National Park Week: Get Out and Explore
National Park Week started Saturday, April 20
25 Apr 2024 1:45 PM
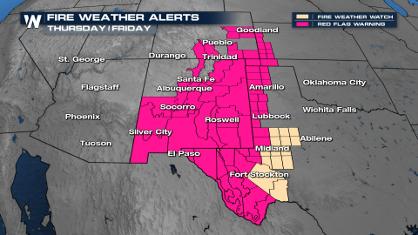
Critical Fire Risk in West Texas, New Mexico
A critical fire risk is in place for west Tex
25 Apr 2024 1:40 PM
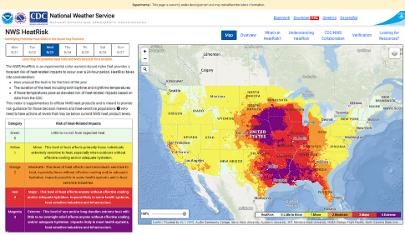
NOAA Debuts "HeatRisk" Tool Nationwide
More people die from heat every year than ALL
25 Apr 2024 1:35 PM

Double Trouble: Cicadas Take to the Skies this Spring
It’s the soundtrack to the summer. Nature’s n
25 Apr 2024 1:25 PM
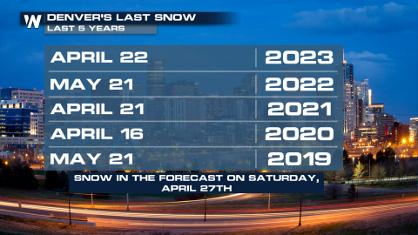
Record Warmth to Weekend Snow in the Four Corners
Snow is in the forecast for Denver, which cou
25 Apr 2024 1:20 AM