Tornados and La Niña, the 2021 Edition
Special Stories
6 Jul 2021 2:00 AM
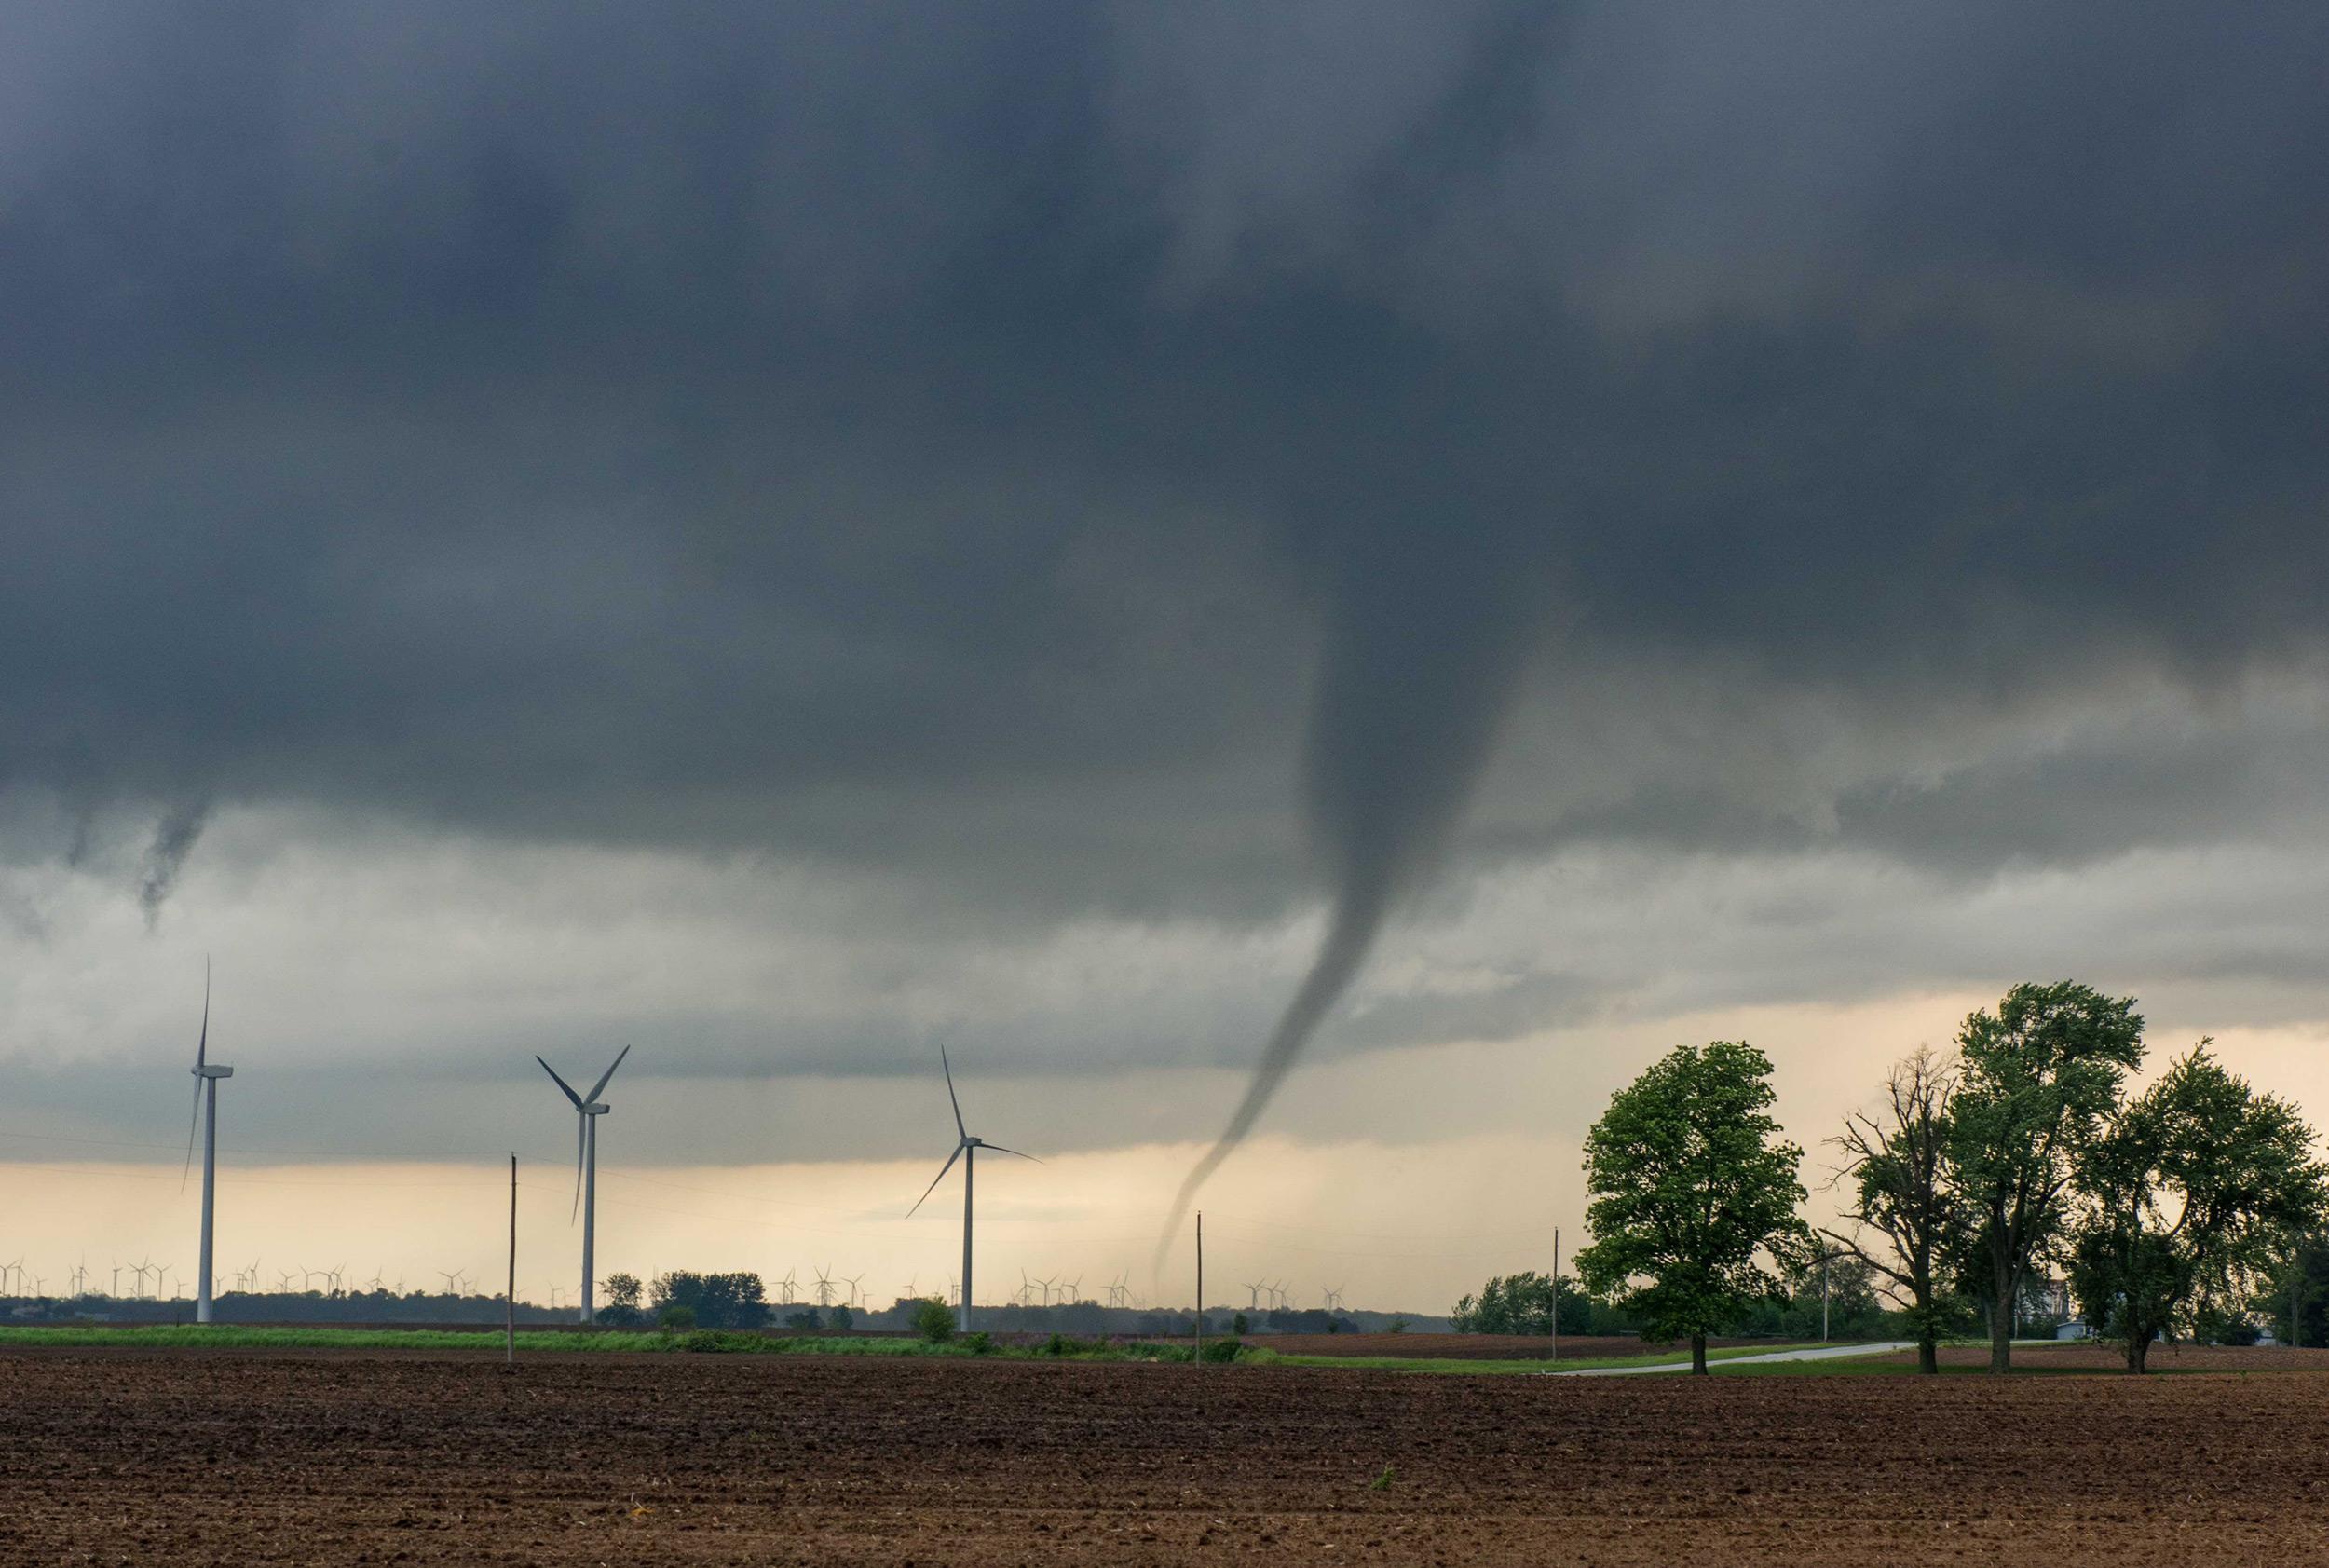
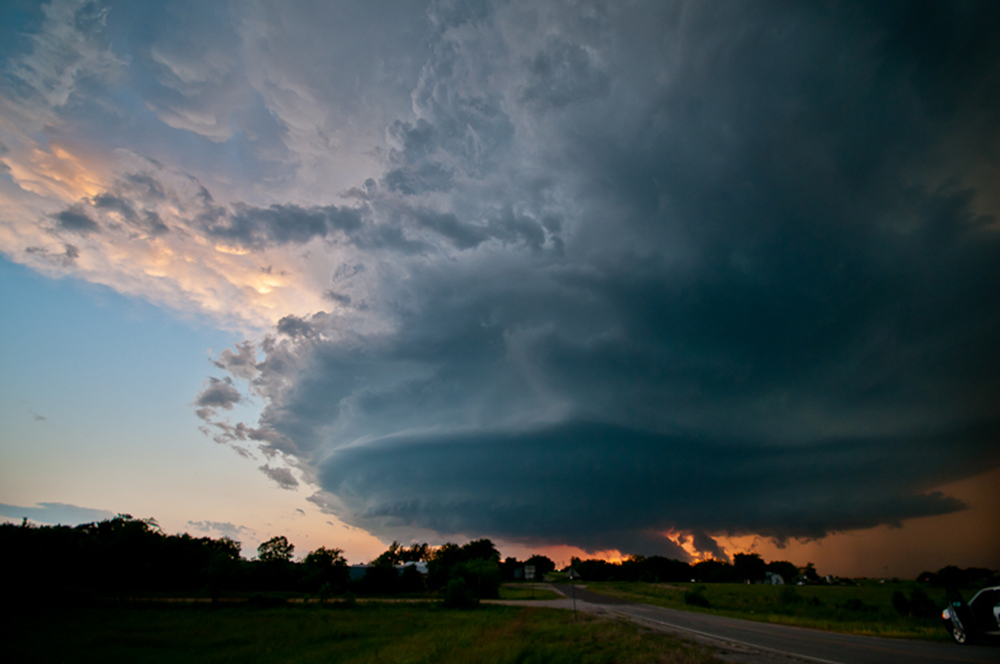
[Photo by John Allen via NOAA.]
[From NOAA Climate by John Allen] La Niña’s influence is linked to a higher frequency of tornadoes in the spring. However, although La Niña conditions were present through April, 2021, the year so far has recorded below-average tornado counts. Now that we are through the peak of the season, discussion among forecasters has turned toward deliberating over the low tornado frequency in what many predicted to be an active season (1).
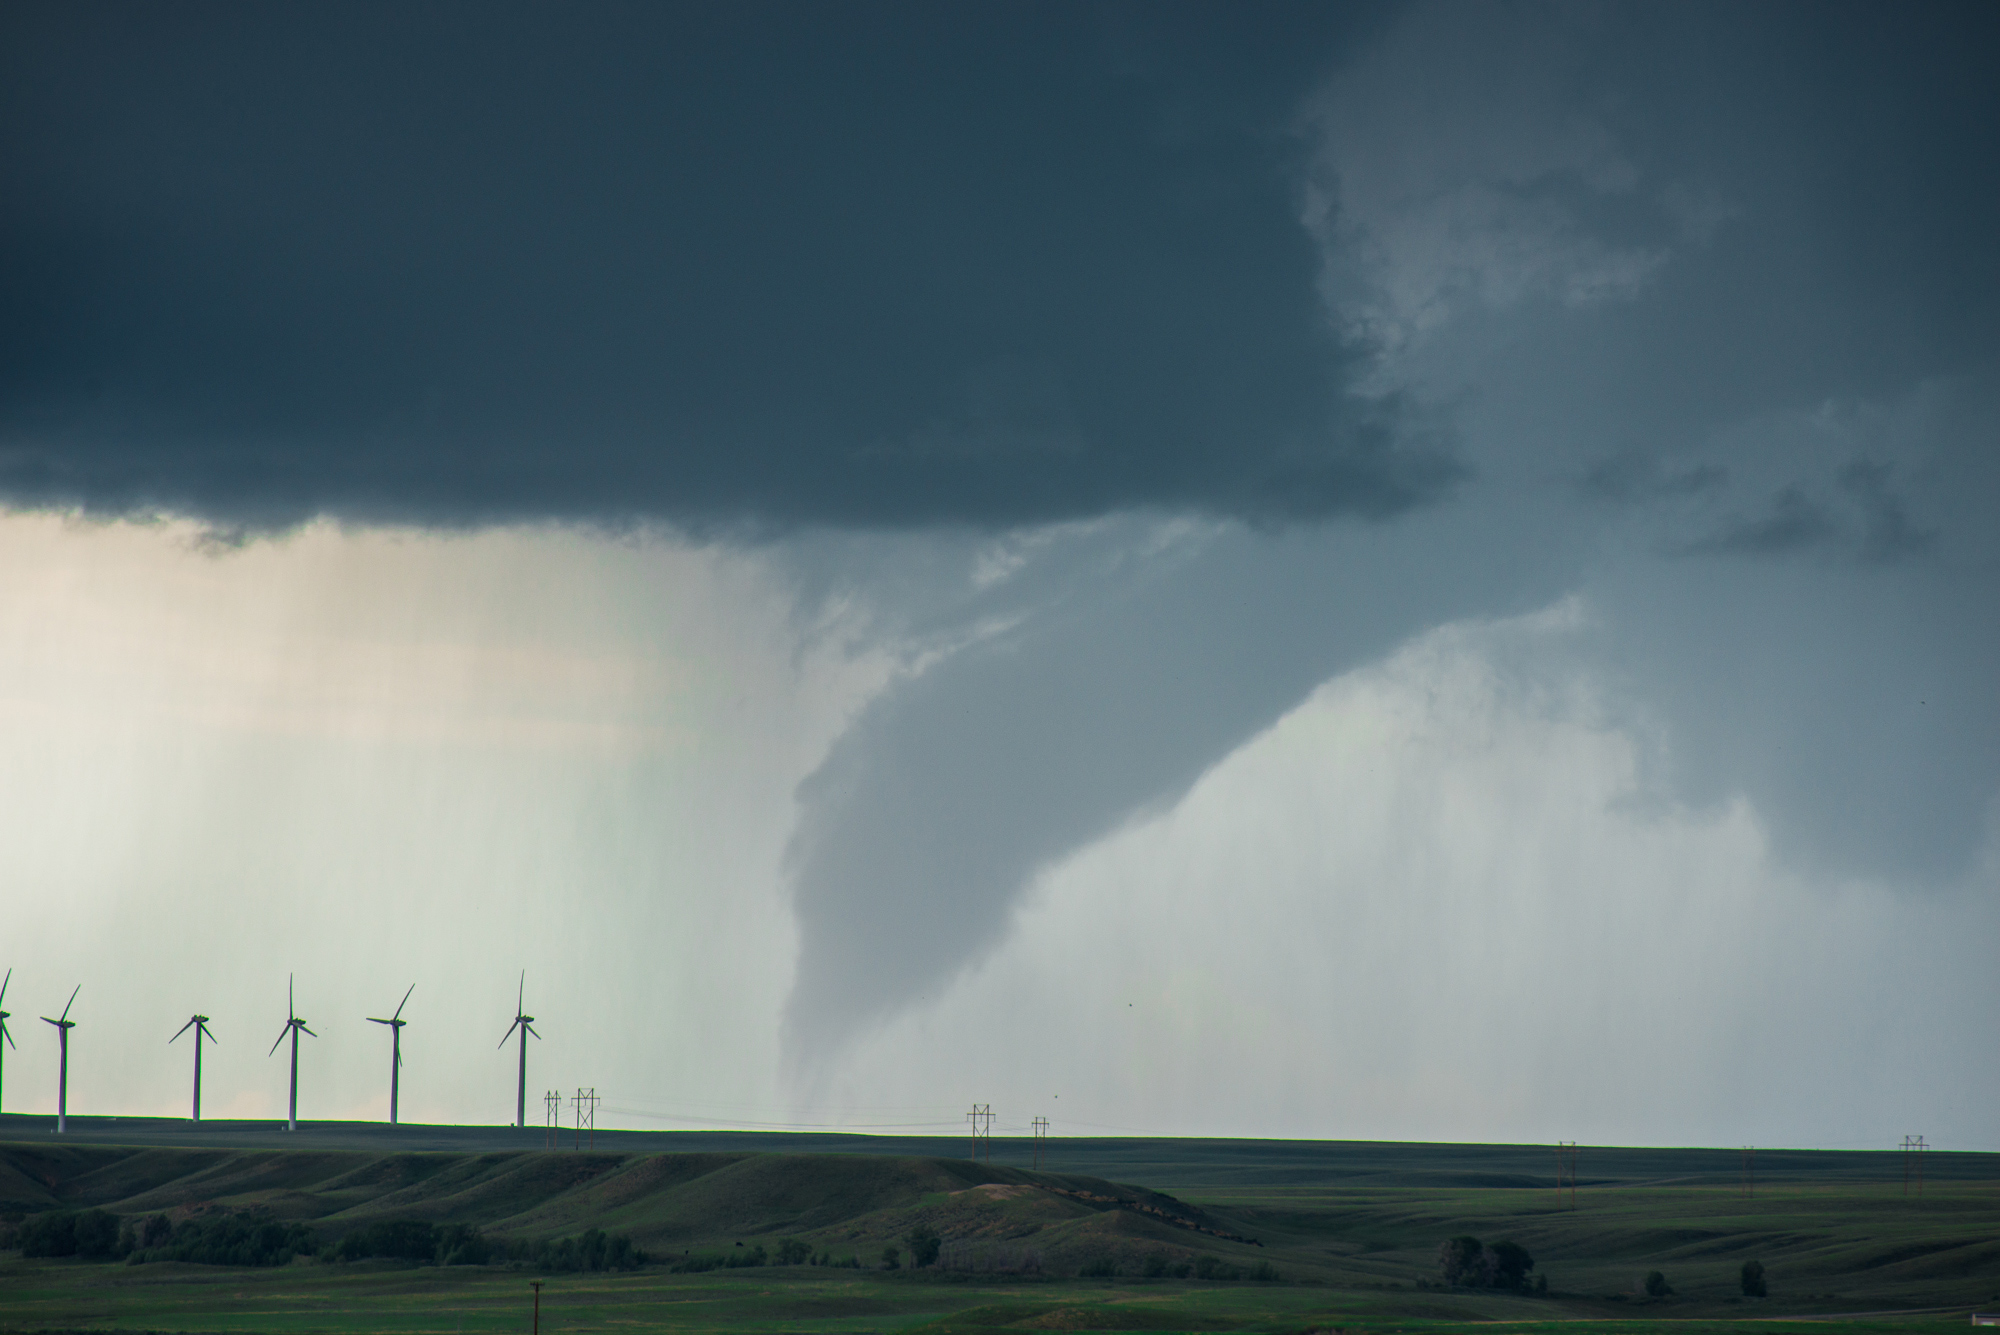 [Photo by John Allen via NOAA.]
Connecting tornadoes to the larger climate system is a hard problem, as the frequency of tornadoes typically has large year-to-year variability. However, the idea of a connection between ENSO and severe thunderstorms and tornadoes is not new, with some of the most tornado-active years in history being associated with La Niña (Marzban and Schaefer 2001, Cook and Schaefer 2008). We also know that you don’t need ENSO to get a lot of tornadoes—a year when ENSO is neutral sees on average around 1,200 tornadoes across the United States, with the majority occurring in the March to June window.
In the past decade, we’ve made great advances in understanding what causes this year-to-year variability (2), thanks to extended computer simulations of past events, new high-quality datasets that can tell us about the favorable conditions for tornado development, and the development of longer records of tornado observations. Through this, we’ve been able to show that, generally, El Niño leads to fewer tornado events in the spring, while La Niña tends toward higher-than-normal frequency.
During La Niña, the jet stream that drives much of our weather is somewhat weakened relative to neutral years, and the mid-latitude branch is diverted northward toward the Arctic over the western or central Pacific, and southward over northwestern North America. (Visit this post for details on how La Niña changes the jet stream.) This split path typically favors low-pressure systems developing east of the Rockies (Allen et al. 2015, Cook et al. 2017). It is this weather-climate “teleconnection” that most readily connects ENSO to tornado occurrence. The frequency of these low-pressure systems turns out to be key for bringing all the pieces together to produce tornado outbreaks, including wind shear (3), the fronts that initiate storms (Lagerquist et al. 2020), the moisture transport and the mid-level atmospheric instability that strengthen storms (Muñoz and Enfield 2011).
[Photo by John Allen via NOAA.]
Connecting tornadoes to the larger climate system is a hard problem, as the frequency of tornadoes typically has large year-to-year variability. However, the idea of a connection between ENSO and severe thunderstorms and tornadoes is not new, with some of the most tornado-active years in history being associated with La Niña (Marzban and Schaefer 2001, Cook and Schaefer 2008). We also know that you don’t need ENSO to get a lot of tornadoes—a year when ENSO is neutral sees on average around 1,200 tornadoes across the United States, with the majority occurring in the March to June window.
In the past decade, we’ve made great advances in understanding what causes this year-to-year variability (2), thanks to extended computer simulations of past events, new high-quality datasets that can tell us about the favorable conditions for tornado development, and the development of longer records of tornado observations. Through this, we’ve been able to show that, generally, El Niño leads to fewer tornado events in the spring, while La Niña tends toward higher-than-normal frequency.
During La Niña, the jet stream that drives much of our weather is somewhat weakened relative to neutral years, and the mid-latitude branch is diverted northward toward the Arctic over the western or central Pacific, and southward over northwestern North America. (Visit this post for details on how La Niña changes the jet stream.) This split path typically favors low-pressure systems developing east of the Rockies (Allen et al. 2015, Cook et al. 2017). It is this weather-climate “teleconnection” that most readily connects ENSO to tornado occurrence. The frequency of these low-pressure systems turns out to be key for bringing all the pieces together to produce tornado outbreaks, including wind shear (3), the fronts that initiate storms (Lagerquist et al. 2020), the moisture transport and the mid-level atmospheric instability that strengthen storms (Muñoz and Enfield 2011).
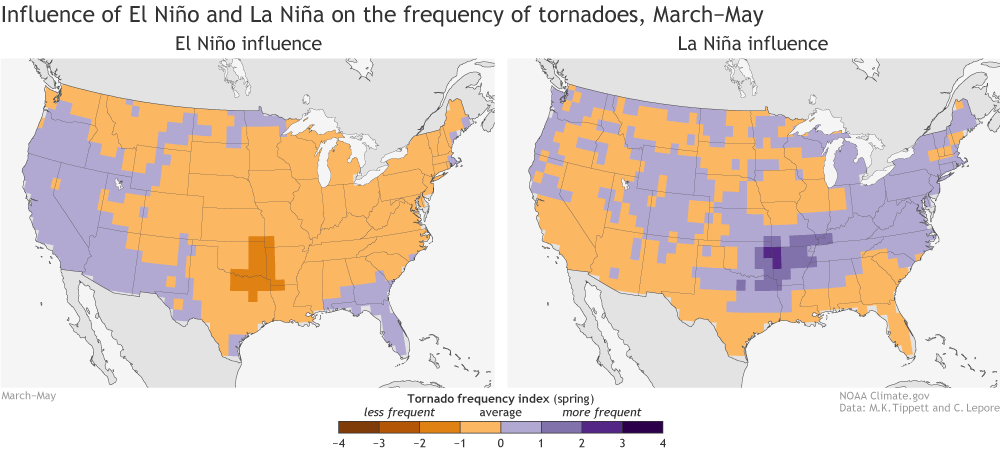 [March-May values of a blend of tornado reports with a tornado environment index (TEI) for El Nino and La Nina years. Maps by climate.gov; data from C. Lepore and M. Tippett.]
La Niña certainly does not always increase tornado likelihood. For example, a similar magnitude La Niña in 1989 was accompanied by a similar near- to below-average tornado season to 2021 so far. Like all climate influences on the weather scale, you can think of La Niña weighting the dice in favor tornado events, while on the flipside El Niño reduces the overall likelihood. In any one case, however, the specific atmospheric pattern on shorter timescales plays an important role (4).
[March-May values of a blend of tornado reports with a tornado environment index (TEI) for El Nino and La Nina years. Maps by climate.gov; data from C. Lepore and M. Tippett.]
La Niña certainly does not always increase tornado likelihood. For example, a similar magnitude La Niña in 1989 was accompanied by a similar near- to below-average tornado season to 2021 so far. Like all climate influences on the weather scale, you can think of La Niña weighting the dice in favor tornado events, while on the flipside El Niño reduces the overall likelihood. In any one case, however, the specific atmospheric pattern on shorter timescales plays an important role (4).
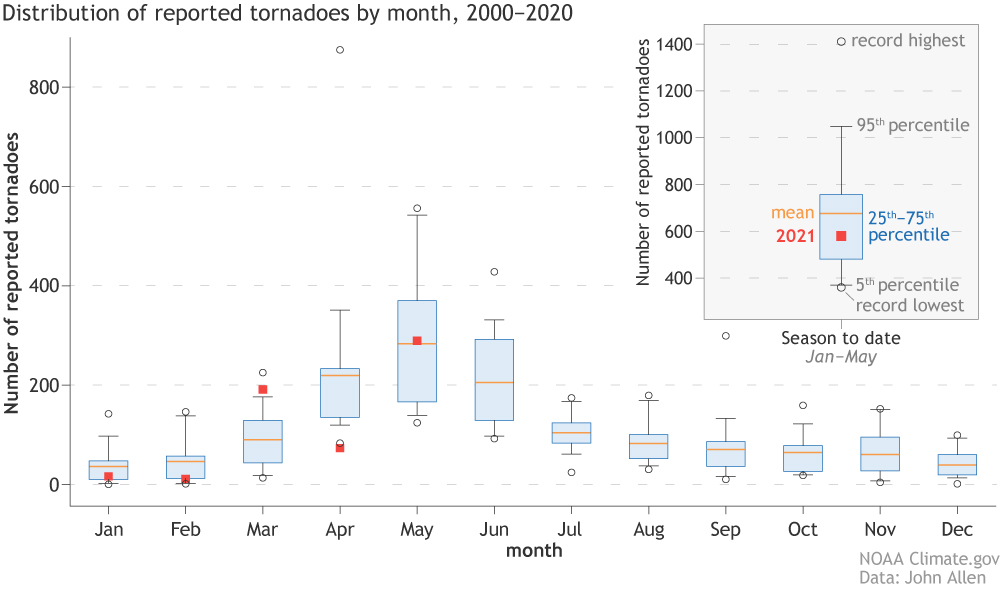 [5th-95th percentile box-and-whisker distributions of Storm Prediction Center monthly tornado reports for the period 2000-2020 as compared to the value for 2021 (red square). Orange horizontal line corresponds to the dataset mean. Outliers are indicated by the unfilled circles. Inset: January 1 to May 31 2021 season-to-date comparison. Climate.gov figure based on original from John Allen. Correction 7/1/21: The original version of this graphic mislabeled the range of values shown by the blue boxes. The boxes show values in the 25th-75th percentile, not the 5th-95th percentile.]
The most recent story to grab the headlines has been the surprise that, through the middle of June 2021, we did not record an EF3 tornado for the first time since reliable records began in the 1950s (though this changed on June 20th). However, this is somewhat unsurprising, as without the volume of higher tornado frequency days, the probability of stronger tornadoes is also lower. This statistic can also be misleading – tornado damage is only rated if the tornado hits a structure well-built enough to withstand it. With shorter tornado path lengths, and fewer tornadoes, the likelihood of a storm crossing paths with structures or other damage indicators decreases. This is further compounded by tornadoes rarely occurring in their usual regions where damage is more likely.
[5th-95th percentile box-and-whisker distributions of Storm Prediction Center monthly tornado reports for the period 2000-2020 as compared to the value for 2021 (red square). Orange horizontal line corresponds to the dataset mean. Outliers are indicated by the unfilled circles. Inset: January 1 to May 31 2021 season-to-date comparison. Climate.gov figure based on original from John Allen. Correction 7/1/21: The original version of this graphic mislabeled the range of values shown by the blue boxes. The boxes show values in the 25th-75th percentile, not the 5th-95th percentile.]
The most recent story to grab the headlines has been the surprise that, through the middle of June 2021, we did not record an EF3 tornado for the first time since reliable records began in the 1950s (though this changed on June 20th). However, this is somewhat unsurprising, as without the volume of higher tornado frequency days, the probability of stronger tornadoes is also lower. This statistic can also be misleading – tornado damage is only rated if the tornado hits a structure well-built enough to withstand it. With shorter tornado path lengths, and fewer tornadoes, the likelihood of a storm crossing paths with structures or other damage indicators decreases. This is further compounded by tornadoes rarely occurring in their usual regions where damage is more likely.
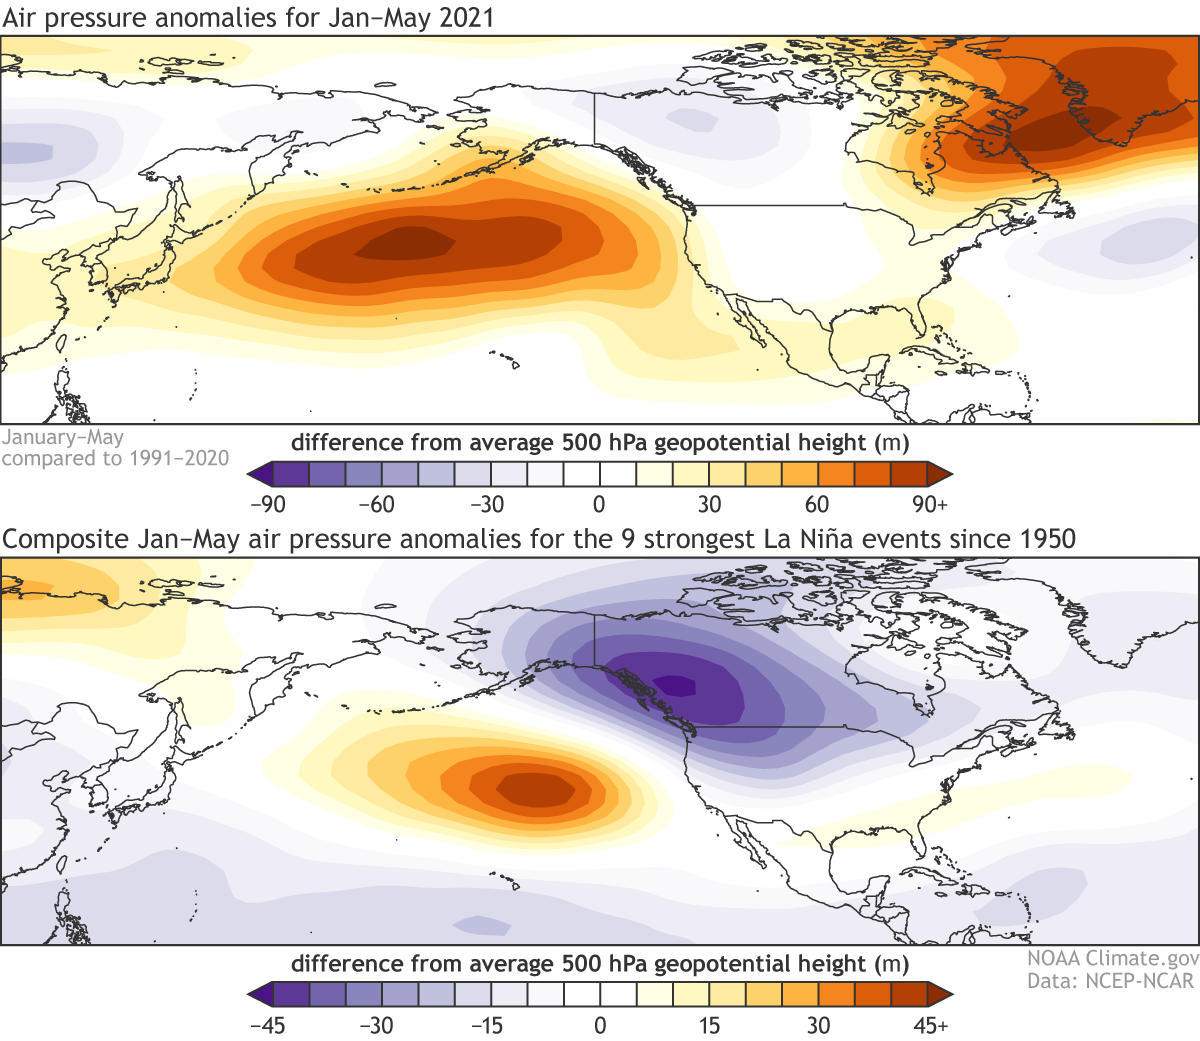 [(Top) Geopotential height anomalies (m) at the 500 hectopascal (hPa) pressure level during January–May 2021. Cold colors indicate below-average atmospheric pressure and warm colors indicate above-average atmospheric pressure at a level about three miles above the Earth’s surface. (Bottom) The average 500 hPa geopotential height anomalies from January–May for the 9 strongest La Niña episodes since 1950. Note the different scaling between the top and bottom figures. The top figure has a wider range of values because the top figure includes contributions from both predictable signals, like La Niña, and random weather variability, whereas the bottom figure has filtered out most of the random weather variability. Anomalies are calculated with respect to the 1991-2020 base period. Figure by John Allen and NOAA Climate.gov with NCEP/NCAR Reanalysis data obtained from the NOAA Physical Sciences Laboratory.]
This is not to say we didn’t get some smaller tornado outbreaks, such as those in late March and early May, but overall the spring and early summer were less favorable for producing these important low-pressure systems, and hence tornadoes.
The un-La Niña-ish atmosphere over North America meant that suggesting that the spring tornado season would be active was fraught with danger! Nonetheless, some of the calling cards of La Niña did persist from the winter months; for example, persistent dry conditions across the southwest since last fall. The challenge here is that it is nearly impossible to attribute tornado variability solely to the contributions of ENSO. As has been discussed on the ENSO Blog before, ENSO is very much like the violin section of an orchestra—it leads the movement of variability in our atmosphere. But what would a symphony by Beethoven or Mozart sound like without punctuation from other sections of the orchestra, both on shorter intervals and helping drive the overall piece?
The tornado season of 2021 might be past its peak, but we certainly aren’t out of the woods just yet. However, the difference between expectation (higher than normal) and observations (lower than normal) thus far highlights the need to further explore the details of what drives variability in tornado frequency. Open questions also remain about how long ENSO’s influence persists into the spring months and how robust its influence on the atmosphere is, factors that may have played a role in this season’s evolution. It also suggests that greater caution is needed to understand the other processes at play before suggesting any given La Niña year will be the next 2011–as 1989 showed us prior to 2021, not all La Niña events favor such extreme generational outliers.
Lead NOAA Climate Editor: Emily Becker\
[(Top) Geopotential height anomalies (m) at the 500 hectopascal (hPa) pressure level during January–May 2021. Cold colors indicate below-average atmospheric pressure and warm colors indicate above-average atmospheric pressure at a level about three miles above the Earth’s surface. (Bottom) The average 500 hPa geopotential height anomalies from January–May for the 9 strongest La Niña episodes since 1950. Note the different scaling between the top and bottom figures. The top figure has a wider range of values because the top figure includes contributions from both predictable signals, like La Niña, and random weather variability, whereas the bottom figure has filtered out most of the random weather variability. Anomalies are calculated with respect to the 1991-2020 base period. Figure by John Allen and NOAA Climate.gov with NCEP/NCAR Reanalysis data obtained from the NOAA Physical Sciences Laboratory.]
This is not to say we didn’t get some smaller tornado outbreaks, such as those in late March and early May, but overall the spring and early summer were less favorable for producing these important low-pressure systems, and hence tornadoes.
The un-La Niña-ish atmosphere over North America meant that suggesting that the spring tornado season would be active was fraught with danger! Nonetheless, some of the calling cards of La Niña did persist from the winter months; for example, persistent dry conditions across the southwest since last fall. The challenge here is that it is nearly impossible to attribute tornado variability solely to the contributions of ENSO. As has been discussed on the ENSO Blog before, ENSO is very much like the violin section of an orchestra—it leads the movement of variability in our atmosphere. But what would a symphony by Beethoven or Mozart sound like without punctuation from other sections of the orchestra, both on shorter intervals and helping drive the overall piece?
The tornado season of 2021 might be past its peak, but we certainly aren’t out of the woods just yet. However, the difference between expectation (higher than normal) and observations (lower than normal) thus far highlights the need to further explore the details of what drives variability in tornado frequency. Open questions also remain about how long ENSO’s influence persists into the spring months and how robust its influence on the atmosphere is, factors that may have played a role in this season’s evolution. It also suggests that greater caution is needed to understand the other processes at play before suggesting any given La Niña year will be the next 2011–as 1989 showed us prior to 2021, not all La Niña events favor such extreme generational outliers.
Lead NOAA Climate Editor: Emily Becker\
 [Photo by John Allen via NOAA.]
1) Tornado season is not easily defined, as tornadoes can occur on any day of the year. Despite this challenge, the vast majority of tornadoes occur between the beginning of March and the end of June each year, with ~1000 of the 1400 per year on average (averaged over 2005–2015) occurring between this period. Tornado season also varies by location. In the southeastern United States, tornado season is typically between February and April. In the central Great Plains, the peak is closer to April to June, and in the Midwest and close to the Rockies May through the end of June are typically the peak months. By July, the majority of tornado activity has shifted north to Canada.
2) Some recent studies include Lee et al. 2013, Allen et al. 2015, Cook et al. 2017, Lepore et al. 2017, Molina et al. 2018, and Lee et al. 2021.
3) Wind shear is the presence a degree of changing wind speed and direction at different levels of the atmosphere. The easiest way to see wind shear is by looking up at the clouds – if you see clouds moving in different directions, that is wind shear. Wind shear is important to the storms that produce tornadoes, it helps the organize the storms shape, move rain away from the updraft, and allows a storm to sustain itself outside the normal lifetime of a thunderstorm to several hours. Developing tornadoes also require the presence of changing wind speed and direction with height close to the ground, as the presence of shear generates ‘spin’ that can be stretched upwards to form the tornado.
4) The trouble with understanding tornado variability is that it’s affected by both small-scale and large-scale processes. Non-ENSO contributors to tornado variability identified so far include the Arctic Oscillation, North Atlantic Oscillation, Madden-Julian Oscillation, Global Wind Oscillation, and sea surface temperatures in the Gulf of Mexico (Molina et al. 2018). Each of these signals can project upon ENSO in either a constructive or destructive manner such that it can be very difficult to tease out which element was responsible for any sub-seasonal period of activity, and these interplays are generally poorly understood. That these influences can range from sub-seasonal scales of weeks to months can mean the difference between an overall active season and an inactive one can be dependent on the smallest of margins.
Adding to the challenge is that tornadoes are rather temperamental about the conditions they form in and difficult to predict on short timescales, making them a challenging seasonal forecast target. Too warm and tornadoes become less frequent, too dry and the same result is likely. Even in a “perfect” environment where violent tornadoes seem certain, timing is everything, and small differences as to the arrival of an individual trough impulse, or a slightly warmer-than-expected layer in the atmosphere can mean no storms form at all. This was exemplified in the predicted violent tornado outbreak that failed to realize on May 20, 2019.
5) A severe thunderstorm is defined as any convective storm that produces one or more of hail of 1 inch or large in diameter, storm induced winds of 58 mph or greater, or a tornado.
6) Long periods of relative quiet are more in line with La Niña conditions. For example, after more than 800 tornadoes in April 2011, May saw little to no activity before the 21st, before producing 241 tornadoes in the following 5 days. While these periods of relatively low frequency occur in most years, this pattern is particularly prevalent during La Niña, as is a tornado season that is skewed toward occurring earlier in the spring (Allen et al. 2018).
[Photo by John Allen via NOAA.]
1) Tornado season is not easily defined, as tornadoes can occur on any day of the year. Despite this challenge, the vast majority of tornadoes occur between the beginning of March and the end of June each year, with ~1000 of the 1400 per year on average (averaged over 2005–2015) occurring between this period. Tornado season also varies by location. In the southeastern United States, tornado season is typically between February and April. In the central Great Plains, the peak is closer to April to June, and in the Midwest and close to the Rockies May through the end of June are typically the peak months. By July, the majority of tornado activity has shifted north to Canada.
2) Some recent studies include Lee et al. 2013, Allen et al. 2015, Cook et al. 2017, Lepore et al. 2017, Molina et al. 2018, and Lee et al. 2021.
3) Wind shear is the presence a degree of changing wind speed and direction at different levels of the atmosphere. The easiest way to see wind shear is by looking up at the clouds – if you see clouds moving in different directions, that is wind shear. Wind shear is important to the storms that produce tornadoes, it helps the organize the storms shape, move rain away from the updraft, and allows a storm to sustain itself outside the normal lifetime of a thunderstorm to several hours. Developing tornadoes also require the presence of changing wind speed and direction with height close to the ground, as the presence of shear generates ‘spin’ that can be stretched upwards to form the tornado.
4) The trouble with understanding tornado variability is that it’s affected by both small-scale and large-scale processes. Non-ENSO contributors to tornado variability identified so far include the Arctic Oscillation, North Atlantic Oscillation, Madden-Julian Oscillation, Global Wind Oscillation, and sea surface temperatures in the Gulf of Mexico (Molina et al. 2018). Each of these signals can project upon ENSO in either a constructive or destructive manner such that it can be very difficult to tease out which element was responsible for any sub-seasonal period of activity, and these interplays are generally poorly understood. That these influences can range from sub-seasonal scales of weeks to months can mean the difference between an overall active season and an inactive one can be dependent on the smallest of margins.
Adding to the challenge is that tornadoes are rather temperamental about the conditions they form in and difficult to predict on short timescales, making them a challenging seasonal forecast target. Too warm and tornadoes become less frequent, too dry and the same result is likely. Even in a “perfect” environment where violent tornadoes seem certain, timing is everything, and small differences as to the arrival of an individual trough impulse, or a slightly warmer-than-expected layer in the atmosphere can mean no storms form at all. This was exemplified in the predicted violent tornado outbreak that failed to realize on May 20, 2019.
5) A severe thunderstorm is defined as any convective storm that produces one or more of hail of 1 inch or large in diameter, storm induced winds of 58 mph or greater, or a tornado.
6) Long periods of relative quiet are more in line with La Niña conditions. For example, after more than 800 tornadoes in April 2011, May saw little to no activity before the 21st, before producing 241 tornadoes in the following 5 days. While these periods of relatively low frequency occur in most years, this pattern is particularly prevalent during La Niña, as is a tornado season that is skewed toward occurring earlier in the spring (Allen et al. 2018).
What happened?
To begin to address what happened in 2021, we need to go back to what these seasonal predictions are based on. While there are many contributing sources of tornado variability, there is a relationship between El Niño/Southern Oscillation (ENSO) and the frequency of tornadoes. Many people will remember that the last extremely active tornado year, 2011, was a strong La Niña year. A moderate La Niña was observed this past winter and was predicted to continue into the spring, leading to expectations and speculation in the media about a potentially active season. In this post, we consider the relevant factors and what this tells us about our capacity to predict seasonal tornado activity.How ENSO and tornadoes are related
[Photo by John Allen via NOAA.]
Connecting tornadoes to the larger climate system is a hard problem, as the frequency of tornadoes typically has large year-to-year variability. However, the idea of a connection between ENSO and severe thunderstorms and tornadoes is not new, with some of the most tornado-active years in history being associated with La Niña (Marzban and Schaefer 2001, Cook and Schaefer 2008). We also know that you don’t need ENSO to get a lot of tornadoes—a year when ENSO is neutral sees on average around 1,200 tornadoes across the United States, with the majority occurring in the March to June window.
In the past decade, we’ve made great advances in understanding what causes this year-to-year variability (2), thanks to extended computer simulations of past events, new high-quality datasets that can tell us about the favorable conditions for tornado development, and the development of longer records of tornado observations. Through this, we’ve been able to show that, generally, El Niño leads to fewer tornado events in the spring, while La Niña tends toward higher-than-normal frequency.
During La Niña, the jet stream that drives much of our weather is somewhat weakened relative to neutral years, and the mid-latitude branch is diverted northward toward the Arctic over the western or central Pacific, and southward over northwestern North America. (Visit this post for details on how La Niña changes the jet stream.) This split path typically favors low-pressure systems developing east of the Rockies (Allen et al. 2015, Cook et al. 2017). It is this weather-climate “teleconnection” that most readily connects ENSO to tornado occurrence. The frequency of these low-pressure systems turns out to be key for bringing all the pieces together to produce tornado outbreaks, including wind shear (3), the fronts that initiate storms (Lagerquist et al. 2020), the moisture transport and the mid-level atmospheric instability that strengthen storms (Muñoz and Enfield 2011).
[March-May values of a blend of tornado reports with a tornado environment index (TEI) for El Nino and La Nina years. Maps by climate.gov; data from C. Lepore and M. Tippett.]
La Niña certainly does not always increase tornado likelihood. For example, a similar magnitude La Niña in 1989 was accompanied by a similar near- to below-average tornado season to 2021 so far. Like all climate influences on the weather scale, you can think of La Niña weighting the dice in favor tornado events, while on the flipside El Niño reduces the overall likelihood. In any one case, however, the specific atmospheric pattern on shorter timescales plays an important role (4).
Tornadoes in 2021
Tornado activity—and, more broadly, severe thunderstorm activity—for 2021 has been lower than average after a somewhat late start (5). Both January and February are fickle months for tornado frequency, so a slow start doesn’t tell us much about the season to come. Considering tornado frequency against the historical record of the last 2 decades, March 2021 was an outlier and considerably above average, April 2021 was equally a below-average outlier, and May 2021 was near average. Despite being relatively quiet, for the season to date there was a preliminary total of 580 tornadoes reported through May 31st, less than the 2000–2020 average of 676.These events caused 13 fatalities. Also, despite the below-average tornado count in April, there were still some significant financial losses from severe weather. These resulted from hail events impacting major urban centers, and for 2021 the US is again on track to exceed $10 billion insured losses to severe storms. The vast majority of tornadoes in 2021 accumulated over just a few days in March and one particularly active period in May. This is fairly typical, as tornado outbreaks—clusters of tornadoes—and consecutive days with tornadoes are certainly not unusual (Tippett et al. 2016, Trapp 2014). March saw tornadoes on 16 days, with concentrated periods on March 13th, 17th, and the 25th–27th. April had no real large accumulation of tornadoes on any single day, while May had tornadoes on all but 5 days, with large events between the 2nd to the 4th and on the 26th, and 18 days in June with no widespread events and low numbers of tornado reports (6).
[5th-95th percentile box-and-whisker distributions of Storm Prediction Center monthly tornado reports for the period 2000-2020 as compared to the value for 2021 (red square). Orange horizontal line corresponds to the dataset mean. Outliers are indicated by the unfilled circles. Inset: January 1 to May 31 2021 season-to-date comparison. Climate.gov figure based on original from John Allen. Correction 7/1/21: The original version of this graphic mislabeled the range of values shown by the blue boxes. The boxes show values in the 25th-75th percentile, not the 5th-95th percentile.]
The most recent story to grab the headlines has been the surprise that, through the middle of June 2021, we did not record an EF3 tornado for the first time since reliable records began in the 1950s (though this changed on June 20th). However, this is somewhat unsurprising, as without the volume of higher tornado frequency days, the probability of stronger tornadoes is also lower. This statistic can also be misleading – tornado damage is only rated if the tornado hits a structure well-built enough to withstand it. With shorter tornado path lengths, and fewer tornadoes, the likelihood of a storm crossing paths with structures or other damage indicators decreases. This is further compounded by tornadoes rarely occurring in their usual regions where damage is more likely.
Putting it All Together: La Niña 2020–21
There has already been discussion this year about 2021 being “atmospherically” strange for a La Niña. While NOAA’s primary metric for ENSO, the three-month-average sea surface temperature anomaly in the Niño-3.4 region of the tropical Pacific (Oceanic Niño Index), suggested a moderate La Niña in terms of sea surface temperatures through the winter and early spring before waning into May, the circulation over North America didn’t seem to be playing the same tune. Nowhere is this more evident than considering the air pressure patterns as compared to historical La Niña events. The eastern Pacific high-pressure signature typical of La Niña was present, but this year was considerably stronger and broader across the north Pacific, while the low-pressure region over the northwestern United States was much weaker. Stronger surface highs over the eastern Pacific reflected the blocking of the typical flow pattern, and lack of troughing saw fewer low-pressure systems than average form east of the Rockies, with significant implications for precipitation and severe weather frequency over the Plains and Midwest.
[(Top) Geopotential height anomalies (m) at the 500 hectopascal (hPa) pressure level during January–May 2021. Cold colors indicate below-average atmospheric pressure and warm colors indicate above-average atmospheric pressure at a level about three miles above the Earth’s surface. (Bottom) The average 500 hPa geopotential height anomalies from January–May for the 9 strongest La Niña episodes since 1950. Note the different scaling between the top and bottom figures. The top figure has a wider range of values because the top figure includes contributions from both predictable signals, like La Niña, and random weather variability, whereas the bottom figure has filtered out most of the random weather variability. Anomalies are calculated with respect to the 1991-2020 base period. Figure by John Allen and NOAA Climate.gov with NCEP/NCAR Reanalysis data obtained from the NOAA Physical Sciences Laboratory.]
This is not to say we didn’t get some smaller tornado outbreaks, such as those in late March and early May, but overall the spring and early summer were less favorable for producing these important low-pressure systems, and hence tornadoes.
The un-La Niña-ish atmosphere over North America meant that suggesting that the spring tornado season would be active was fraught with danger! Nonetheless, some of the calling cards of La Niña did persist from the winter months; for example, persistent dry conditions across the southwest since last fall. The challenge here is that it is nearly impossible to attribute tornado variability solely to the contributions of ENSO. As has been discussed on the ENSO Blog before, ENSO is very much like the violin section of an orchestra—it leads the movement of variability in our atmosphere. But what would a symphony by Beethoven or Mozart sound like without punctuation from other sections of the orchestra, both on shorter intervals and helping drive the overall piece?
The tornado season of 2021 might be past its peak, but we certainly aren’t out of the woods just yet. However, the difference between expectation (higher than normal) and observations (lower than normal) thus far highlights the need to further explore the details of what drives variability in tornado frequency. Open questions also remain about how long ENSO’s influence persists into the spring months and how robust its influence on the atmosphere is, factors that may have played a role in this season’s evolution. It also suggests that greater caution is needed to understand the other processes at play before suggesting any given La Niña year will be the next 2011–as 1989 showed us prior to 2021, not all La Niña events favor such extreme generational outliers.
Lead NOAA Climate Editor: Emily Becker\
Footnotes
[Photo by John Allen via NOAA.]
1) Tornado season is not easily defined, as tornadoes can occur on any day of the year. Despite this challenge, the vast majority of tornadoes occur between the beginning of March and the end of June each year, with ~1000 of the 1400 per year on average (averaged over 2005–2015) occurring between this period. Tornado season also varies by location. In the southeastern United States, tornado season is typically between February and April. In the central Great Plains, the peak is closer to April to June, and in the Midwest and close to the Rockies May through the end of June are typically the peak months. By July, the majority of tornado activity has shifted north to Canada.
2) Some recent studies include Lee et al. 2013, Allen et al. 2015, Cook et al. 2017, Lepore et al. 2017, Molina et al. 2018, and Lee et al. 2021.
3) Wind shear is the presence a degree of changing wind speed and direction at different levels of the atmosphere. The easiest way to see wind shear is by looking up at the clouds – if you see clouds moving in different directions, that is wind shear. Wind shear is important to the storms that produce tornadoes, it helps the organize the storms shape, move rain away from the updraft, and allows a storm to sustain itself outside the normal lifetime of a thunderstorm to several hours. Developing tornadoes also require the presence of changing wind speed and direction with height close to the ground, as the presence of shear generates ‘spin’ that can be stretched upwards to form the tornado.
4) The trouble with understanding tornado variability is that it’s affected by both small-scale and large-scale processes. Non-ENSO contributors to tornado variability identified so far include the Arctic Oscillation, North Atlantic Oscillation, Madden-Julian Oscillation, Global Wind Oscillation, and sea surface temperatures in the Gulf of Mexico (Molina et al. 2018). Each of these signals can project upon ENSO in either a constructive or destructive manner such that it can be very difficult to tease out which element was responsible for any sub-seasonal period of activity, and these interplays are generally poorly understood. That these influences can range from sub-seasonal scales of weeks to months can mean the difference between an overall active season and an inactive one can be dependent on the smallest of margins.
Adding to the challenge is that tornadoes are rather temperamental about the conditions they form in and difficult to predict on short timescales, making them a challenging seasonal forecast target. Too warm and tornadoes become less frequent, too dry and the same result is likely. Even in a “perfect” environment where violent tornadoes seem certain, timing is everything, and small differences as to the arrival of an individual trough impulse, or a slightly warmer-than-expected layer in the atmosphere can mean no storms form at all. This was exemplified in the predicted violent tornado outbreak that failed to realize on May 20, 2019.
5) A severe thunderstorm is defined as any convective storm that produces one or more of hail of 1 inch or large in diameter, storm induced winds of 58 mph or greater, or a tornado.
6) Long periods of relative quiet are more in line with La Niña conditions. For example, after more than 800 tornadoes in April 2011, May saw little to no activity before the 21st, before producing 241 tornadoes in the following 5 days. While these periods of relatively low frequency occur in most years, this pattern is particularly prevalent during La Niña, as is a tornado season that is skewed toward occurring earlier in the spring (Allen et al. 2018).
All Weather News
More
Significant Storm Threat Today, Friday
The spring season often means rounds of stron
25 Apr 2024 5:55 PM
Weekend Forecast: More Severe Weather
We are looking at the threat of another sever
25 Apr 2024 5:50 PM
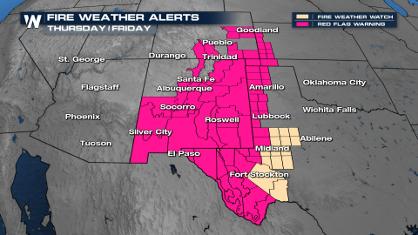
Critical Fire Risk in West Texas, New Mexico
A critical fire risk is in place for west Tex
25 Apr 2024 5:45 PM

National Park Week: Get Out and Explore
National Park Week started Saturday, April 20
25 Apr 2024 1:45 PM
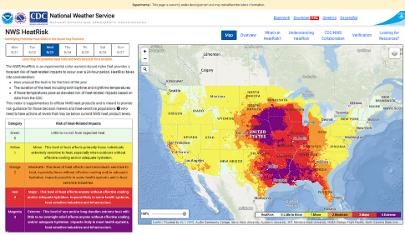
NOAA Debuts "HeatRisk" Tool Nationwide
More people die from heat every year than ALL
25 Apr 2024 1:35 PM
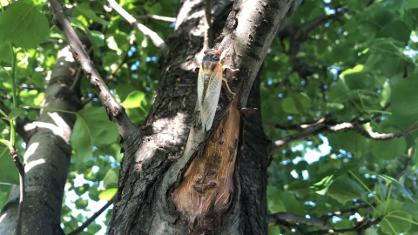
Double Trouble: Cicadas Take to the Skies this Spring
It’s the soundtrack to the summer. Nature’s n
25 Apr 2024 1:25 PM
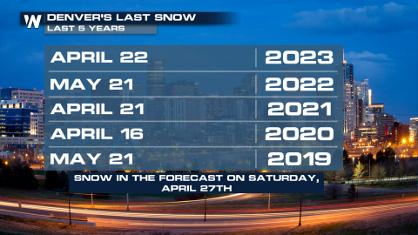
Record Warmth to Weekend Snow in the Four Corners
Snow is in the forecast for Denver, which cou
25 Apr 2024 1:20 AM