A Look at Winter Temperatures and Precipitation for Every El Niño Since 1950
Special Stories
25 Oct 2018 10:19 AM
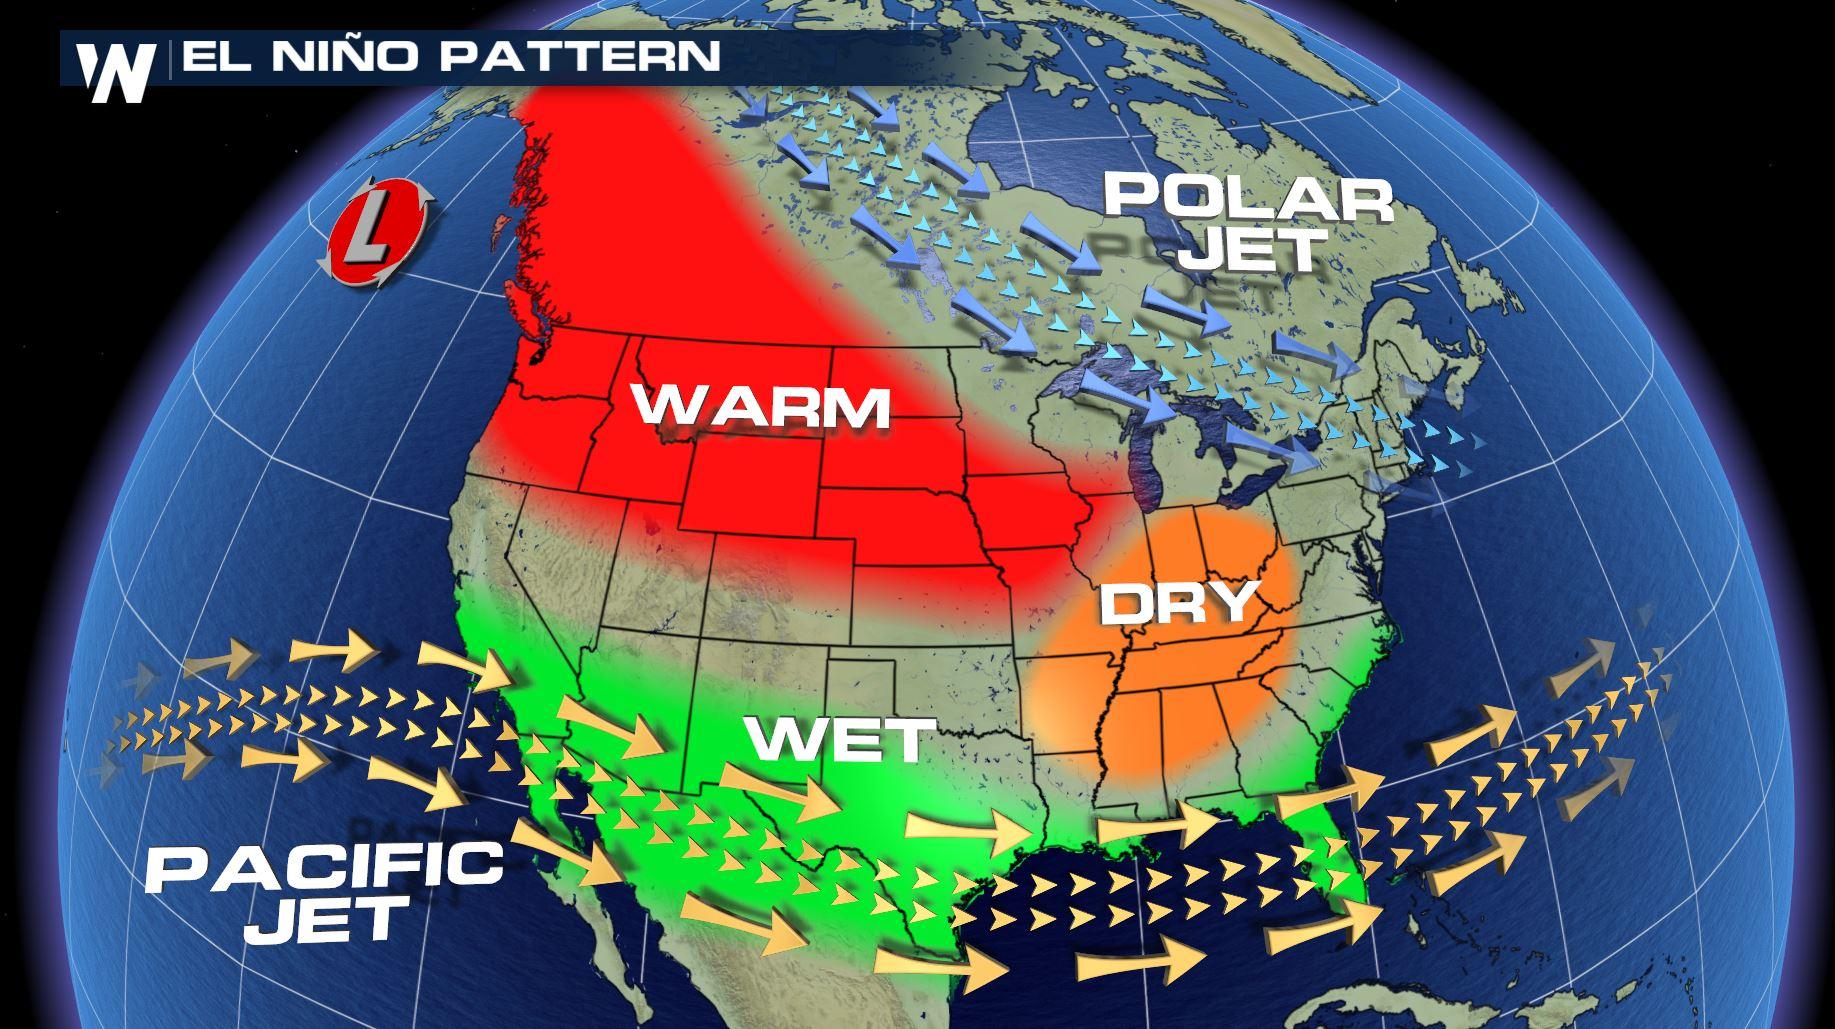
[From NOAA Climate by Rebecca Lindsey] The tropical Pacific climate pattern known as "ENSO," which is short for El Niño-Southern Oscillation, has its strongest influence on the U.S. climate during winter (December-February). El Niño in general acts to tilt the odds toward wetter- and cooler-than-average conditions across much of the South, and toward drier and warmer conditions in many of the northern regions. El Niño's influence on temperature is less reliable than its influence on precipitation.
The collection of maps at below shows winter precipitation (December-February) in each U.S. climate division compared to the 1981-2010 average during all 24 El Niño events since 1950. Years are ranked from strongest El Niño (top left) to weakest (bottom right)‚ based on the Oceanic Niño Index value observed during December–February. There is no universal definition for ranking the strength of ENSO events; for this graphic, events with ONI values greater than 1.5 were ranked as strong, events with ONI values between 1 and 1.5 were ranked as moderate, and events with ONI values less than 1 were ranked as weak.
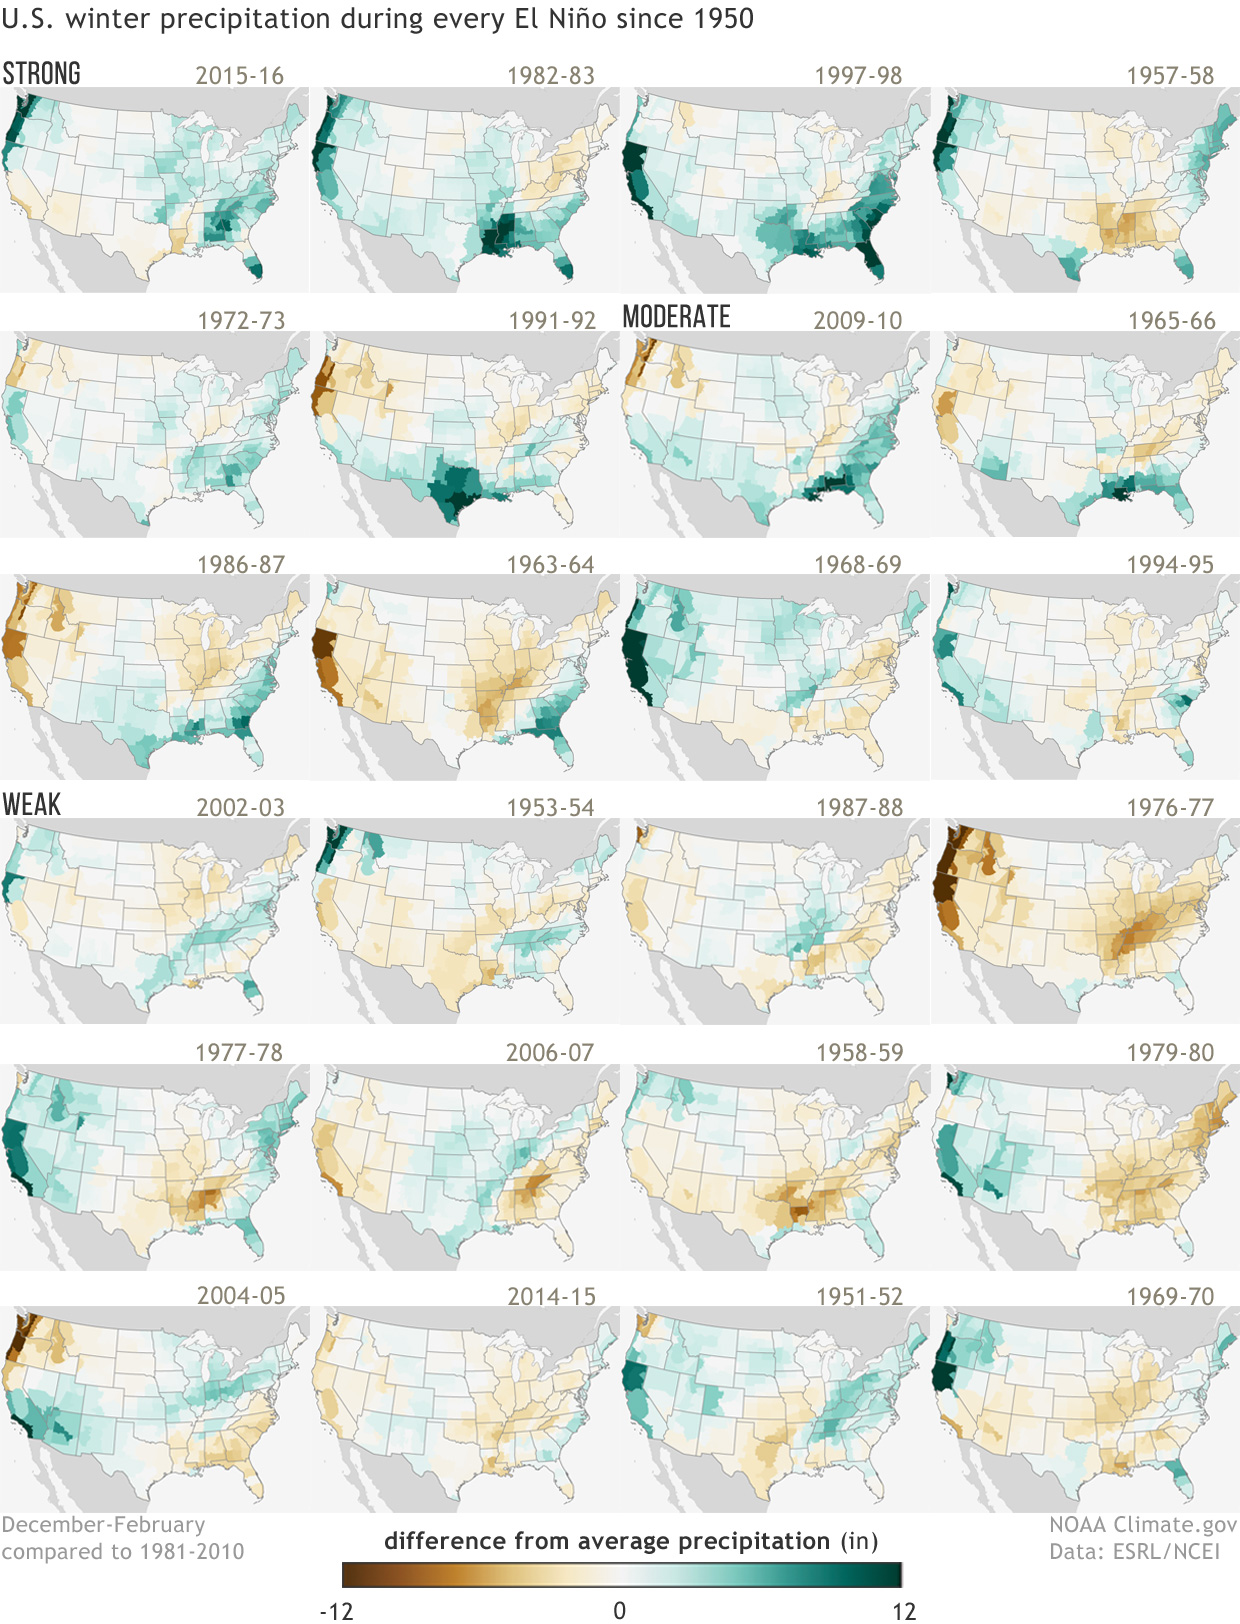 These maps were first published on our ENSO blog as part of the 2015-16 winter outlook post by Mike Halpert, Deputy Director of NOAA's Climate Prediction Center. They were updated for Halpert's post about the 2018-19 winter outlook. In the original post, Halpert wrote, "The most consistent signal is along the Gulf Coast, where almost all of the strong episodes were associated with greater-than-average precipitation. Other fairly reliable signals for the stronger events include a tendency for below-average precipitation in the Ohio and Tennessee Valleys and above-normal precipitation in southern California and the Southwest. Of course, these impacts are not ensured during every El Niño, not even the strongest ones." Halpert also pointed out that compared to precipitation, temperature patterns are much less consistent, even during the strongest events.
The next collection of maps at below show the difference from average (1981-2010) winter temperature (December-February) in each U.S. climate division during all El Niño events since 1950. Years are ranked from strongest El Niño (top left) to weakest (bottom right)‚ based on the December–February Oceanic Niño Index value. There is no universal way to define the strength of El Niño events, but for this graphic, events with ONI values above 1.5 are ranked as strong, events with ONI values between 1 and 1.5 are ranked as moderate, and events with ONI values between 0.5 and 1 are ranked as weak.
These maps were first published on our ENSO blog as part of the 2015-16 winter outlook post by Mike Halpert, Deputy Director of NOAA's Climate Prediction Center. They were updated for Halpert's post about the 2018-19 winter outlook. In the original post, Halpert wrote, "The most consistent signal is along the Gulf Coast, where almost all of the strong episodes were associated with greater-than-average precipitation. Other fairly reliable signals for the stronger events include a tendency for below-average precipitation in the Ohio and Tennessee Valleys and above-normal precipitation in southern California and the Southwest. Of course, these impacts are not ensured during every El Niño, not even the strongest ones." Halpert also pointed out that compared to precipitation, temperature patterns are much less consistent, even during the strongest events.
The next collection of maps at below show the difference from average (1981-2010) winter temperature (December-February) in each U.S. climate division during all El Niño events since 1950. Years are ranked from strongest El Niño (top left) to weakest (bottom right)‚ based on the December–February Oceanic Niño Index value. There is no universal way to define the strength of El Niño events, but for this graphic, events with ONI values above 1.5 are ranked as strong, events with ONI values between 1 and 1.5 are ranked as moderate, and events with ONI values between 0.5 and 1 are ranked as weak.
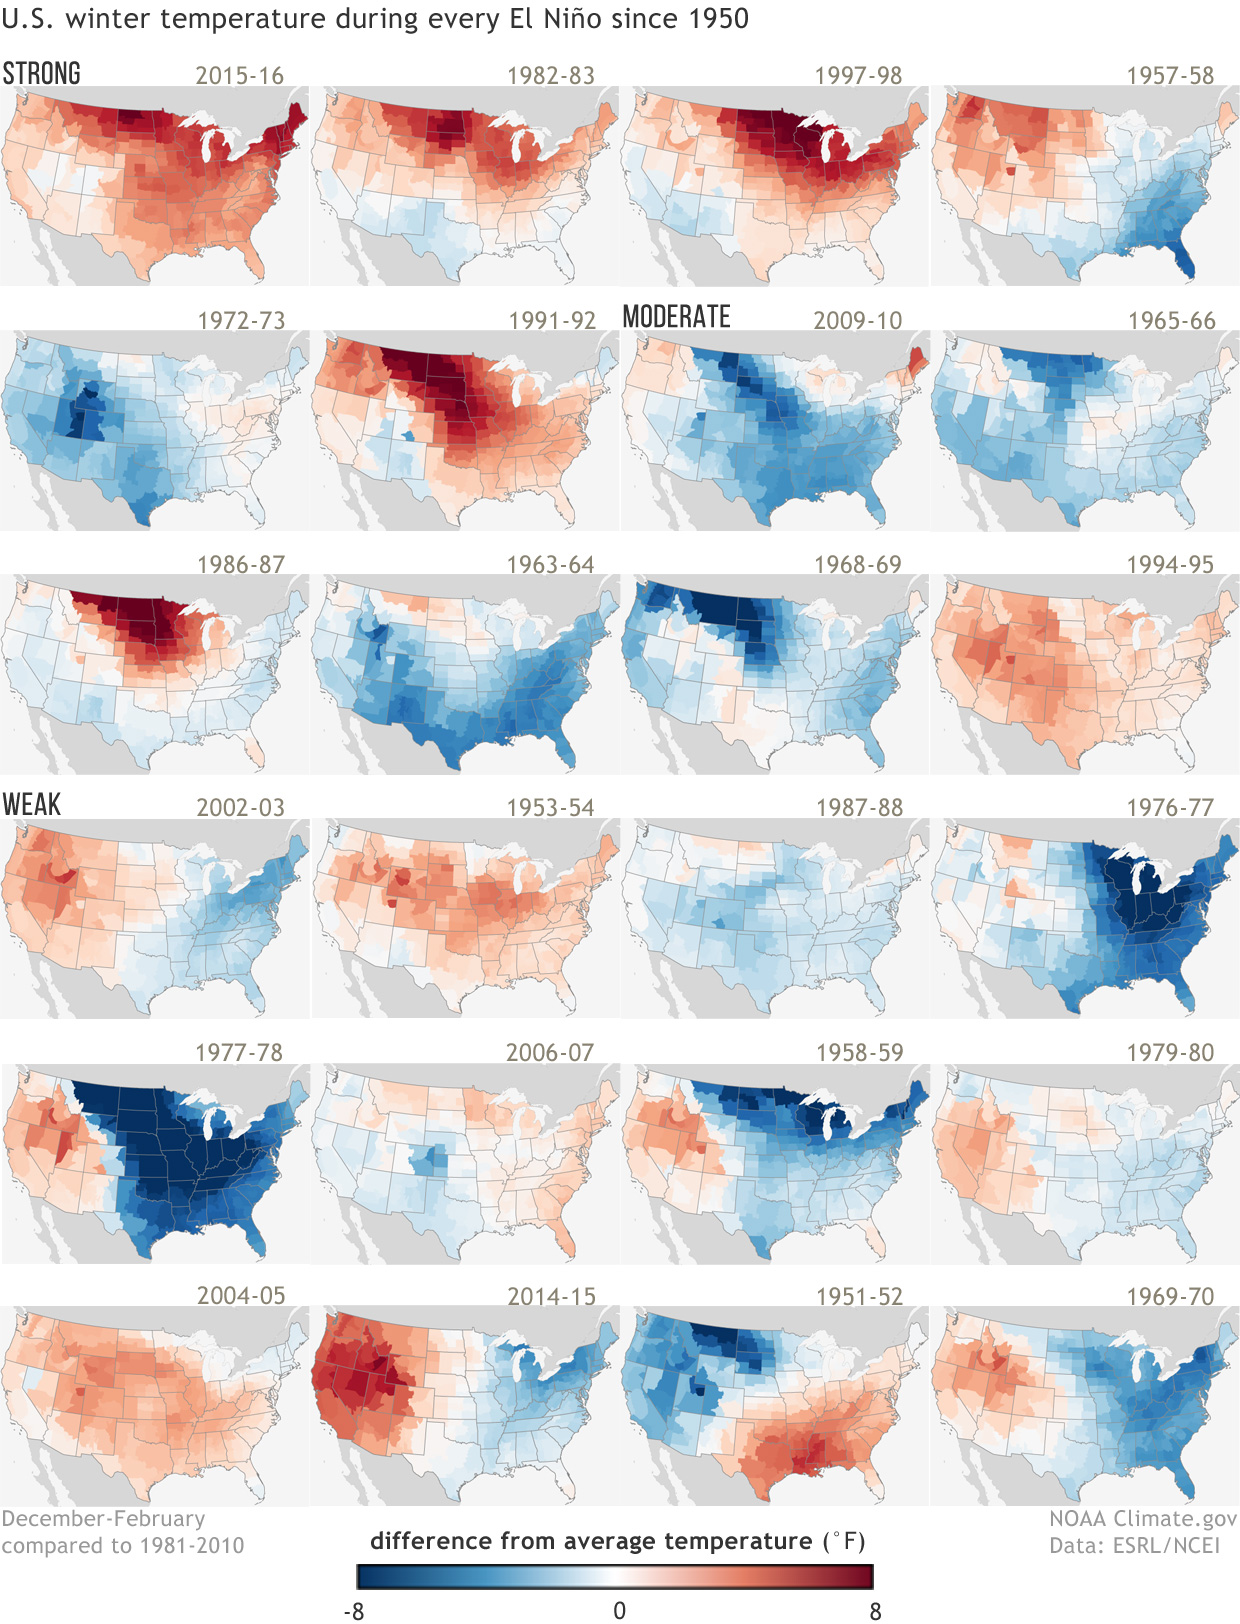 Four of the six strong events have a warm signal that is nearly nationwide, but even among them, the geographic details—the location of the biggest anomalies, where the few cool spots are—vary from one event to another. Looking at both strong and moderate events, the patterns become even less consistent. Eight of the twelve events have a warm signal in the Northern Plains (a much smaller area than is affected in the strong events), but 4 are colder than normal.
This variability from one El Niño to the next is one reason why CPC scientists always talk about seasonal climate outlooks in terms of "odds," "chances," or "probabilities"—not guarantees. For example, the climate division in the southernmost tip of Florida experienced wetter-than-average winters in 5 out of 6 strong El Niño events, and in 10 of 12 strong and moderate events, which is a high percentage, but still not a guarantee. And the magnitude of the anomaly—how much wetter than average—varied from just barely above average to much wetter than average. NOAA released it's winter outlook last week, which favors warmer-than-normal temperatures across much of the country and wetter than average conditions across the South.
Edited for WeatherNation by Meteorologist Mace Michaels
Four of the six strong events have a warm signal that is nearly nationwide, but even among them, the geographic details—the location of the biggest anomalies, where the few cool spots are—vary from one event to another. Looking at both strong and moderate events, the patterns become even less consistent. Eight of the twelve events have a warm signal in the Northern Plains (a much smaller area than is affected in the strong events), but 4 are colder than normal.
This variability from one El Niño to the next is one reason why CPC scientists always talk about seasonal climate outlooks in terms of "odds," "chances," or "probabilities"—not guarantees. For example, the climate division in the southernmost tip of Florida experienced wetter-than-average winters in 5 out of 6 strong El Niño events, and in 10 of 12 strong and moderate events, which is a high percentage, but still not a guarantee. And the magnitude of the anomaly—how much wetter than average—varied from just barely above average to much wetter than average. NOAA released it's winter outlook last week, which favors warmer-than-normal temperatures across much of the country and wetter than average conditions across the South.
Edited for WeatherNation by Meteorologist Mace Michaels
These maps were first published on our ENSO blog as part of the 2015-16 winter outlook post by Mike Halpert, Deputy Director of NOAA's Climate Prediction Center. They were updated for Halpert's post about the 2018-19 winter outlook. In the original post, Halpert wrote, "The most consistent signal is along the Gulf Coast, where almost all of the strong episodes were associated with greater-than-average precipitation. Other fairly reliable signals for the stronger events include a tendency for below-average precipitation in the Ohio and Tennessee Valleys and above-normal precipitation in southern California and the Southwest. Of course, these impacts are not ensured during every El Niño, not even the strongest ones." Halpert also pointed out that compared to precipitation, temperature patterns are much less consistent, even during the strongest events.
The next collection of maps at below show the difference from average (1981-2010) winter temperature (December-February) in each U.S. climate division during all El Niño events since 1950. Years are ranked from strongest El Niño (top left) to weakest (bottom right)‚ based on the December–February Oceanic Niño Index value. There is no universal way to define the strength of El Niño events, but for this graphic, events with ONI values above 1.5 are ranked as strong, events with ONI values between 1 and 1.5 are ranked as moderate, and events with ONI values between 0.5 and 1 are ranked as weak.
Four of the six strong events have a warm signal that is nearly nationwide, but even among them, the geographic details—the location of the biggest anomalies, where the few cool spots are—vary from one event to another. Looking at both strong and moderate events, the patterns become even less consistent. Eight of the twelve events have a warm signal in the Northern Plains (a much smaller area than is affected in the strong events), but 4 are colder than normal.
This variability from one El Niño to the next is one reason why CPC scientists always talk about seasonal climate outlooks in terms of "odds," "chances," or "probabilities"—not guarantees. For example, the climate division in the southernmost tip of Florida experienced wetter-than-average winters in 5 out of 6 strong El Niño events, and in 10 of 12 strong and moderate events, which is a high percentage, but still not a guarantee. And the magnitude of the anomaly—how much wetter than average—varied from just barely above average to much wetter than average. NOAA released it's winter outlook last week, which favors warmer-than-normal temperatures across much of the country and wetter than average conditions across the South.
Edited for WeatherNation by Meteorologist Mace MichaelsAll Weather News
More
Severe Storms Push East through Thursday
As storm energy and moisture from the Gulf pu
7 May 2024 10:45 PM

Catastrophic Tornado Hits Oklahoma Monday Night
The town of Barnsdall, OK took a direct hit f
7 May 2024 10:45 PM

Record Highs in Jeopardy Along the Gulf Coast
It feels like summer with temperatures rising
7 May 2024 10:00 PM

4 Corners: Windy with a Chance of Showers
The Southwest has been dry and windy the last
7 May 2024 9:45 PM
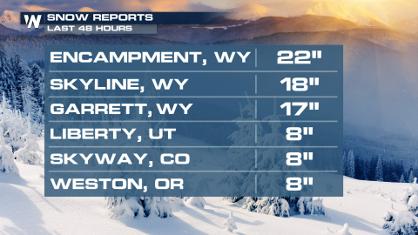
Late Season Snowfall Continues Out West
The snow has been falling in the Northwest wi
7 May 2024 9:35 PM
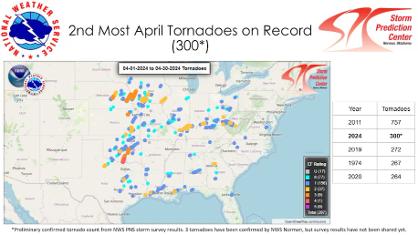
April Brought 300 Tornadoes, Second-Most On Record
Preliminary data from the Storm Prediction Ce
6 May 2024 10:30 PM
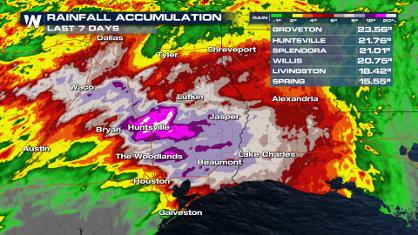
Flood Threat Winding Down for the Lone Star State
After multiple spots in southeast Texas recei
6 May 2024 1:30 AM