Campaign to Map Urban Heat Islands of Baltimore and Washington D.C.
Special Stories
17 Jul 2018 8:31 AM
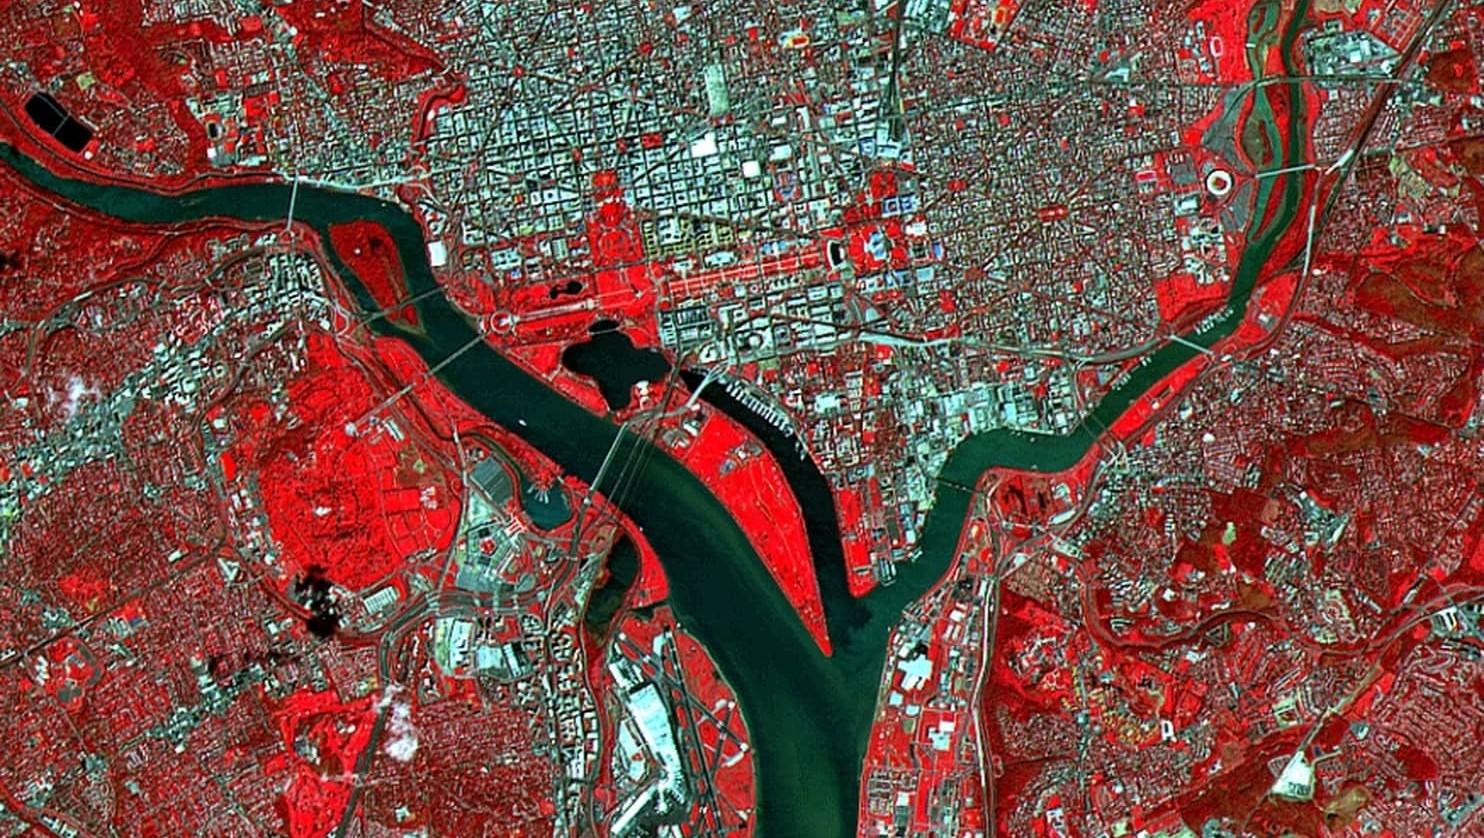
[Washington, D.C. from June 2000 from NASA’s Terra spacecraft. Imagery from NASA using the Advanced Spaceborne Thermal Emission and Reflection Radiometer.]
From today (Tuesday) through Friday, NOAA-sponsored teams of scientists and volunteers will conduct a field campaign to measure and map the urban heat islands of Baltimore, MD, and Washington, D.C. The campaign’s two main purposes are to produce very detailed maps of Baltimore’s and D.C.’s urban heat islands so that residents and city officials can consider whether and how they may want to take actions to protect people and reduce the risks associated with exposure to extreme heat.
Background
The term “urban heat island” refers to the fact that cities’ unshaded roads and buildings gain heat during the day and radiate that heat into the surrounding air, increasing the local air temperature. As a result, highly developed urban areas can experience much warmer temperatures during the summer than surrounding, vegetated areas.
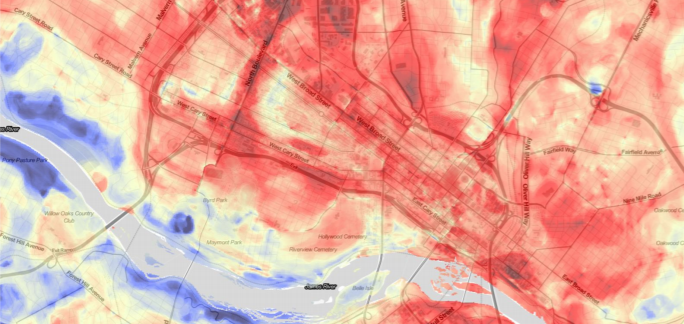 [Map from Richmond, VA, urban heat island study. Red shows hotter areas and blue shows cooler areas. From NOAA]
On one of the hottest days of summer in 2017, some built-up parts of Richmond, VA, were 16° hotter than its vegetated areas on the same day. A team of scientists—led by Drs. Jeremy Hoffman, Science Museum of Virginia, and Vivek Shandas, Portland State University—found that parts of Richmond experienced temperatures as hot as 103°F on days when the city’s vegetated areas were 87°. The team published very similar findings in Portland, OR, from a previous campaign. You can read more about the Richmond campaign at this link.
Now, with funding from NOAA’s Climate Program Office, the team is focusing on Baltimore and
Washington, D.C. In late July, teams of local volunteers will fan out across those cities in cars equipped with special thermometers designed to measure air temperature once per second as well as record the time and precise location of each measurement. Thus, the data collected by the teams of volunteer drivers will enable the scientists to generate very detailed maps of temperatures across both cities at three different times of day: 6:00 am, 3:00 pm, and 7:00 pm. When ready, the findings from the UHI campaigns in Baltimore and D.C. will be published in a peer-reviewed science journal, and the data will be shared freely with officials and interested members of the public.
[Map from Richmond, VA, urban heat island study. Red shows hotter areas and blue shows cooler areas. From NOAA]
On one of the hottest days of summer in 2017, some built-up parts of Richmond, VA, were 16° hotter than its vegetated areas on the same day. A team of scientists—led by Drs. Jeremy Hoffman, Science Museum of Virginia, and Vivek Shandas, Portland State University—found that parts of Richmond experienced temperatures as hot as 103°F on days when the city’s vegetated areas were 87°. The team published very similar findings in Portland, OR, from a previous campaign. You can read more about the Richmond campaign at this link.
Now, with funding from NOAA’s Climate Program Office, the team is focusing on Baltimore and
Washington, D.C. In late July, teams of local volunteers will fan out across those cities in cars equipped with special thermometers designed to measure air temperature once per second as well as record the time and precise location of each measurement. Thus, the data collected by the teams of volunteer drivers will enable the scientists to generate very detailed maps of temperatures across both cities at three different times of day: 6:00 am, 3:00 pm, and 7:00 pm. When ready, the findings from the UHI campaigns in Baltimore and D.C. will be published in a peer-reviewed science journal, and the data will be shared freely with officials and interested members of the public.
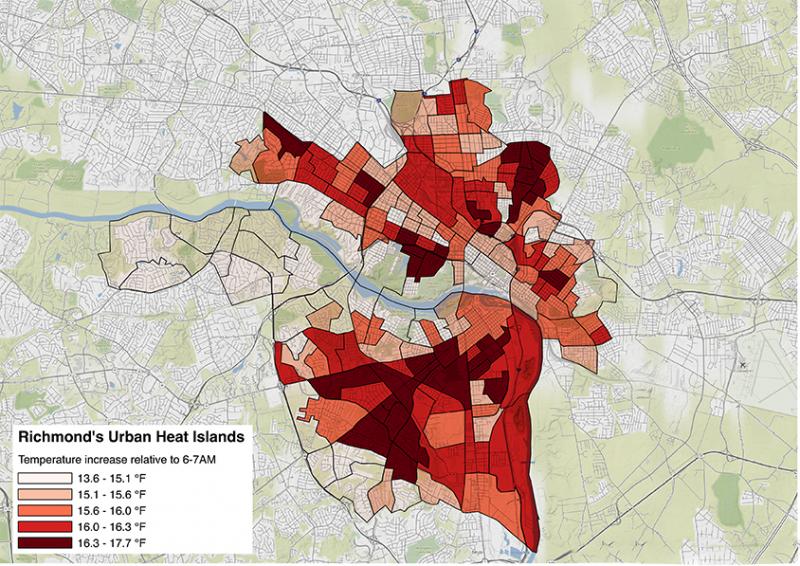 [The map displays the urban heat vulnerability by census block group in Richmond, VA. Image credit: Jeremy Hoffman, Science Museum of Virginia.]
NOAA is looking for your help!
Are you interested in helping your neighbors beat the heat? Sign up now to help collect the data that officials can use to understand heat exposure where you live and/or work. To sign up, you can go to this link. Volunteers must have their own car, a valid driver’s license, and the ability to drive during three 1-hour periods in the morning, afternoon, and evening on a specific (hot!) day in late July.
[The map displays the urban heat vulnerability by census block group in Richmond, VA. Image credit: Jeremy Hoffman, Science Museum of Virginia.]
NOAA is looking for your help!
Are you interested in helping your neighbors beat the heat? Sign up now to help collect the data that officials can use to understand heat exposure where you live and/or work. To sign up, you can go to this link. Volunteers must have their own car, a valid driver’s license, and the ability to drive during three 1-hour periods in the morning, afternoon, and evening on a specific (hot!) day in late July.
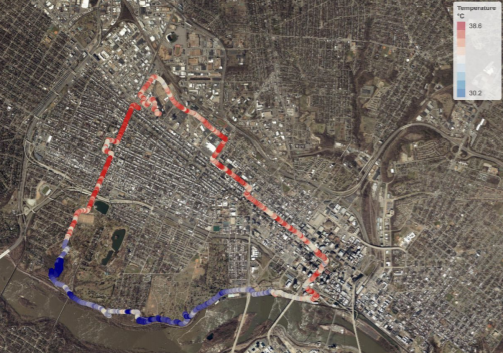 [Volunteers will drive designated transects in Baltimore and Washington, D.C., making temperature measurements once per second all along the way. Routes will be carefully planned to include the diversity of land cover types in both cities.]
Edited for WeatherNation by Meteorologist Mace Michaels
[Volunteers will drive designated transects in Baltimore and Washington, D.C., making temperature measurements once per second all along the way. Routes will be carefully planned to include the diversity of land cover types in both cities.]
Edited for WeatherNation by Meteorologist Mace Michaels
[Map from Richmond, VA, urban heat island study. Red shows hotter areas and blue shows cooler areas. From NOAA]
On one of the hottest days of summer in 2017, some built-up parts of Richmond, VA, were 16° hotter than its vegetated areas on the same day. A team of scientists—led by Drs. Jeremy Hoffman, Science Museum of Virginia, and Vivek Shandas, Portland State University—found that parts of Richmond experienced temperatures as hot as 103°F on days when the city’s vegetated areas were 87°. The team published very similar findings in Portland, OR, from a previous campaign. You can read more about the Richmond campaign at this link.
Now, with funding from NOAA’s Climate Program Office, the team is focusing on Baltimore and
Washington, D.C. In late July, teams of local volunteers will fan out across those cities in cars equipped with special thermometers designed to measure air temperature once per second as well as record the time and precise location of each measurement. Thus, the data collected by the teams of volunteer drivers will enable the scientists to generate very detailed maps of temperatures across both cities at three different times of day: 6:00 am, 3:00 pm, and 7:00 pm. When ready, the findings from the UHI campaigns in Baltimore and D.C. will be published in a peer-reviewed science journal, and the data will be shared freely with officials and interested members of the public.
[The map displays the urban heat vulnerability by census block group in Richmond, VA. Image credit: Jeremy Hoffman, Science Museum of Virginia.]
NOAA is looking for your help!
Are you interested in helping your neighbors beat the heat? Sign up now to help collect the data that officials can use to understand heat exposure where you live and/or work. To sign up, you can go to this link. Volunteers must have their own car, a valid driver’s license, and the ability to drive during three 1-hour periods in the morning, afternoon, and evening on a specific (hot!) day in late July.
[Volunteers will drive designated transects in Baltimore and Washington, D.C., making temperature measurements once per second all along the way. Routes will be carefully planned to include the diversity of land cover types in both cities.]
Edited for WeatherNation by Meteorologist Mace MichaelsAll Weather News
More

Flooding, Severe Storms Target the Midwest Again
After an active week of storms across the nor
1 Aug 2026 1:40 AM


After Reaching Category 5, Genevieve Weakens in the Pacific
PacificFausto is now a post-tropical cyclone.
31 Jul 2026 1:30 AM

Flooding Risk Increases as Heavy Rain Targets the Tri-State Area
Tuesday, heavy rainfall moved across the Nort
30 Jul 2026 12:25 AM

Severe Weather: Energy From the Midwest Now in the Southeast
UPPER MIDWEST - Through Monday, dangerous tor
29 Jul 2026 10:30 PM