Mapping Our Planet, One Ocean at a Time
Special Stories
2 Apr 2018 8:34 AM
From NOAA
It could be said that Earth’s oceans are the final frontier in exploration. More than 80 percent of the world's oceans remain unexplored and unmapped. Compare that to the moon and Mars, which have both been mapped completely, and we are woefully behind in discovering what lies beneath.
Human activities in our oceans continue to increase, and scientists from around the globe have come together to make mapping the entire ocean a reality by 2030. To aid in this endeavor, scientists from NCEI and other institutions have developed an algorithm that will play a significant role in cultivating a seabed mapping strategy for the North Atlantic Ocean and beyond.
 Knowledge of the seafloor’s shape is crucial for understanding ocean circulation patterns that influence ocean atmosphere processes, which distribute heat between the tropics and the poles —a key component of Earth’s climate system.
High-quality bathymetric maps are necessary for the designation of marine protected areas to conserve threatened ecosystems or habitats. And, detailed measurements of ocean depth are critical for predicting tsunami inundation.
In addition, ocean bathymetry is important for the study of tides, wave action, sediment transport, underwater geo-hazards, cable routing, fisheries management, resource exploration, and military and defense applications.
Knowledge of the seafloor’s shape is crucial for understanding ocean circulation patterns that influence ocean atmosphere processes, which distribute heat between the tropics and the poles —a key component of Earth’s climate system.
High-quality bathymetric maps are necessary for the designation of marine protected areas to conserve threatened ecosystems or habitats. And, detailed measurements of ocean depth are critical for predicting tsunami inundation.
In addition, ocean bathymetry is important for the study of tides, wave action, sediment transport, underwater geo-hazards, cable routing, fisheries management, resource exploration, and military and defense applications.
 To address this, the Nippon Foundation has partnered with the General Bathymetric Chart of Oceans (GEBCO) to launch the Seabed 2030 Project in 2017, and it is the only long-term international project with a mandate to map the entire ocean floor. Operating under the joint sponsorship of the International Hydrographic Organization (IHO) and the Intergovernmental Oceanographic Commission (IOC), Seabed 2030 takes responsibility for bringing collected depth data together, finding and highlighting the unmapped gaps, and coordinating efforts by working with the established ocean mapping community.
 [This digital elevation model image for Barkley Sound on the west coast of Canada’s Vancouver Island shows the entrance to the Port Alberni Inlet.]
A handful of publicly available parameters of the marine environment were chosen based on discussions with the working group. In addition to bathymetric data coverage, the parameters listed below reflect the attributes a potential target area could possess to increase its suitability for future planned bathymetric surveys. Three categories of input parameters were identified:
[This digital elevation model image for Barkley Sound on the west coast of Canada’s Vancouver Island shows the entrance to the Port Alberni Inlet.]
A handful of publicly available parameters of the marine environment were chosen based on discussions with the working group. In addition to bathymetric data coverage, the parameters listed below reflect the attributes a potential target area could possess to increase its suitability for future planned bathymetric surveys. Three categories of input parameters were identified:
 [This map represents the three areas identified for high priority mapping in the North Atlantic Ocean. Courtesy of The Journal of Ocean Technology.]
The next step was to create a map that showed the suitability of every 400 x 400 km cell as a potential target site within the North Atlantic study area. The methodology involved a GIS-based overlay technique that included the parameters of the marine environment as individual layers and combined them to rank the suitability of a location as a target area for mapping. The results revealed the suitability of every area throughout the North Atlantic and highlighted three suggested pilot mapping sites. NOAA’s Office of Ocean Exploration and Research is now looking at these suggested areas as potential mapping sites for the 2018 and 2019 Okeanos Explorer field seasons.
[This map represents the three areas identified for high priority mapping in the North Atlantic Ocean. Courtesy of The Journal of Ocean Technology.]
The next step was to create a map that showed the suitability of every 400 x 400 km cell as a potential target site within the North Atlantic study area. The methodology involved a GIS-based overlay technique that included the parameters of the marine environment as individual layers and combined them to rank the suitability of a location as a target area for mapping. The results revealed the suitability of every area throughout the North Atlantic and highlighted three suggested pilot mapping sites. NOAA’s Office of Ocean Exploration and Research is now looking at these suggested areas as potential mapping sites for the 2018 and 2019 Okeanos Explorer field seasons.
Why Map the Ocean Floor?
The ocean floor has the same general characteristics as the above-water areas of the world, including mountains, plains, channels, canyons, hills, volcanoes, and more. These characteristics and the shape of the seafloor have immense influence on both ocean circulation and seafloor habitat.Scientists create bathymetric maps and products to illustrate the depth and shapes of underwater terrain, just as topographical maps represent three-dimensional features of above-sea terrain.
Knowledge of the seafloor’s shape is crucial for understanding ocean circulation patterns that influence ocean atmosphere processes, which distribute heat between the tropics and the poles —a key component of Earth’s climate system.
High-quality bathymetric maps are necessary for the designation of marine protected areas to conserve threatened ecosystems or habitats. And, detailed measurements of ocean depth are critical for predicting tsunami inundation.
In addition, ocean bathymetry is important for the study of tides, wave action, sediment transport, underwater geo-hazards, cable routing, fisheries management, resource exploration, and military and defense applications.
Seabed 2030
Despite decades of ocean mapping, there is still a gap in detailed bathymetric maps and products over large parts of the oceans.
To address this, the Nippon Foundation has partnered with the General Bathymetric Chart of Oceans (GEBCO) to launch the Seabed 2030 Project in 2017, and it is the only long-term international project with a mandate to map the entire ocean floor. Operating under the joint sponsorship of the International Hydrographic Organization (IHO) and the Intergovernmental Oceanographic Commission (IOC), Seabed 2030 takes responsibility for bringing collected depth data together, finding and highlighting the unmapped gaps, and coordinating efforts by working with the established ocean mapping community.
Narrowing the Task
But with oceans covering over 141 million square miles of Earth, where do you begin to map the gaps? In 2014, before the rollout of Seabed 2030, the U.S., Canadian, and European Union governments came together in an effort to foster cooperation and increase knowledge of the Atlantic Ocean through improved coordination and collaboration in ocean observation efforts. Thanks to the “Galway Statement on Atlantic Ocean Cooperation,” the Atlantic Seabed International Working Group was established and tasked, in part, to develop plans to map the Atlantic Ocean. Members of the working group, which include Jennifer Jencks of NCEI and scientists from Germany and the United Kingdom, along with Jesse Varner of the Cooperative Institute for Research in Environmental Sciences (CIRES) and NCEI, collaborated to develop an algorithm to identify potential target areas within the North Atlantic that might be suitable for future bathymetric mapping. As a starting point, the working group made two decisions:- That potential target areas for a pilot mapping project would be 400 x 400 km (249 x 249 mi). The choice of polygon size was based on the calculation that, with an appropriately equipped vessel, one polygon could be surveyed within approximately 100 days.
- And to exclude each coastal country’s 200 nautical mile Exclusive Economic Zone (EEZ) and potential continental shelf claims.
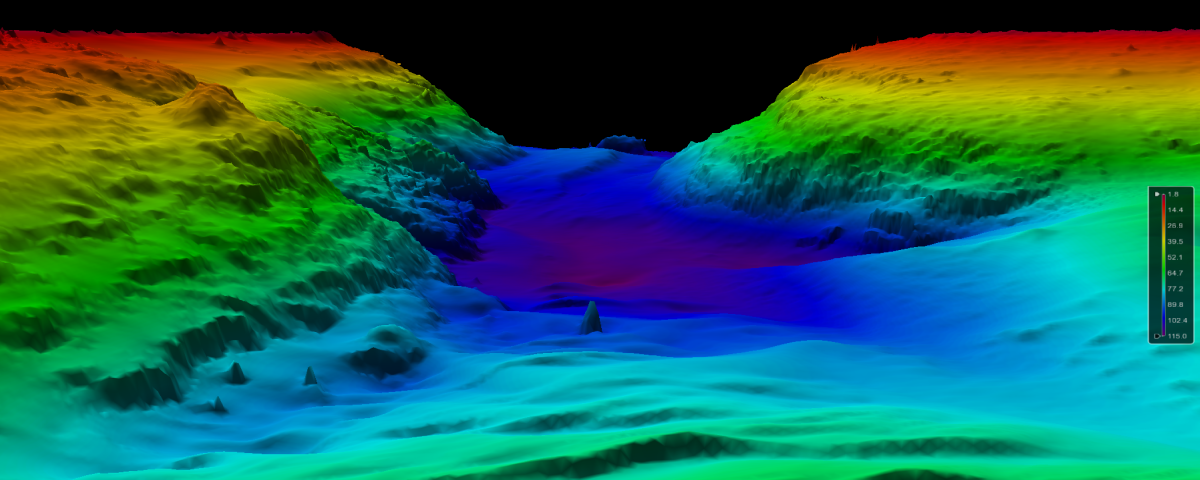
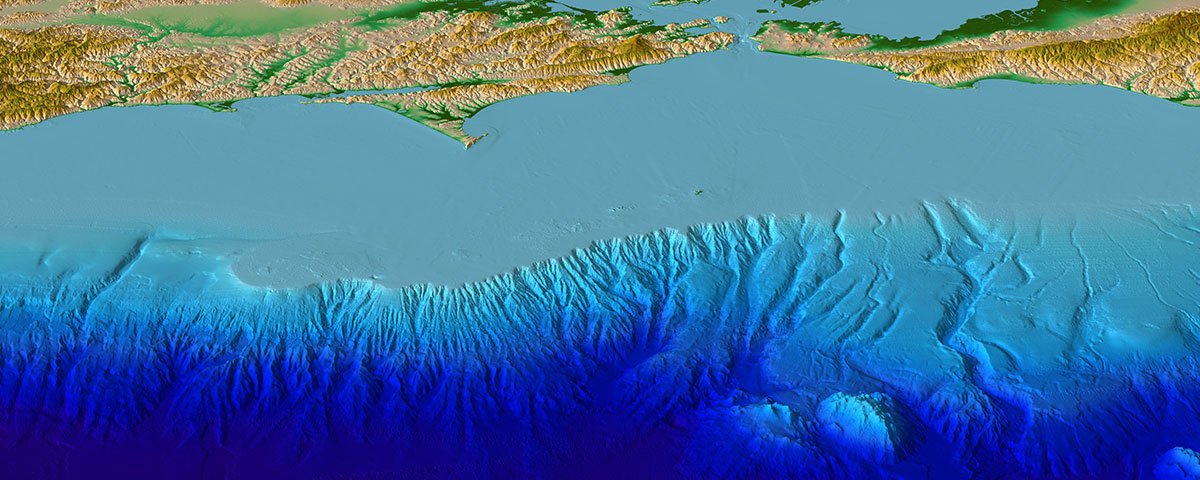
[This digital elevation model image for Barkley Sound on the west coast of Canada’s Vancouver Island shows the entrance to the Port Alberni Inlet.]
A handful of publicly available parameters of the marine environment were chosen based on discussions with the working group. In addition to bathymetric data coverage, the parameters listed below reflect the attributes a potential target area could possess to increase its suitability for future planned bathymetric surveys. Three categories of input parameters were identified:
- Environmentally Sensitive Areas: ecologically or biologically significant marine areas, marine protected areas, vulnerable marine ecosystems
- Areas of Public Interest: flight lines and shipping lanes
- Areas with Marine Resource Potential: important areas for cobalt-rich ferromanganese crust, manganese nodule formation, massive sulfide formation
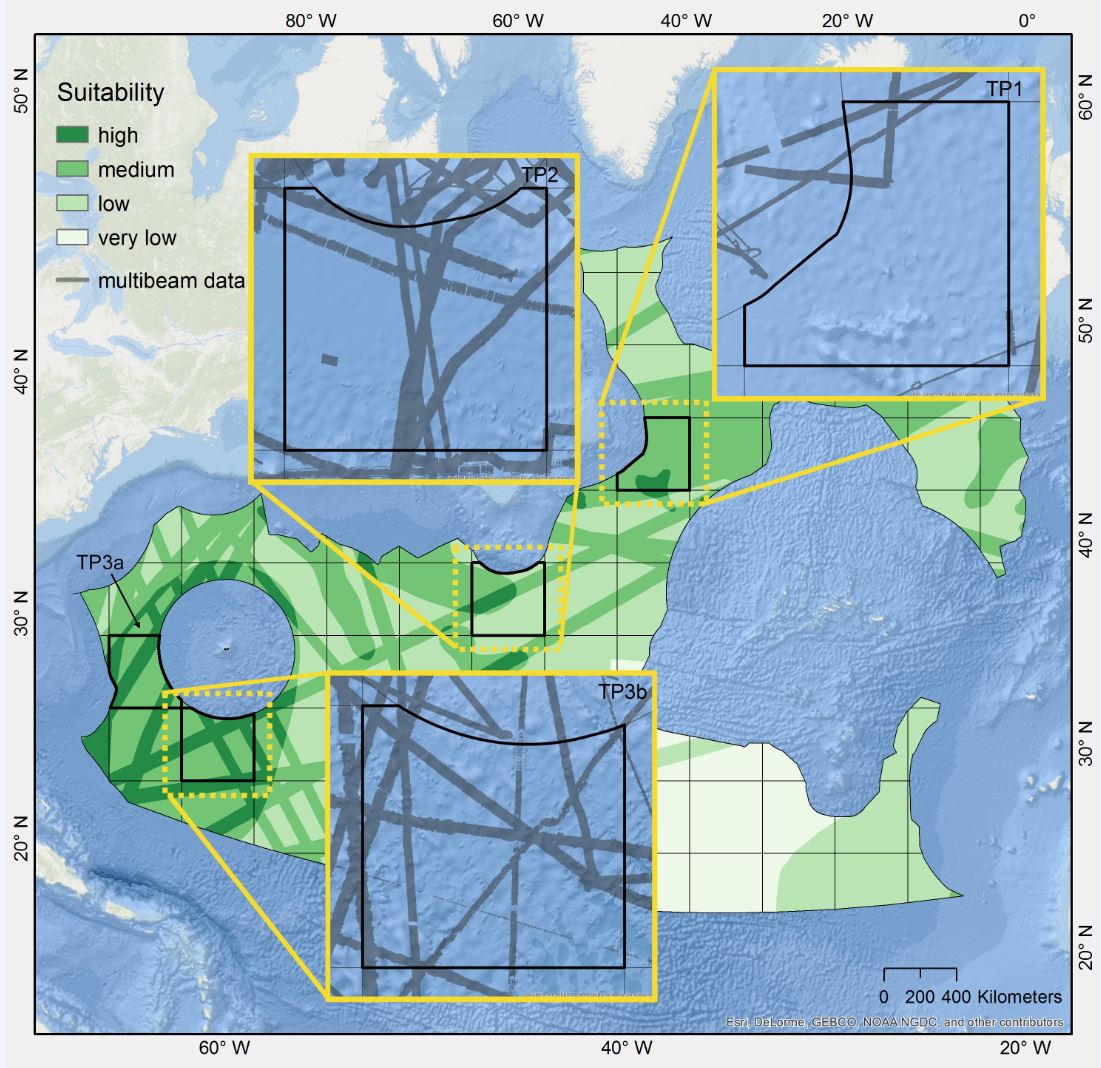
[This map represents the three areas identified for high priority mapping in the North Atlantic Ocean. Courtesy of The Journal of Ocean Technology.]
The next step was to create a map that showed the suitability of every 400 x 400 km cell as a potential target site within the North Atlantic study area. The methodology involved a GIS-based overlay technique that included the parameters of the marine environment as individual layers and combined them to rank the suitability of a location as a target area for mapping. The results revealed the suitability of every area throughout the North Atlantic and highlighted three suggested pilot mapping sites. NOAA’s Office of Ocean Exploration and Research is now looking at these suggested areas as potential mapping sites for the 2018 and 2019 Okeanos Explorer field seasons.
Impressively, this algorithm can easily be adjusted to include new criteria and new data as they become available, providing an objective way to prioritize mapping areas, which can be adapted to other regions.
This new approach has the potential to take the mapping and ocean science community a step closer to filling the large mapping gaps in the North Atlantic and across the globe. Edited for WeatherNation by Meteorologist Mace MichaelsAll Weather News
More

Severe Storms Target the Midwest to the Northeast This Week
Extreme heat will be a big story this week ac
27 Jul 2026 1:50 AM


Tropics: Fausto Heads to Hawaii; Genevieve Rapidly Intensifying
Atlantic BasinBertha has dissipated after mov
27 Jul 2026 1:40 AM

Southeast Flood Risk Lingers Near Stalled Front
A stalled boundary over the Southeast will ke
25 Jul 2026 10:55 AM

Another Round of Storms Targets the Northeast
Tuesday brought severe weather again across p
23 Jul 2026 1:15 AM

Another Round of Severe Weather for the Upper Midwest and Great Lakes
The upper-level low train continues to keep t
21 Jul 2026 1:45 AM