A New View of the Sun from NOAA's Solar Telescope
Imaging the Sun’s Atmosphere
Launched November 19, 2016, on the GOES-16 satellite, SUVI(link is external) is the first in a line of four identical instruments that will image the sun’s atmosphere in the extreme ultraviolet for the next 20 years. The second SUVI instrument is on the GOES-S satellite, which launched on March 1, 2018. SUVI’s primary mission is to support space weather forecasting operations at NOAA’s Space Weather Prediction Center in Boulder, but its unique properties offer several opportunities for new research.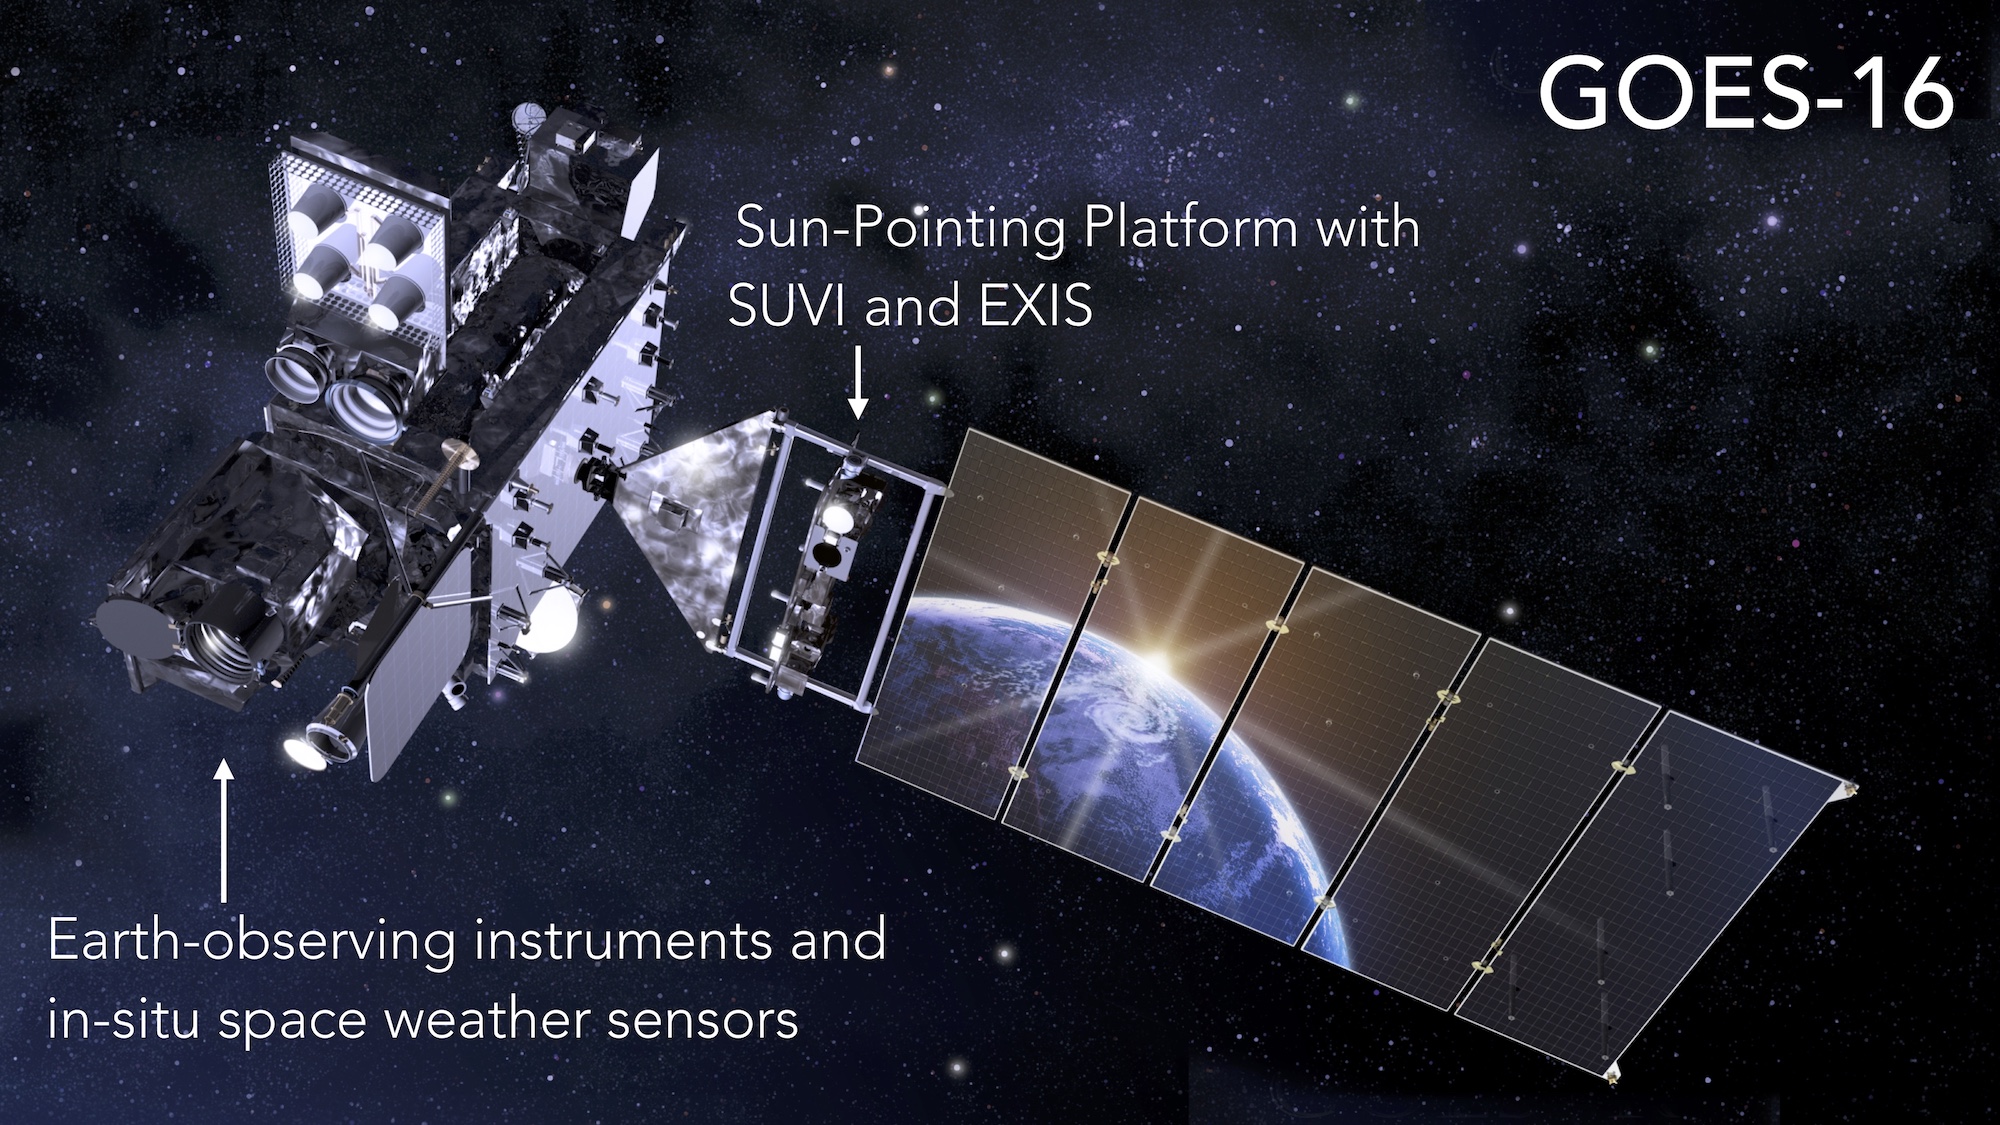 [The Solar Ultraviolet Imager (SUVI) is located on the solar-pointing platform of the GOES-16 satellite. The solar-pointing platform provides a stable foundation and will track the daily and seasonal movement of the sun. Courtesy of Lockheed Martin.]
SUVI has a larger field of view than existing solar imagers, so it can image solar phenomena at greater heights above the surface of the sun. SUVI also has six wavelength channels, or passbands, that capture simultaneous images of the solar chromosphere and corona—the sun’s outer atmosphere—at different temperature ranges.
[The Solar Ultraviolet Imager (SUVI) is located on the solar-pointing platform of the GOES-16 satellite. The solar-pointing platform provides a stable foundation and will track the daily and seasonal movement of the sun. Courtesy of Lockheed Martin.]
SUVI has a larger field of view than existing solar imagers, so it can image solar phenomena at greater heights above the surface of the sun. SUVI also has six wavelength channels, or passbands, that capture simultaneous images of the solar chromosphere and corona—the sun’s outer atmosphere—at different temperature ranges.
New Views of Strong Solar Eruptions
Last September, while it was still undergoing calibration and testing, SUVI observed two of the largest events in the current solar cycle—an 11-year cycle that began in December 2008, reached its maximum in 2014, and is now declining. Both the September 6 and the September 10 events produced large solar flares that triggered radio blackouts on Earth. The September 6 eventalso produced a strong geomagnetic storm on Earth, while the September 10 event produced a strong solar radiation event—and was where SUVI really showed its stuff. “SUVI observations of this event are really novel,” Seaton says. “The earlier event happened in a place on the sun that other imagers can capture, so SUVI adds some value, but nothing like the September 10 event.”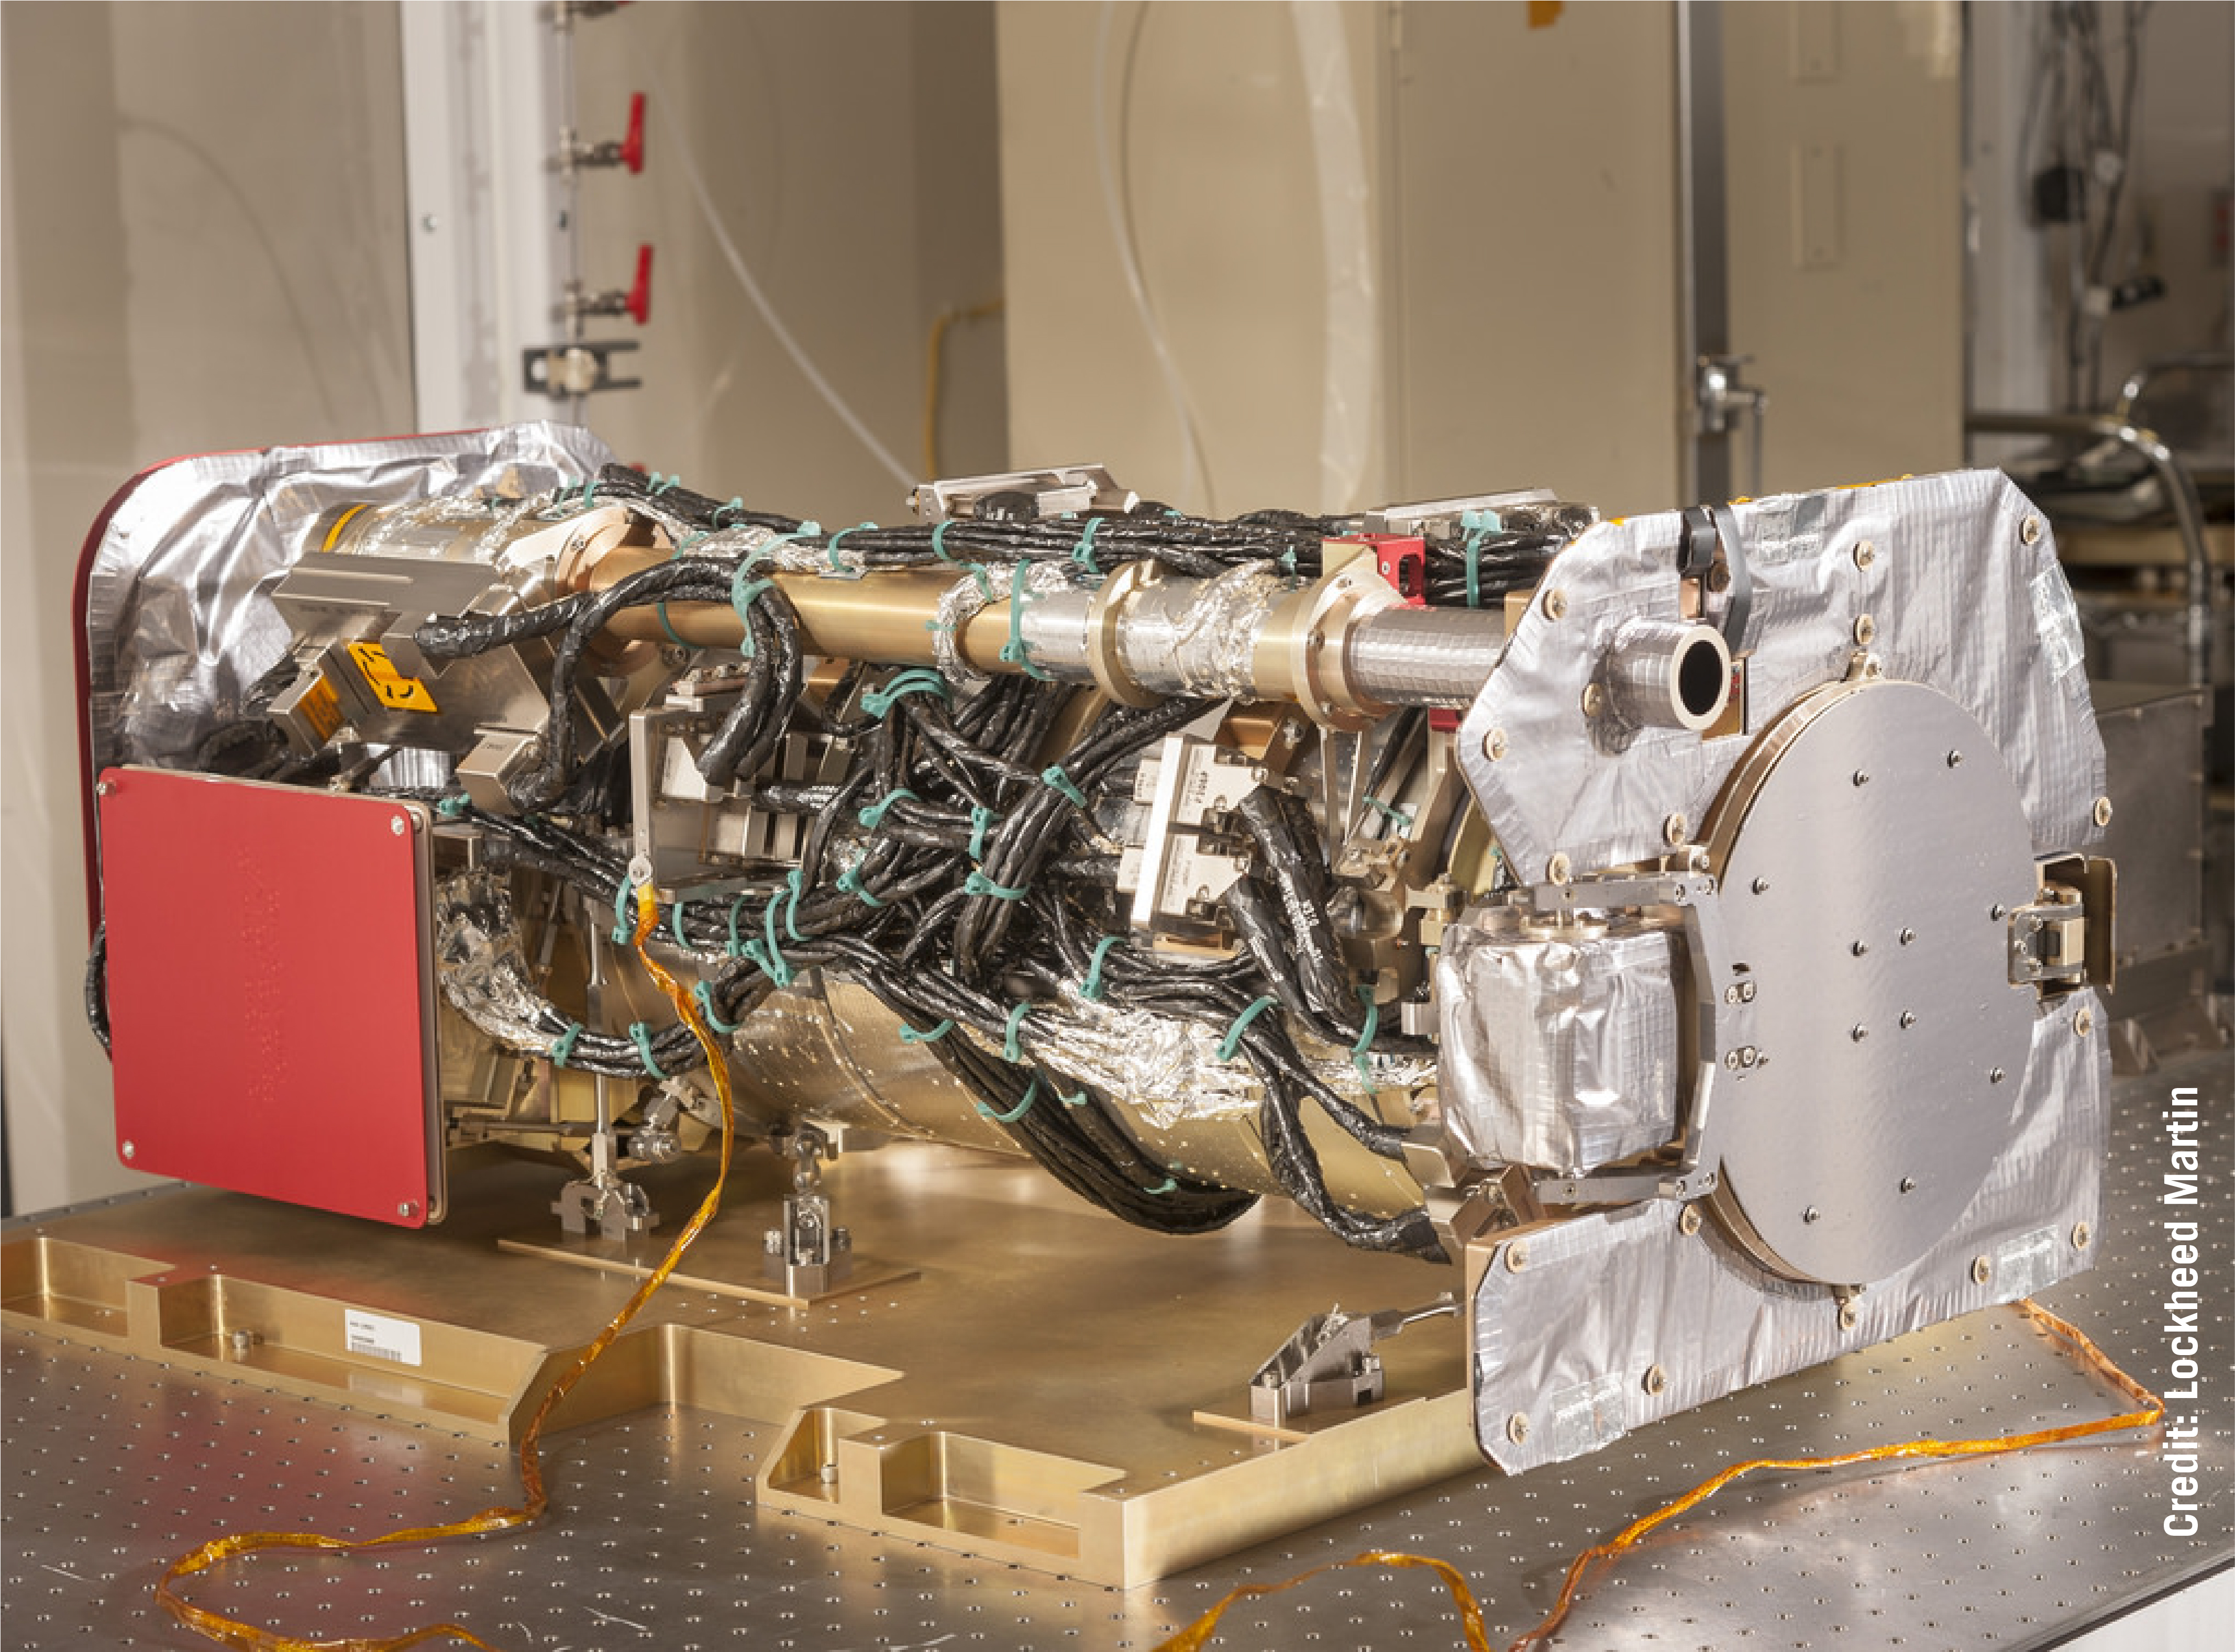 [The Solar Ultraviolet Imager (SUVI) Flight Model 1 is flying on the GOES-16 satellite. Courtesy of Lockheed Martin.]
That day, the solar flare released as much energy in a few minutes as all of humanity has ever produced, typical of the largest flares in any given solar cycle, according to Seaton. SUVI’s observations of that event revealed a number of unique features: The telescope captured the onset of the solar eruption, followed by a powerful extreme-ultraviolet (EUV) wave that disrupted much of the corona and was visible to heights approaching twice the sun’s radius. “This is one of the first clear detections of an EUV wave at large heights,” Seaton says.
[The Solar Ultraviolet Imager (SUVI) Flight Model 1 is flying on the GOES-16 satellite. Courtesy of Lockheed Martin.]
That day, the solar flare released as much energy in a few minutes as all of humanity has ever produced, typical of the largest flares in any given solar cycle, according to Seaton. SUVI’s observations of that event revealed a number of unique features: The telescope captured the onset of the solar eruption, followed by a powerful extreme-ultraviolet (EUV) wave that disrupted much of the corona and was visible to heights approaching twice the sun’s radius. “This is one of the first clear detections of an EUV wave at large heights,” Seaton says.
Understanding Solar Activity at Different Temperatures
SUVI also captured images of the September 10 solar flare at different temperatures. Scientists need to see what’s happening at a range of temperatures to really understand solar activity. “The process by which we see light from the corona is determined by temperature—for example, plasma in the sun’s corona emits light at specific ultraviolet wavelengths,” Seaton says.
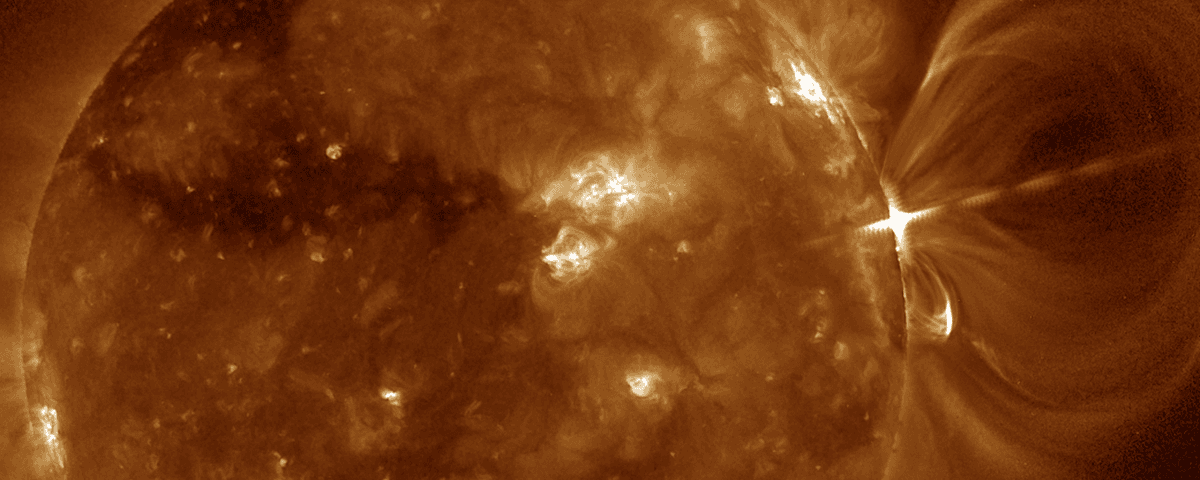
So the telescope is equipped with six filters that view the sun’s corona at various temperature bands, from 50,000 to 20 million kelvins. “By looking at a bunch of different wavelengths and putting them together, we can get a picture of the entire corona and see phenomena at different temperatures,” he says.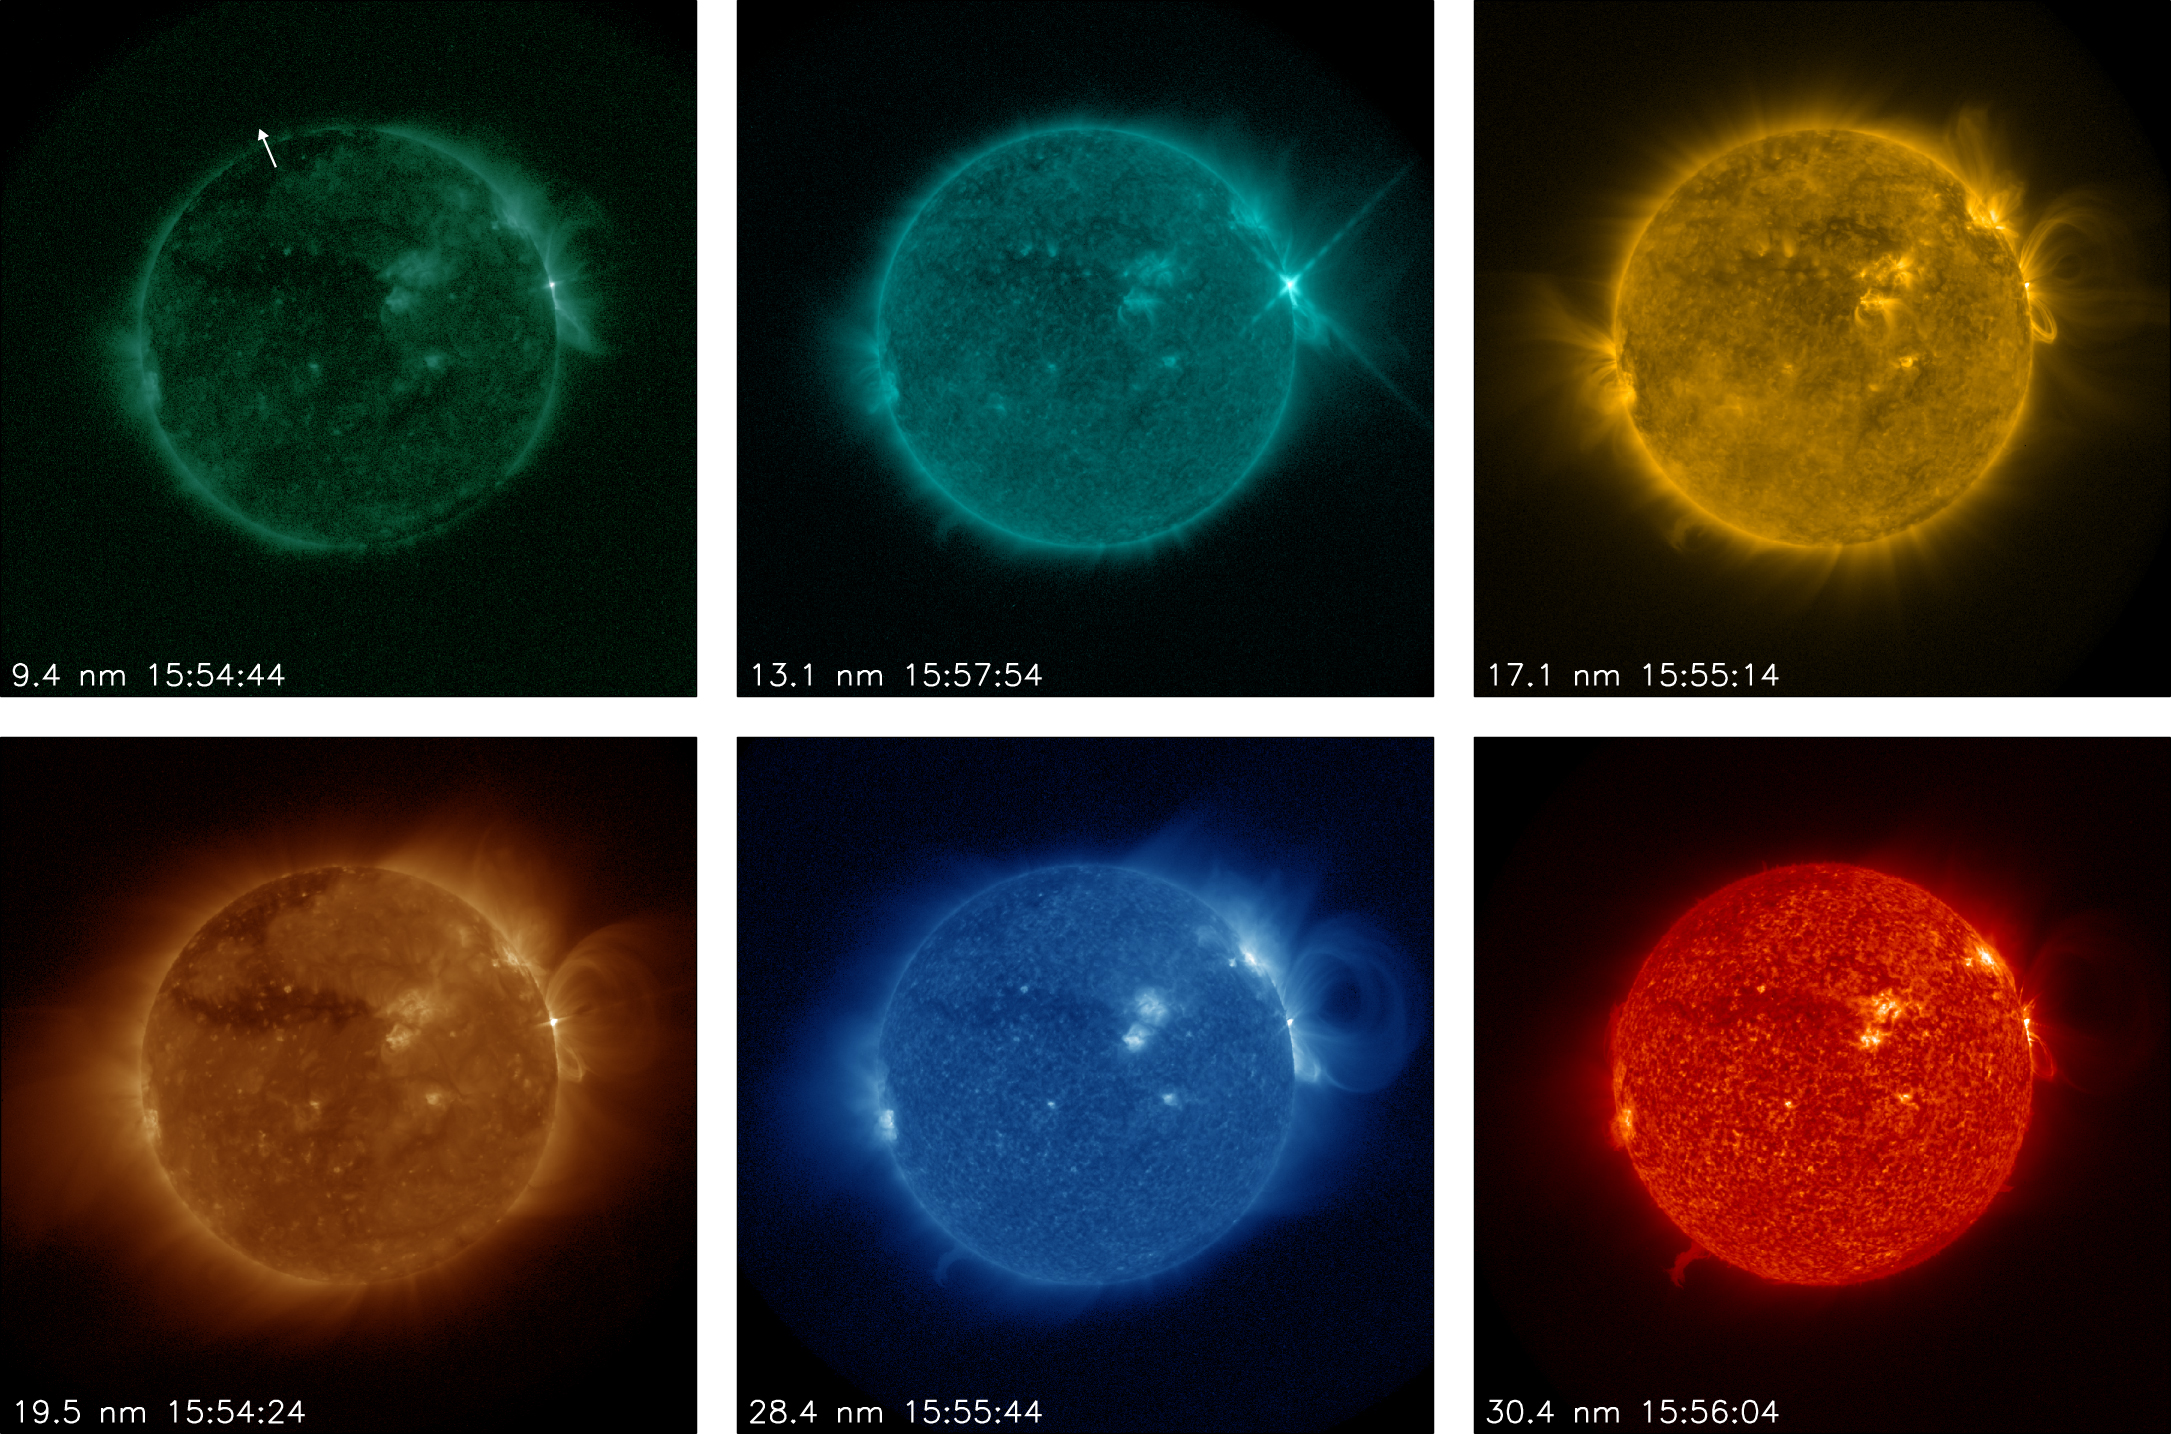 [SUVI’s view of the corona just after the onset of the event on September 10, 2017, as seen at different temperatures, or wavelengths. The bright flare at the upper right part of the sun is most clearly visible in the top middle frame (as hot as 10 million degrees K), while the flux rope accelerating into a coronal mass ejection is best seen in the first two frames of the bottom row (1–2 million degrees K). Courtesy of Dan Seaton, NCEI and CIRES.]
Modeling Solar Eruptions, Improving Space Weather Forecasts
Observations like those by SUVI will help scientists model solar eruptions and related phenomena. “There’s so much we don’t understand about solar physics,” Seaton says. “We have models but not enough observations to help us validate some of them. With SUVI, we can really see processes that have long been predicted and take that back to the models and start to refine them.” And, the discoveries made with SUVI could in turn improve predictions and drive the development of new instruments. “SUVI is showing us a lot about what we’re missing, such as how physics happening in one part of the sun’s atmosphere matters to the whole sun,” he says.
Observations from SUVI, along with other solar-pointing and space weather instruments on the GOES-16 satellite, will help the Space Weather Prediction Center significantly improve space weather forecasts and provide early warning of possible impacts to Earth’s space environment and potentially disruptive events on the ground. “SUVI’s new data products will combine all the wavelength information, updated every few seconds, to show how solar features evolve,” says Steve Goodman, chief program scientist for the NOAA satellite program from 2008–2017. “With the most up-to-date situational awareness—on coronal holes, solar flares, and coronal mass ejections—forecasters will be able to watch these trends in real time and issue more timely and accurate warnings.” Edited for WeatherNation by Meteorologist Mace Michaels


