Satellite Imagery Sheds Light on Agricultural Water Use
Special Stories
26 Apr 2018 11:50 AM
From NASA
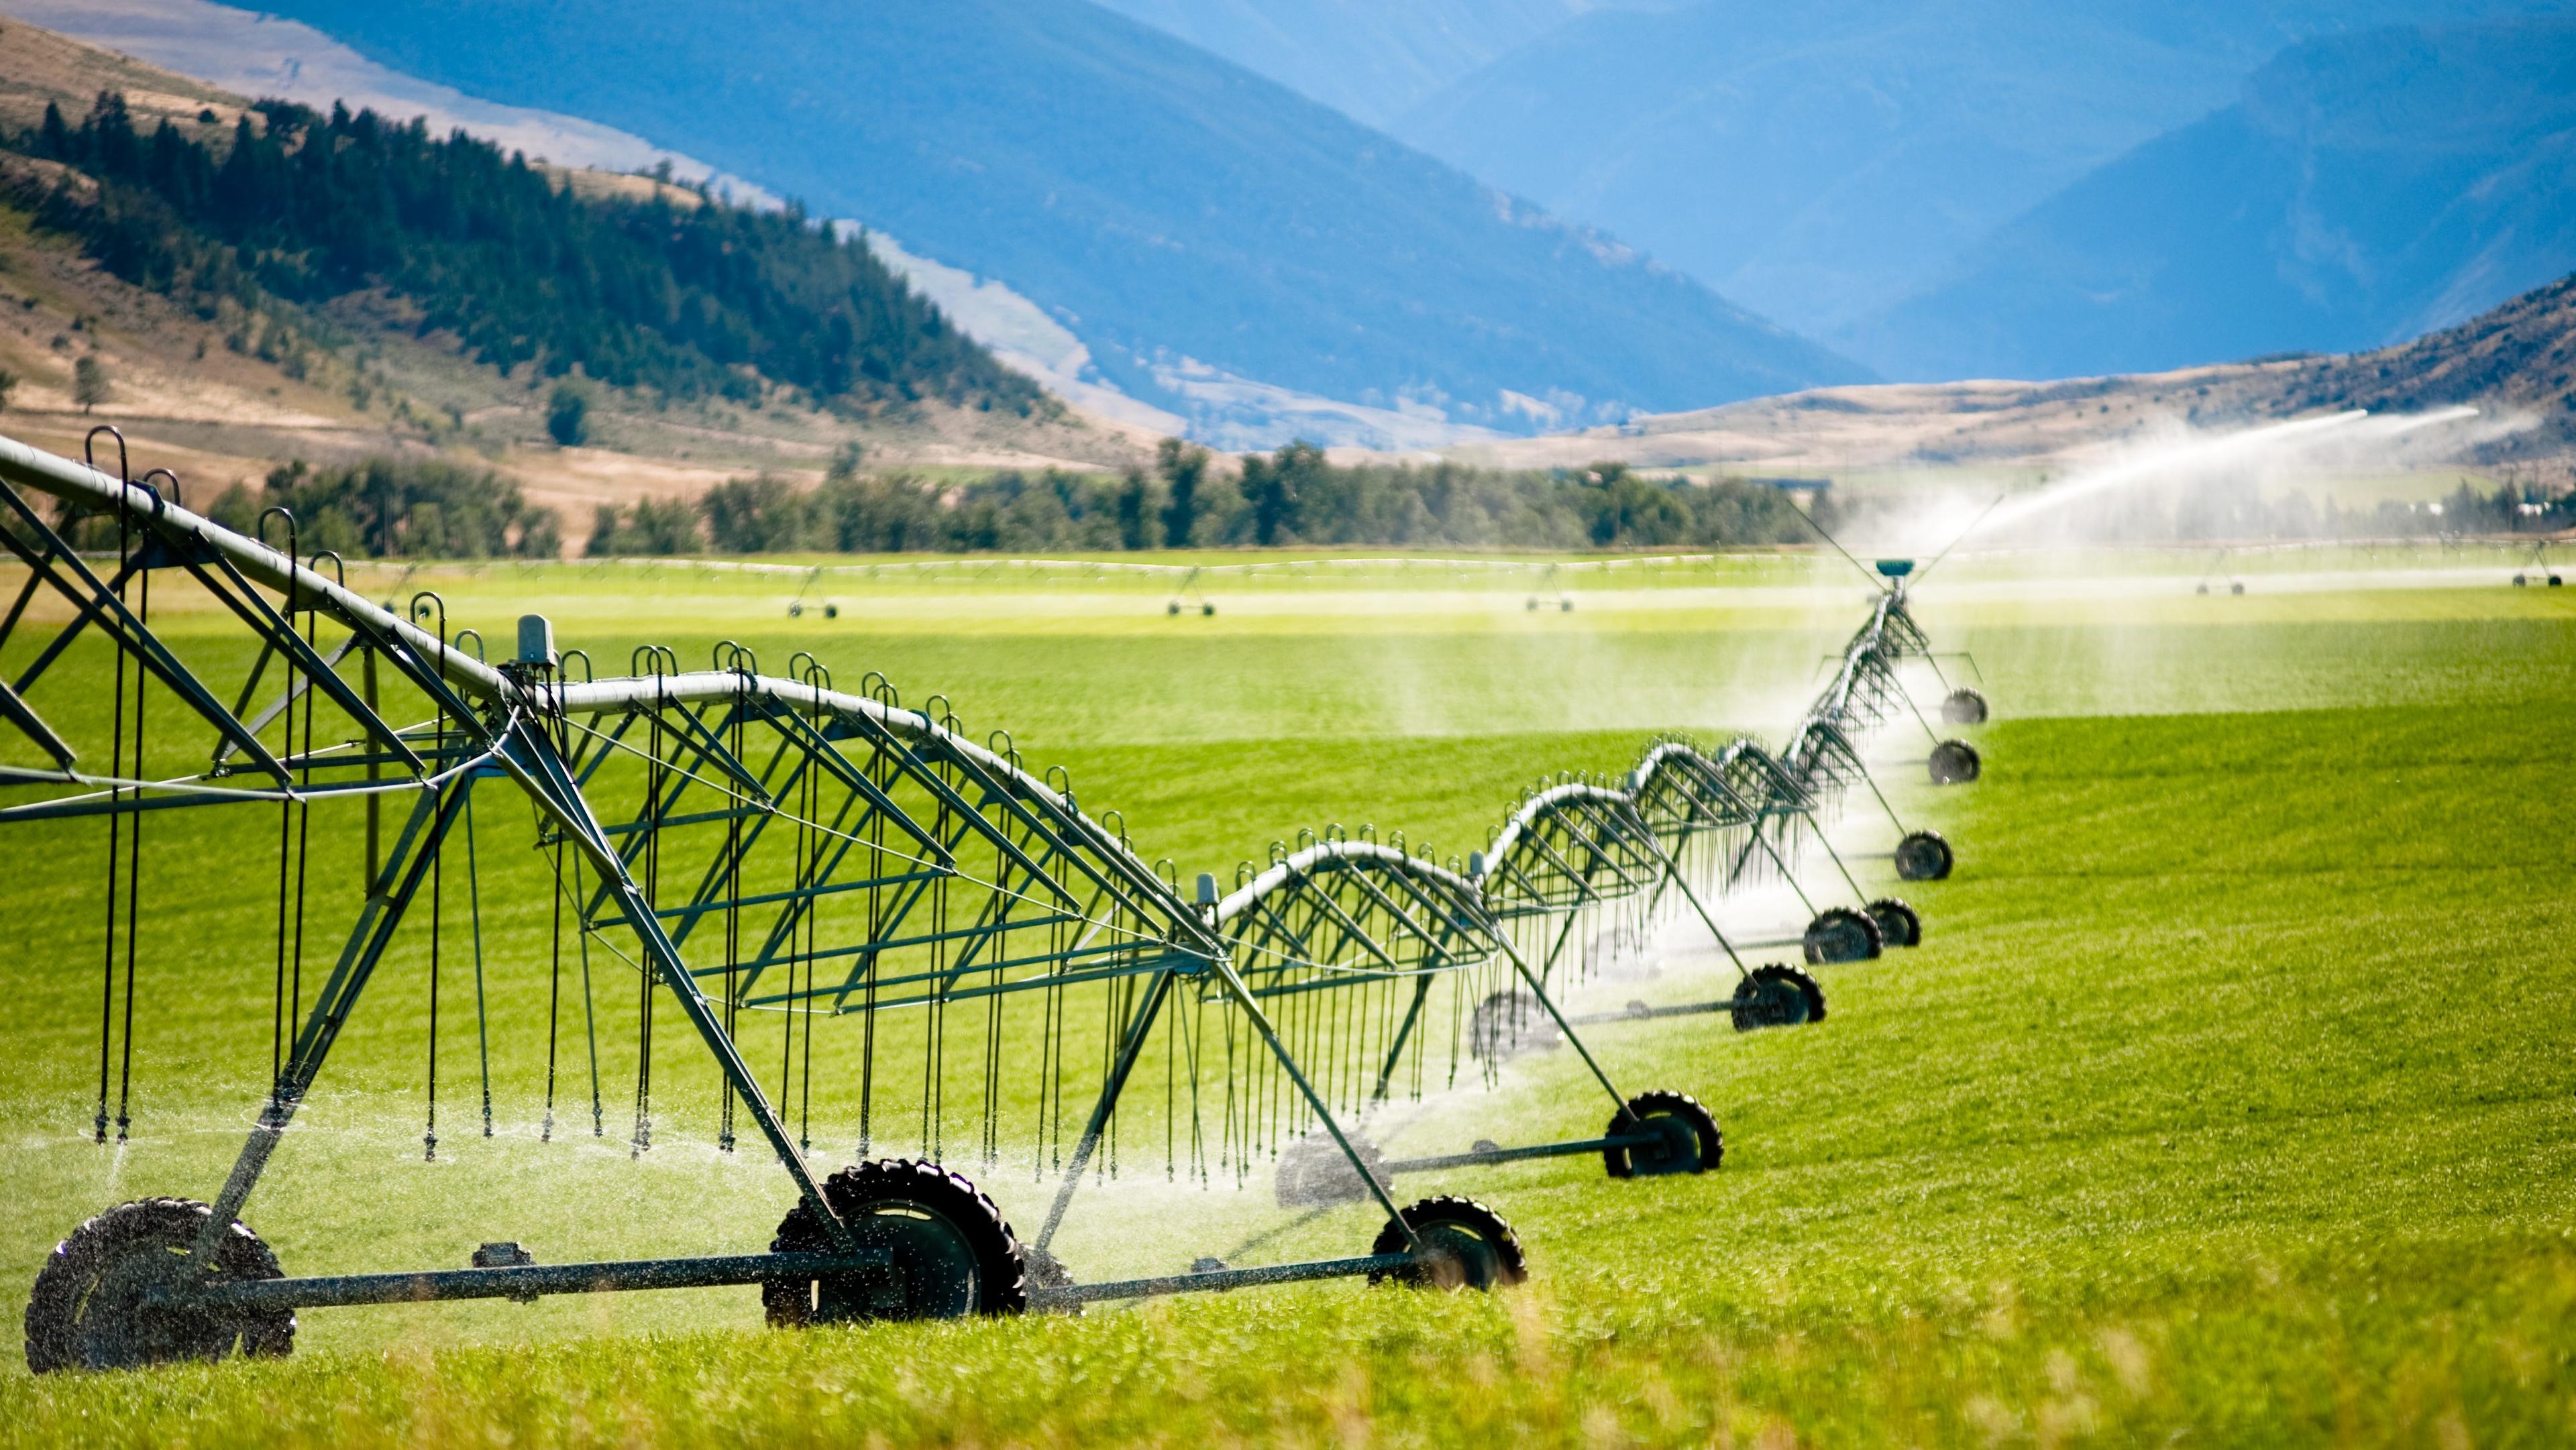
Earth may be the “Blue Planet,” with more than 70 percent of its surface covered in water, but it is still a thirsty planet, with freshwater in heavy demand. The most significant draw on the water supply is crop irrigation, accounting by some measures for nearly two-thirds of U.S. surface-freshwater withdrawals.
Keeping track of just how much water gets used—and making sure it gets used efficiently and legally, where and when it’s needed—across millions of acres of crop land is no easy task.
Researchers armed with data from the Landsat Earth-observing satellites recently teamed up with Google to make it a whole lot easier. The researchers from the University of Idaho, the University of Nebraska, and the Desert Research Institute are using the satellite images to map evapotranspiration—water evaporating from the ground or transpiring from the plants.
Evapotranspiration levels are a way to estimate how much water the plants are using. Some of the water vapor comes directly from the soil, but much of it passes through the plant first. “That’s a necessary process,” explains University of Idaho water resources engineering professor Richard Allen, “because it’s that flow of water from the soil that transports the nutrients the plant needs.”
 To keep that process going, the area needs water, either from rain or, quite often, from irrigation. “Evaporation and transpiration together represent the total consumption of the resource,” Allen says. And because both evaporation and transpiration use energy, they have a cooling effect, the same way sweating cools a person’s skin.
If farmers could compare actual evapotranspiration levels with an expected or ideal level, they’d have a better idea of whether they’re irrigating enough or overwatering. They could also look at evapotranspiration levels across the field to ensure they are getting uniform coverage from their sprinklers—not underwatering some spots or overwatering others.
NASA launched the first Landsat satellite in July 1972 and, under U.S. Geological Survey (USGS) management, the program has been providing continuous images of Earth’s surface ever since. The latest iteration, Landsat 8, was sent into orbit in February 2013 and produces high-resolution images of the entire planet every 16 days. With the help of Landsat 7, which is still in operation, full coverage is available every eight days. Both satellites carry a thermal imager that captures images in the infrared band, which shows warmer and cooler spots across Earth’s surface.
Technology Transfer
Allen has been using Landsat data to study evapotranspiration since about 1999, when he was first approached by the Idaho Department of Water Resources, which had received a grant from NASA, via Raytheon Corporation, aimed at finding wider uses for the satellite data.
Allen had recently been to a conference in Europe where, among others, a Dutch researcher named Wim Bastiaanssen presented information about using evapotranspiration mapping to improve water management. Bastiaanssen had devised a model called Surface Energy Balance Algorithm for Land (SEBAL), which Allen thought he could adapt and use in Idaho.
To keep that process going, the area needs water, either from rain or, quite often, from irrigation. “Evaporation and transpiration together represent the total consumption of the resource,” Allen says. And because both evaporation and transpiration use energy, they have a cooling effect, the same way sweating cools a person’s skin.
If farmers could compare actual evapotranspiration levels with an expected or ideal level, they’d have a better idea of whether they’re irrigating enough or overwatering. They could also look at evapotranspiration levels across the field to ensure they are getting uniform coverage from their sprinklers—not underwatering some spots or overwatering others.
NASA launched the first Landsat satellite in July 1972 and, under U.S. Geological Survey (USGS) management, the program has been providing continuous images of Earth’s surface ever since. The latest iteration, Landsat 8, was sent into orbit in February 2013 and produces high-resolution images of the entire planet every 16 days. With the help of Landsat 7, which is still in operation, full coverage is available every eight days. Both satellites carry a thermal imager that captures images in the infrared band, which shows warmer and cooler spots across Earth’s surface.
Technology Transfer
Allen has been using Landsat data to study evapotranspiration since about 1999, when he was first approached by the Idaho Department of Water Resources, which had received a grant from NASA, via Raytheon Corporation, aimed at finding wider uses for the satellite data.
Allen had recently been to a conference in Europe where, among others, a Dutch researcher named Wim Bastiaanssen presented information about using evapotranspiration mapping to improve water management. Bastiaanssen had devised a model called Surface Energy Balance Algorithm for Land (SEBAL), which Allen thought he could adapt and use in Idaho.
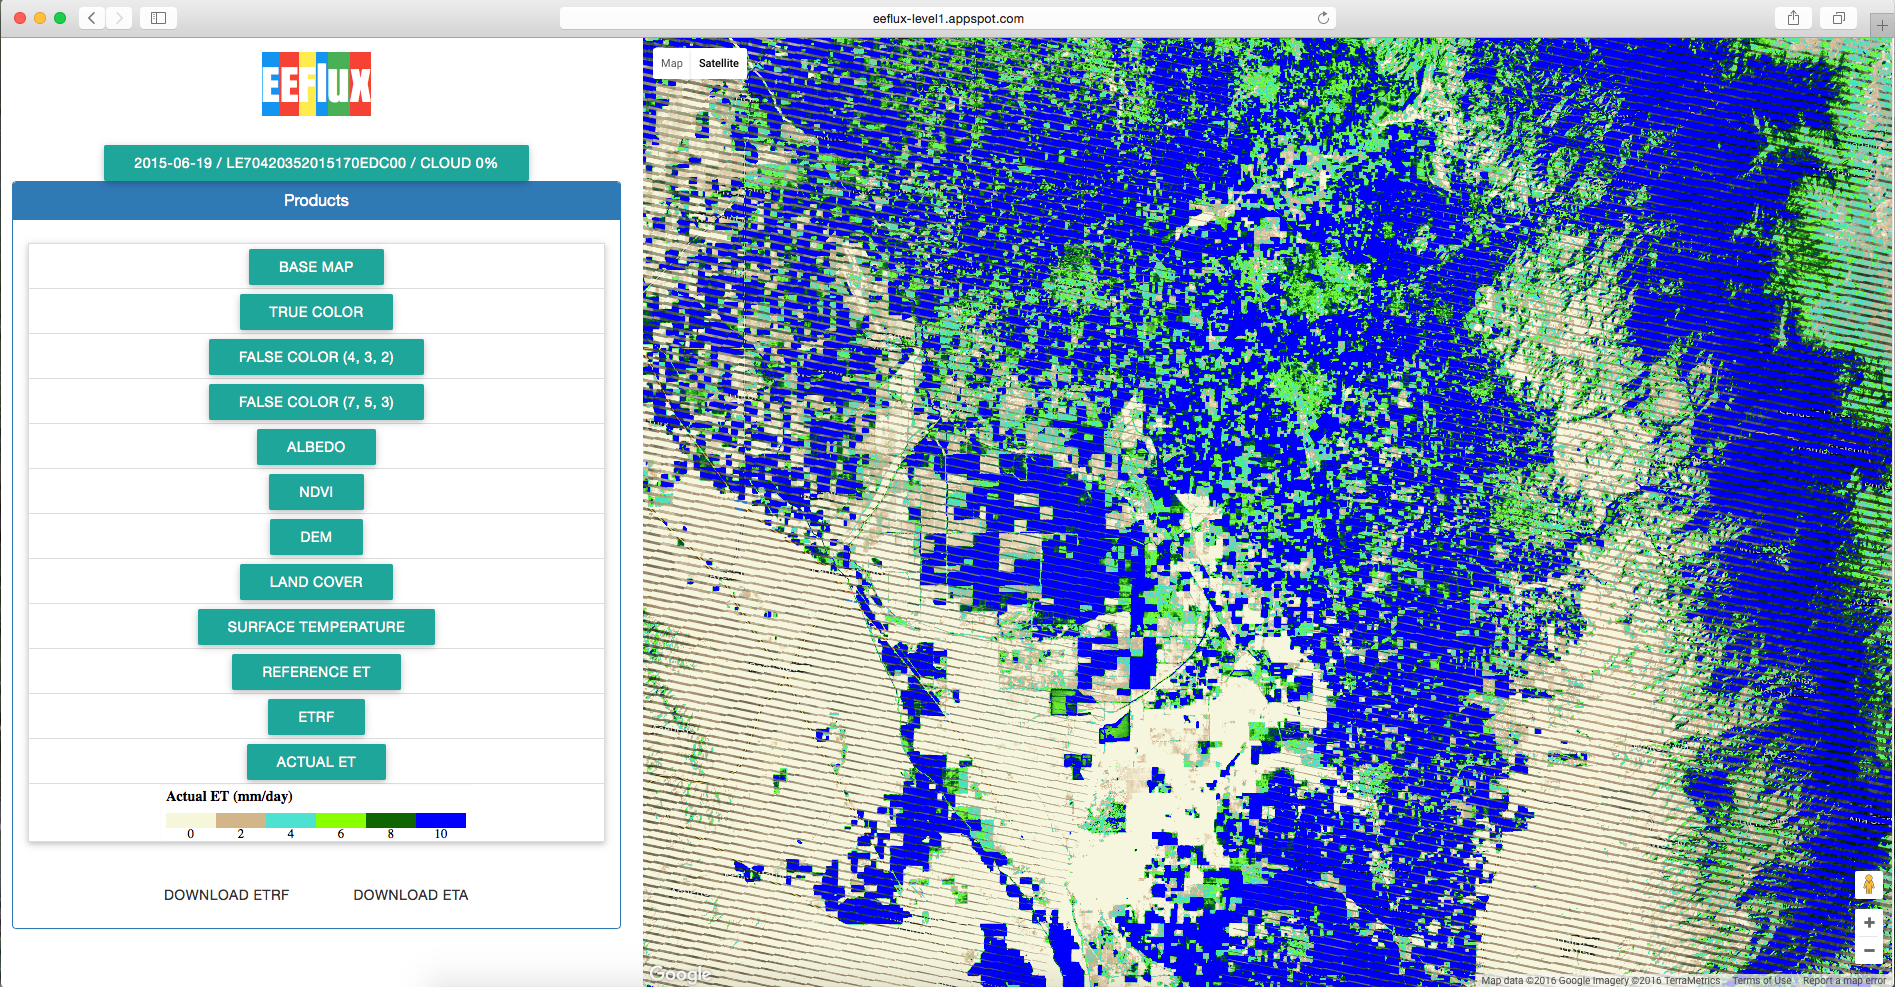 [Using infrared imagery captured by Landsat satellites and publicly available on the Internet through Google Earth Engine, EEFlux can quickly create maps of evapotranspiration, a way to measure how much water is being used. In this map of an agricultural region in California, dark blue and dark green represent higher levels of evapotranspiration, while light brown represents low levels.]
“After about three to four years, we started evolving SEBAL to fit with our usage in the west. We named it METRIC and have been evolving it ever since,” Allen says. METRIC, short for Mapping Evapotranspiration with Internalized Calibration, required downloading the massive set of Landsat images to a desktop computer and calibrating them with weather-station data and other details—not something that could be easily done without training, access to powerful computers, and time.
So when Mountain View, California-based Google unveiled its Google Earth Engine in 2010, Allen and his collaborators saw an opportunity. The cloud computing platform uses Landsat data, which USGS had begun distributing free of charge, making the huge trove of information accessible worldwide.
“What Earth Engine can do is get rid of a lot of the grunt work of just downloading and storing data. That can take up a significant amount of time for any researcher,” explains Google Earth Engine developer advocate Tyler Erickson.
Allen, alongside Ayse Kilic from the University of Nebraska and Justin Huntington of the Desert Research Institute and with input and guidance from Google’s team, led the effort to modify the METRIC algorithm to work with Earth Engine, creating Earth Engine Evapotranspiration Flux (EEFlux). Now anyone with access to the Internet can access the Landsat data, choose a location, and see an evapotranspiration map within seconds.
[Using infrared imagery captured by Landsat satellites and publicly available on the Internet through Google Earth Engine, EEFlux can quickly create maps of evapotranspiration, a way to measure how much water is being used. In this map of an agricultural region in California, dark blue and dark green represent higher levels of evapotranspiration, while light brown represents low levels.]
“After about three to four years, we started evolving SEBAL to fit with our usage in the west. We named it METRIC and have been evolving it ever since,” Allen says. METRIC, short for Mapping Evapotranspiration with Internalized Calibration, required downloading the massive set of Landsat images to a desktop computer and calibrating them with weather-station data and other details—not something that could be easily done without training, access to powerful computers, and time.
So when Mountain View, California-based Google unveiled its Google Earth Engine in 2010, Allen and his collaborators saw an opportunity. The cloud computing platform uses Landsat data, which USGS had begun distributing free of charge, making the huge trove of information accessible worldwide.
“What Earth Engine can do is get rid of a lot of the grunt work of just downloading and storing data. That can take up a significant amount of time for any researcher,” explains Google Earth Engine developer advocate Tyler Erickson.
Allen, alongside Ayse Kilic from the University of Nebraska and Justin Huntington of the Desert Research Institute and with input and guidance from Google’s team, led the effort to modify the METRIC algorithm to work with Earth Engine, creating Earth Engine Evapotranspiration Flux (EEFlux). Now anyone with access to the Internet can access the Landsat data, choose a location, and see an evapotranspiration map within seconds.
 [In this animation, the first image shows an agricultural region in Idaho on August 14, 2000, captured in the visible spectrum. The round, green circles are irrigated farm fields. The second image, using Landsat's thermal band, depicts cooler and warmer areas. Irrigated fields appear cooler because evapotranspiring water absorbs energy and cools the fields. The thermal image dissolves into a map of evapotranspiration, created using the METRIC tool.]
Benefits
“We are very happy that they are making an application that will reach a wider net of users, rather than just their own research group,” Erickson enthuses.
Early users of EEFlux include the California Department of Water Resources, the California Water Control Board, and the World Bank, and the researchers expect to expand its use more widely as the program completes beta testing. They are also still fleshing out the application so it can fill the gaps between satellite snapshots and reflect the total depletion of water over the course of a growing season, Allen says. This is something he can do with METRIC, but it hasn’t been adapted to Earth Engine yet.
The program is most useful for “groups of water users that need to be managing the water resources as a unit, because they’re impacting groundwater pumping,” he explains. “They need to know who’s pumping, is it sustainable? What are we going to do about getting extraction in line with sustainable recharge?”
And when water management agencies are creating plans to improve irrigation efficiency or evaluating proposed transfers of water rights between farmers and cities, they also need data. “They often have questions like: ‘How much water is actually saved?’ and ‘Is the new crop using more or less water than had been consumed in the past?’” Huntington explains. “With METRIC and EEFlux applications, detailed answers can be obtained quickly.”
The algorithm is also helpful in alerting to early signs of drought, notes Kilic. Previously, water-monitoring groups would use vegetation indices, which look at the health of plants, to pick up signs of a drought. “But that doesn’t pick up the drought immediately,” she says. “We prefer an evapotranspiration, or ET, drought index, which is satellite-based, and it really picks up that drought signature immediately.”
Allen explains, “That field may still look green, but if it’s stressed because the soil is dry, it’s going to reduce its ET and reduce its yield.”
https://www.youtube.com/watch?v=oNcZ8Ogk4zc
Beyond water management agencies, he adds, “we want to get this in the hands of the individual farmers.”
“They’re already doing precision agriculture,” choosing carefully how best to irrigate fields, Kilic says, especially in states with limited water supply. “Now let’s say there’s a lower yield in one part of the field, what is the cause? Is it because of the irrigation practices? They can see that from their water consumption map. Having this data will allow them to spot the problem immediately.”
Currently, the main avenue for gathering water consumption information across large farms is to send airborne drones to take pictures, she says. A free, web-based system that uses satellite data stands to save a lot of money, either for the company providing that information on a consultant basis for the farmers or for the farmers themselves.
But none of it would have been possible without the thermal infrared images taken by the satellites NASA put into orbit, something, Allen notes, that almost didn’t happen at all, because plans for Landsat 8 initially didn’t include a thermal imager.
“The water resources communities all through the United States, especially in the irrigated areas, are very appreciative that NASA put the thermal imager on Landsat 8 and that future Landsats are guaranteed to include a thermal imager,” he says.
Edited for WeatherNation by Meteorologist Mace Michaels
[In this animation, the first image shows an agricultural region in Idaho on August 14, 2000, captured in the visible spectrum. The round, green circles are irrigated farm fields. The second image, using Landsat's thermal band, depicts cooler and warmer areas. Irrigated fields appear cooler because evapotranspiring water absorbs energy and cools the fields. The thermal image dissolves into a map of evapotranspiration, created using the METRIC tool.]
Benefits
“We are very happy that they are making an application that will reach a wider net of users, rather than just their own research group,” Erickson enthuses.
Early users of EEFlux include the California Department of Water Resources, the California Water Control Board, and the World Bank, and the researchers expect to expand its use more widely as the program completes beta testing. They are also still fleshing out the application so it can fill the gaps between satellite snapshots and reflect the total depletion of water over the course of a growing season, Allen says. This is something he can do with METRIC, but it hasn’t been adapted to Earth Engine yet.
The program is most useful for “groups of water users that need to be managing the water resources as a unit, because they’re impacting groundwater pumping,” he explains. “They need to know who’s pumping, is it sustainable? What are we going to do about getting extraction in line with sustainable recharge?”
And when water management agencies are creating plans to improve irrigation efficiency or evaluating proposed transfers of water rights between farmers and cities, they also need data. “They often have questions like: ‘How much water is actually saved?’ and ‘Is the new crop using more or less water than had been consumed in the past?’” Huntington explains. “With METRIC and EEFlux applications, detailed answers can be obtained quickly.”
The algorithm is also helpful in alerting to early signs of drought, notes Kilic. Previously, water-monitoring groups would use vegetation indices, which look at the health of plants, to pick up signs of a drought. “But that doesn’t pick up the drought immediately,” she says. “We prefer an evapotranspiration, or ET, drought index, which is satellite-based, and it really picks up that drought signature immediately.”
Allen explains, “That field may still look green, but if it’s stressed because the soil is dry, it’s going to reduce its ET and reduce its yield.”
https://www.youtube.com/watch?v=oNcZ8Ogk4zc
Beyond water management agencies, he adds, “we want to get this in the hands of the individual farmers.”
“They’re already doing precision agriculture,” choosing carefully how best to irrigate fields, Kilic says, especially in states with limited water supply. “Now let’s say there’s a lower yield in one part of the field, what is the cause? Is it because of the irrigation practices? They can see that from their water consumption map. Having this data will allow them to spot the problem immediately.”
Currently, the main avenue for gathering water consumption information across large farms is to send airborne drones to take pictures, she says. A free, web-based system that uses satellite data stands to save a lot of money, either for the company providing that information on a consultant basis for the farmers or for the farmers themselves.
But none of it would have been possible without the thermal infrared images taken by the satellites NASA put into orbit, something, Allen notes, that almost didn’t happen at all, because plans for Landsat 8 initially didn’t include a thermal imager.
“The water resources communities all through the United States, especially in the irrigated areas, are very appreciative that NASA put the thermal imager on Landsat 8 and that future Landsats are guaranteed to include a thermal imager,” he says.
Edited for WeatherNation by Meteorologist Mace Michaels
To keep that process going, the area needs water, either from rain or, quite often, from irrigation. “Evaporation and transpiration together represent the total consumption of the resource,” Allen says. And because both evaporation and transpiration use energy, they have a cooling effect, the same way sweating cools a person’s skin.
If farmers could compare actual evapotranspiration levels with an expected or ideal level, they’d have a better idea of whether they’re irrigating enough or overwatering. They could also look at evapotranspiration levels across the field to ensure they are getting uniform coverage from their sprinklers—not underwatering some spots or overwatering others.
NASA launched the first Landsat satellite in July 1972 and, under U.S. Geological Survey (USGS) management, the program has been providing continuous images of Earth’s surface ever since. The latest iteration, Landsat 8, was sent into orbit in February 2013 and produces high-resolution images of the entire planet every 16 days. With the help of Landsat 7, which is still in operation, full coverage is available every eight days. Both satellites carry a thermal imager that captures images in the infrared band, which shows warmer and cooler spots across Earth’s surface.
Technology Transfer
Allen has been using Landsat data to study evapotranspiration since about 1999, when he was first approached by the Idaho Department of Water Resources, which had received a grant from NASA, via Raytheon Corporation, aimed at finding wider uses for the satellite data.
Allen had recently been to a conference in Europe where, among others, a Dutch researcher named Wim Bastiaanssen presented information about using evapotranspiration mapping to improve water management. Bastiaanssen had devised a model called Surface Energy Balance Algorithm for Land (SEBAL), which Allen thought he could adapt and use in Idaho.
[Using infrared imagery captured by Landsat satellites and publicly available on the Internet through Google Earth Engine, EEFlux can quickly create maps of evapotranspiration, a way to measure how much water is being used. In this map of an agricultural region in California, dark blue and dark green represent higher levels of evapotranspiration, while light brown represents low levels.]
“After about three to four years, we started evolving SEBAL to fit with our usage in the west. We named it METRIC and have been evolving it ever since,” Allen says. METRIC, short for Mapping Evapotranspiration with Internalized Calibration, required downloading the massive set of Landsat images to a desktop computer and calibrating them with weather-station data and other details—not something that could be easily done without training, access to powerful computers, and time.
So when Mountain View, California-based Google unveiled its Google Earth Engine in 2010, Allen and his collaborators saw an opportunity. The cloud computing platform uses Landsat data, which USGS had begun distributing free of charge, making the huge trove of information accessible worldwide.
“What Earth Engine can do is get rid of a lot of the grunt work of just downloading and storing data. That can take up a significant amount of time for any researcher,” explains Google Earth Engine developer advocate Tyler Erickson.
Allen, alongside Ayse Kilic from the University of Nebraska and Justin Huntington of the Desert Research Institute and with input and guidance from Google’s team, led the effort to modify the METRIC algorithm to work with Earth Engine, creating Earth Engine Evapotranspiration Flux (EEFlux). Now anyone with access to the Internet can access the Landsat data, choose a location, and see an evapotranspiration map within seconds.
[In this animation, the first image shows an agricultural region in Idaho on August 14, 2000, captured in the visible spectrum. The round, green circles are irrigated farm fields. The second image, using Landsat's thermal band, depicts cooler and warmer areas. Irrigated fields appear cooler because evapotranspiring water absorbs energy and cools the fields. The thermal image dissolves into a map of evapotranspiration, created using the METRIC tool.]
Benefits
“We are very happy that they are making an application that will reach a wider net of users, rather than just their own research group,” Erickson enthuses.
Early users of EEFlux include the California Department of Water Resources, the California Water Control Board, and the World Bank, and the researchers expect to expand its use more widely as the program completes beta testing. They are also still fleshing out the application so it can fill the gaps between satellite snapshots and reflect the total depletion of water over the course of a growing season, Allen says. This is something he can do with METRIC, but it hasn’t been adapted to Earth Engine yet.
The program is most useful for “groups of water users that need to be managing the water resources as a unit, because they’re impacting groundwater pumping,” he explains. “They need to know who’s pumping, is it sustainable? What are we going to do about getting extraction in line with sustainable recharge?”
And when water management agencies are creating plans to improve irrigation efficiency or evaluating proposed transfers of water rights between farmers and cities, they also need data. “They often have questions like: ‘How much water is actually saved?’ and ‘Is the new crop using more or less water than had been consumed in the past?’” Huntington explains. “With METRIC and EEFlux applications, detailed answers can be obtained quickly.”
The algorithm is also helpful in alerting to early signs of drought, notes Kilic. Previously, water-monitoring groups would use vegetation indices, which look at the health of plants, to pick up signs of a drought. “But that doesn’t pick up the drought immediately,” she says. “We prefer an evapotranspiration, or ET, drought index, which is satellite-based, and it really picks up that drought signature immediately.”
Allen explains, “That field may still look green, but if it’s stressed because the soil is dry, it’s going to reduce its ET and reduce its yield.”
https://www.youtube.com/watch?v=oNcZ8Ogk4zc
Beyond water management agencies, he adds, “we want to get this in the hands of the individual farmers.”
“They’re already doing precision agriculture,” choosing carefully how best to irrigate fields, Kilic says, especially in states with limited water supply. “Now let’s say there’s a lower yield in one part of the field, what is the cause? Is it because of the irrigation practices? They can see that from their water consumption map. Having this data will allow them to spot the problem immediately.”
Currently, the main avenue for gathering water consumption information across large farms is to send airborne drones to take pictures, she says. A free, web-based system that uses satellite data stands to save a lot of money, either for the company providing that information on a consultant basis for the farmers or for the farmers themselves.
But none of it would have been possible without the thermal infrared images taken by the satellites NASA put into orbit, something, Allen notes, that almost didn’t happen at all, because plans for Landsat 8 initially didn’t include a thermal imager.
“The water resources communities all through the United States, especially in the irrigated areas, are very appreciative that NASA put the thermal imager on Landsat 8 and that future Landsats are guaranteed to include a thermal imager,” he says.
Edited for WeatherNation by Meteorologist Mace MichaelsAll Weather News
More
Flooding & Severe Storms Target the Southwest
A low pressure system coming across the Weste
23 Oct 2026 2:05 AM

Tropical Storm Vance Forms In The Pacific
Isaias ended the late-season streak of no hur
23 Oct 2026 2:00 AM

Warmer Than Average: Above-Normal Temperatures Across the Central U.S. This Week
WHAT TO EXPECTA ridge of high pressure will b
23 Oct 2026 1:45 AM


Several Fires Break Out in SoCal Last Week Amid Santa Ana Wind Event
Santa Ana winds helped several fires grow qui
19 Oct 2026 1:25 PM

Another Cold Morning Before Things Warm Back Up
Across portions of the Ohio Valley through th
19 Oct 2026 10:15 AM

Severe Risk Diminishing Saturday Morning for the Northeast
Severe Storm PotentialSevere risk is decreasi
16 Oct 2026 10:20 AM