Twenty Years of NOAA’s Historical Hurricane Tracks Tool
Special Stories
9 Sep 2022 3:56 PM
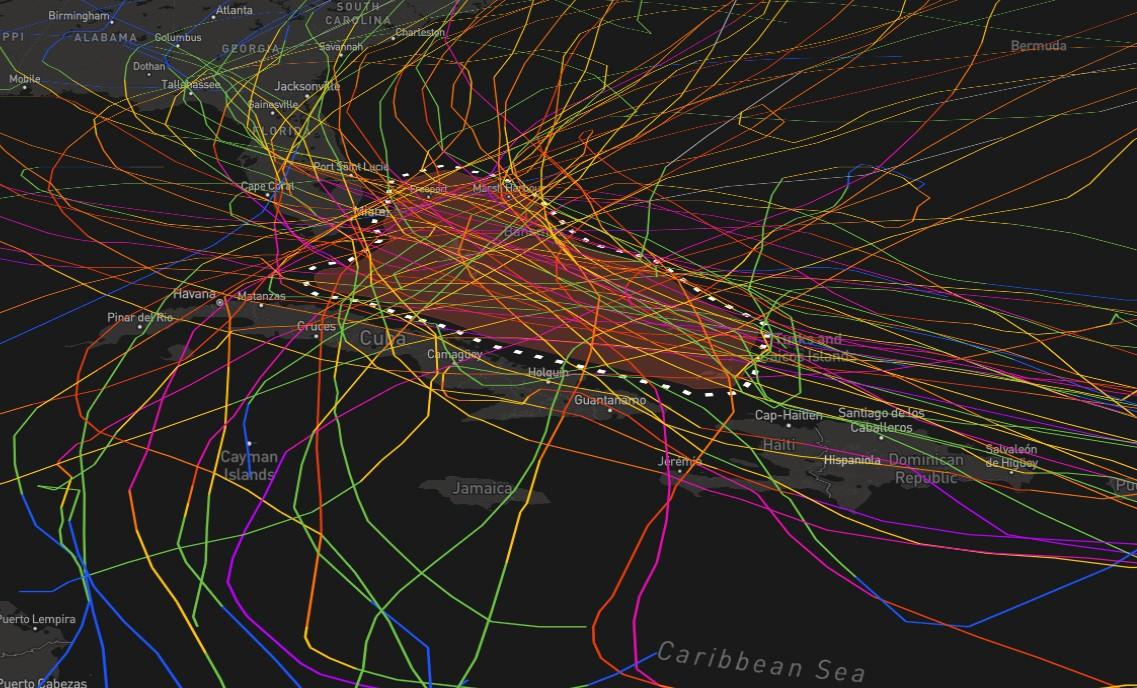
[To a history buff, this Historical Hurricane Tracks image shows all hurricane paths crossing the Bahamas since 1900. To National Hurricane Center experts, this image reveals storm-approach data helpful for running thousands of hypothetical storm scenarios. Bahamian planning and response officials benefit. Photo credit: NOAA]
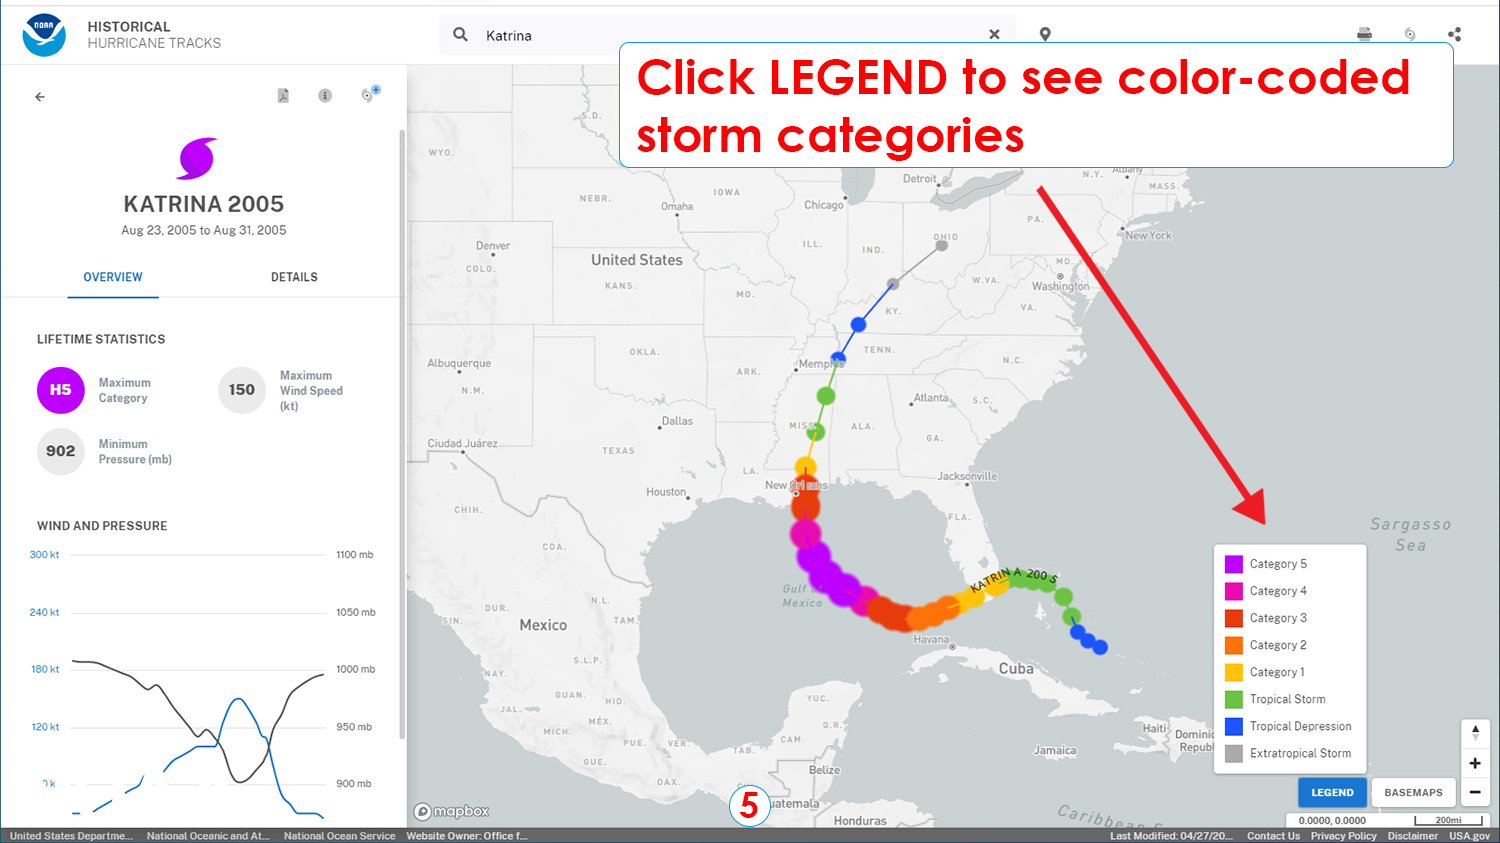
[Written by NOAA] One score and several months ago, the director of NOAA’s National Hurricane Center called up a colleague and asked whether a tool showing historical hurricane tracks could be created. Oh, and could it be done in four months? Cue lots of rallying and putting heads together, and the Historical Hurricane Tracks tool was born. This tool enables users to view, analyze, and share historical hurricane tracking information going back more than 150 years. It is one of the longest-running tools the Office for Coastal Management has ever developed, and its relevance seems to grow as hazards intensify.
The public are big fans of the tool, but its applications go beyond scoping out vacation destinations and wedding spots during hurricane season. It has true technical uses in modeling. Analysts at NOAA’s National Hurricane Center use Historical Hurricane Tracks to determine the highest probable directions and speeds that storms will approach land. Recently, storm surge specialists helped Guam by using the tool to view storms of all categories that had impacted the island. With this information, they were able to target their storm-surge impact modeling to these directions and intensities.
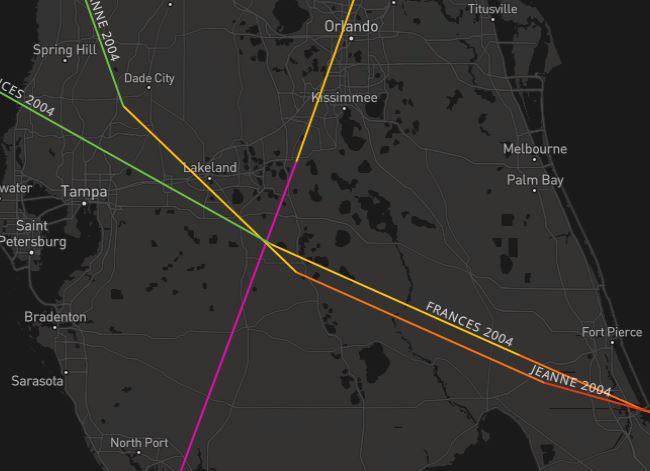 [The tool’s map shows that three 2004 storms—Charley, Frances, and Jeanne—tracked over one location in Central Florida. Photo credit: NOAA]
Hurricane-related disasters pile up
Of the 310 billion-dollar weather disasters occurring between 1980 and 2021, hurricanes have caused both the most damage—over $1.1 trillion, with an average cost of $20.5 billion per event—and the highest number of deaths, at 6,697. As a result, interest in historical hurricane data increases. Historical Hurricane Tracks’ efficiency and data access are growing, too. Twenty years ago, it took months to get the previous year’s storm tracks into the tool. Now, it takes one and a half days. To learn more about this Digital Coast product, check out a tiny tutorial. (2022)
[The tool’s map shows that three 2004 storms—Charley, Frances, and Jeanne—tracked over one location in Central Florida. Photo credit: NOAA]All Weather News
More
Mount Slushmore? Taking a look at Dakota Snow Chances
The cooler weather is finding places to go fi
25 Oct 2026 10:45 PM

Major River Flooding Causes Damage; Another Day of Storms in New Mexico
A powerful low pressure system has been movin
25 Oct 2026 10:25 PM

Tropical Storm Vance Swirling in the Pacific
After becoming a hurricane Friday, Vance has
25 Oct 2026 10:00 PM

Sunny Day Flooding; King Tides Surge This Week
This week, the ocean is coming to low lying a
25 Oct 2026 8:55 PM

Warmer Than Average: Above-Normal Temperatures Across the Central U.S. This Week
WHAT TO EXPECTA ridge of high pressure linger
25 Oct 2026 10:15 AM


Several Fires Break Out in SoCal Last Week Amid Santa Ana Wind Event
Santa Ana winds helped several fires grow qui
19 Oct 2026 1:25 PM