A Visit to the Weather Zoo: Climate Patterns that can Precede El Nino
Special Stories
26 Dec 2019 1:19 AM
[NOAA by Emily Becker] There are lots of different global climate patterns, not just the El Niño-Southern Oscillation (ENSO!) pattern. We’re named after ENSO because that’s the 800-pound gorilla, the most influential seasonal climate phenomenon so far identified—check out the NOAA Climate FAQ for a lot more info on ENSO. But the global ocean/atmosphere system features many other, smaller gorillas, and some chimpanzees, lemurs, koalas, lions, and a platypus or two. (These are definitely not technical categories, although I might dedicate the rest of my career to making them so.)
Some of those other animals climate patterns, such as the Madden-Julian Oscillation, are carefully monitored because they’re known to affect weather and climate around the world. Others can give us an early glimpse into how ENSO might develop, such as the Pacific Meridional Mode or the South Pacific Oscillation. It’s this second collection of patterns, called ENSO precursors, that I’m going to dig into today.
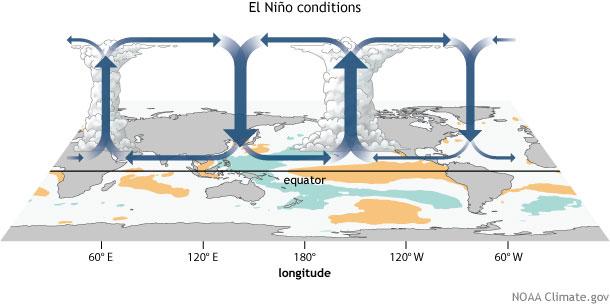
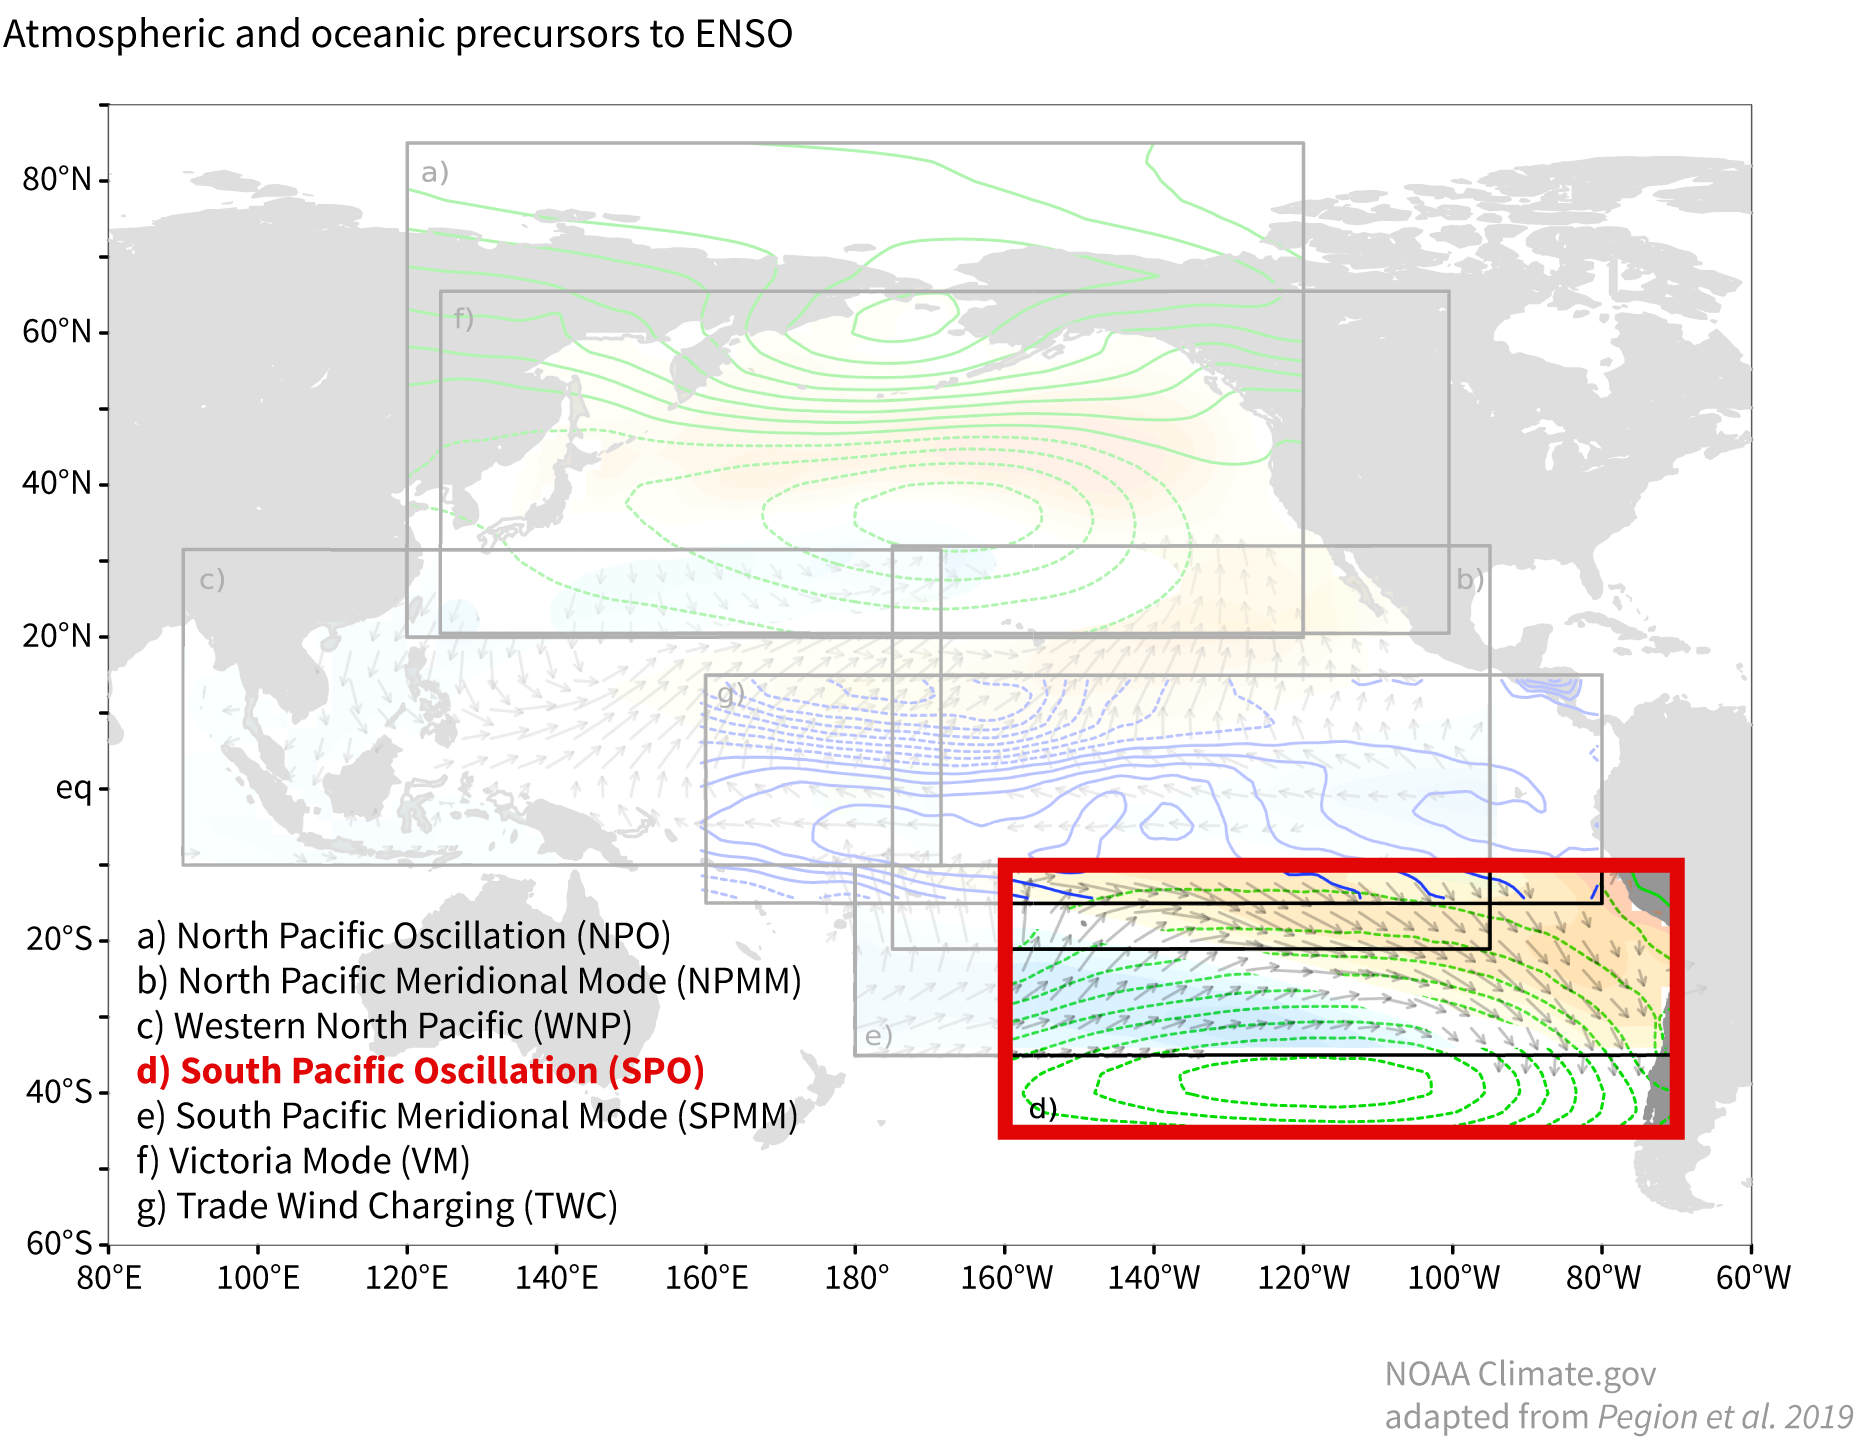
 [Animation showing seven ENSO precursor patterns. Shaded colors show sea surface temperature (reds = warmer than average, blues = cooler), green lines show sea level pressure (solid = stronger than average, dotted = weaker), arrows show wind direction, and blue lines show wind stress, the force exerted on the water surface by the wind (solid = more than average, dotted = less). Figure by Kathy Pegion, animation by NOAA Climate]
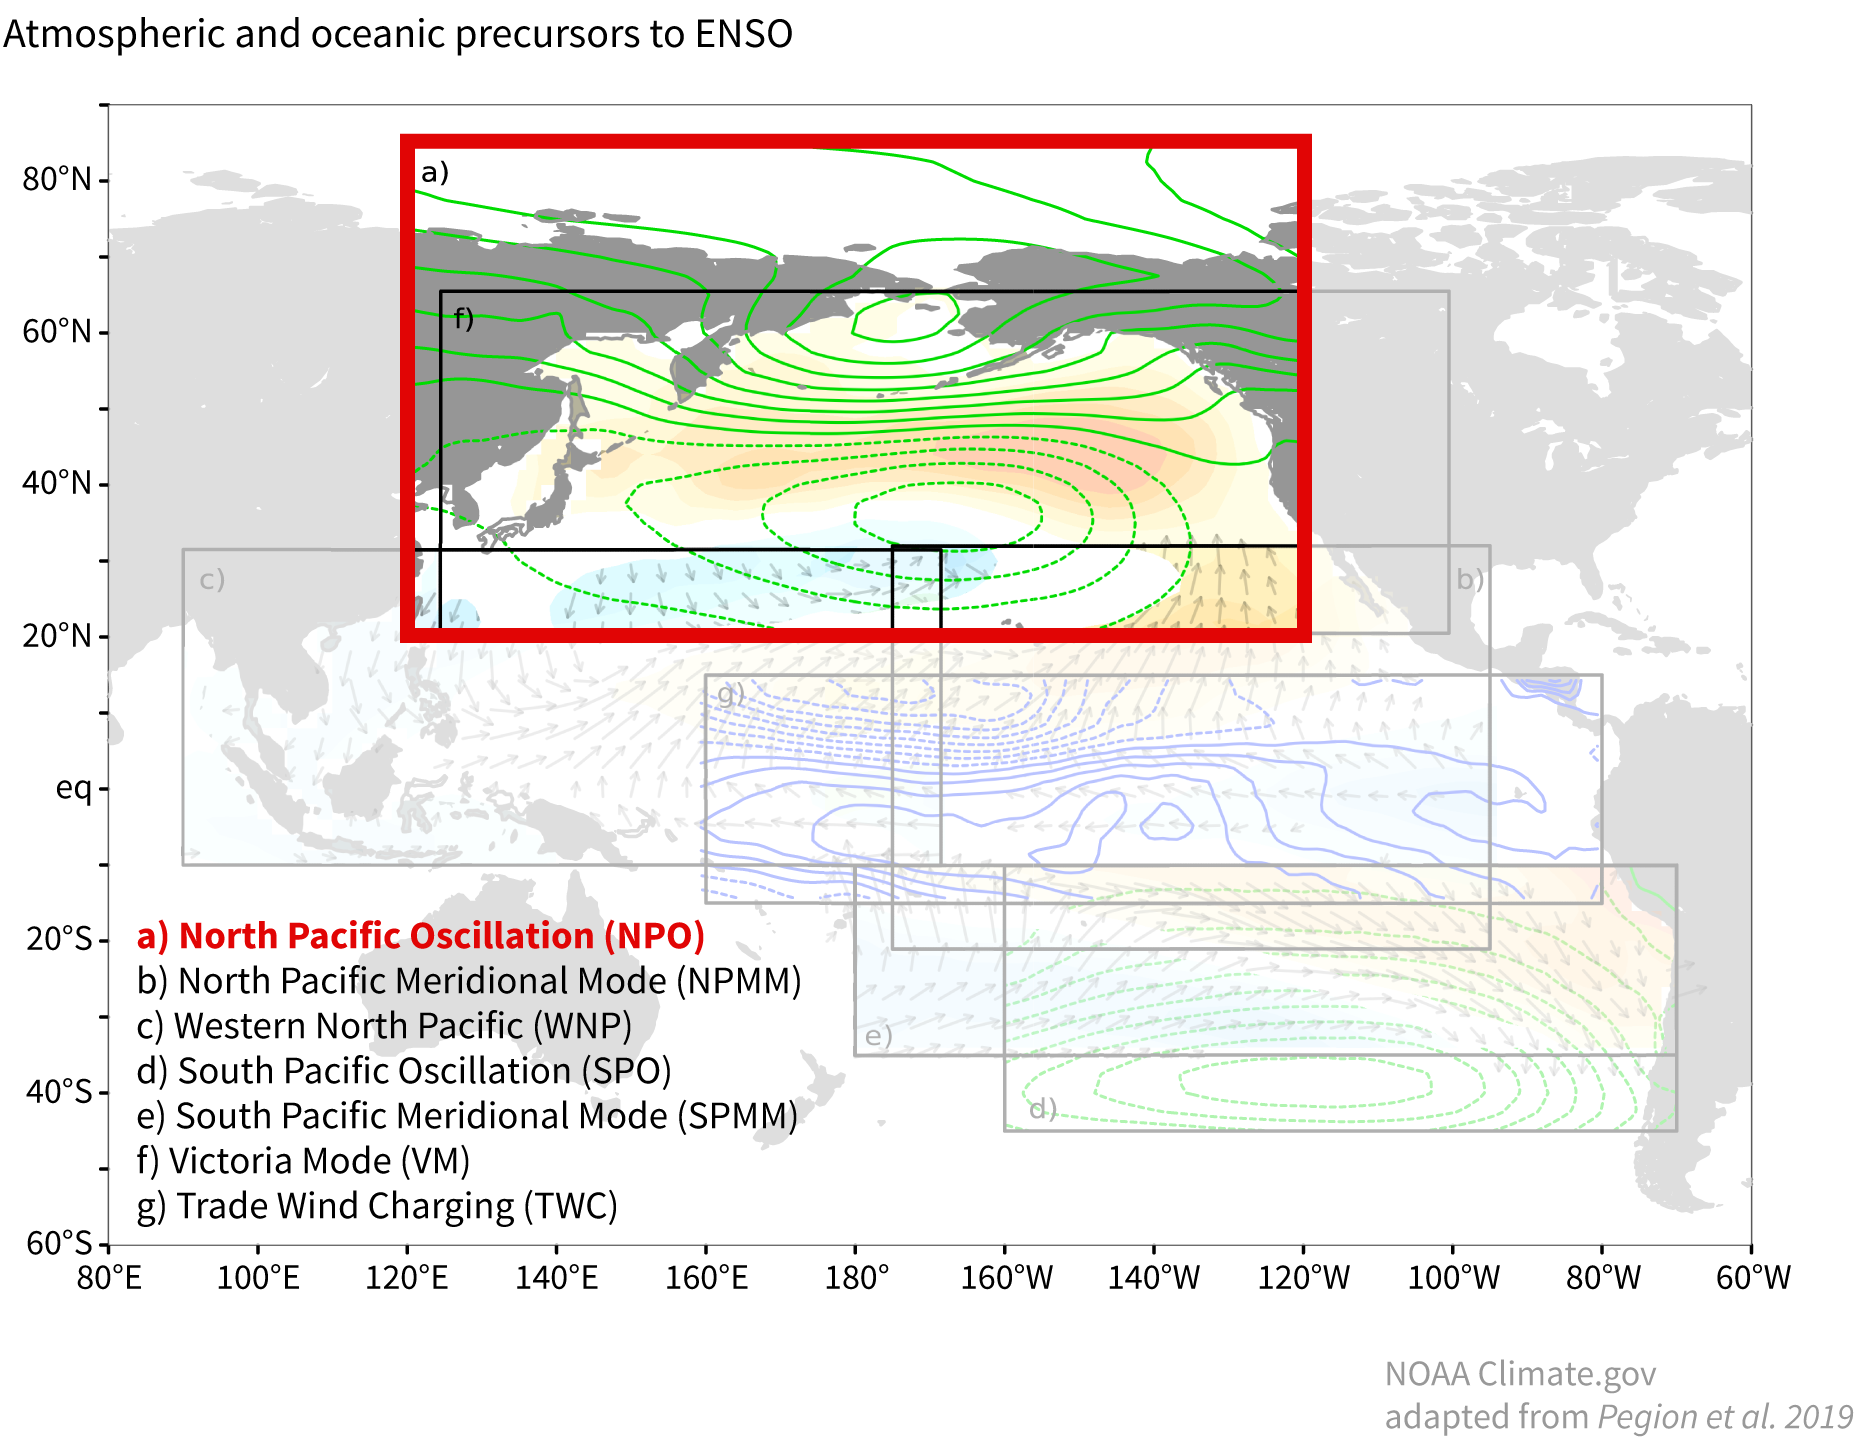 [North Pacific Oscillation pattern in sea level pressure. Green solid lines show higher-than-average sea level pressure; dotted green lines show lower-than-average sea level pressure. Figure by NOAA Climate based on original by Kathy Pegion.]
The North Pacific Oscillation (NPO) doesn’t act alone. Other precursor patterns help link the weakening of the subtropical high to the slowing of the trade winds. You may remember your brief fling with the Pacific Meridional Mode (re-branded for our purposes here as the North Pacific Meridional Mode). This pattern shows up in the eastern Pacific as warmer-than-average surface water north of the equator and cooler-than-average water south of the equator. The weaker trades of the NPO encourage the warmer ocean surface on the north side of the equator, which in turn helps to reinforce the weakening of the trades. For more on this complicated dance, check out Dan Vimont’s post.
The Victoria Mode and Trade Wind Charging also link the NPO to the equatorial region and thereby to ENSO development. The signature of the Victoria Mode is cooler-than-average surface water and related weaker trades in the western North Pacific. The cooler western Pacific signature of the Victoria Mode develops in tandem with the NPO circulation.
“Trade Wind Charging” is the mechanism linking the changes in trade winds to increased subsurface water temperature. Its signature is reduced wind stress—the force on the surface that is caused by the wind—in the eastern Pacific, and increased wind stress in the western Pacific. The changes in wind stress are what help to kick off downwelling Kelvin waves, which increase the subsurface temperature. This source of warmer water is necessary for a developing El Niño.
[North Pacific Oscillation pattern in sea level pressure. Green solid lines show higher-than-average sea level pressure; dotted green lines show lower-than-average sea level pressure. Figure by NOAA Climate based on original by Kathy Pegion.]
The North Pacific Oscillation (NPO) doesn’t act alone. Other precursor patterns help link the weakening of the subtropical high to the slowing of the trade winds. You may remember your brief fling with the Pacific Meridional Mode (re-branded for our purposes here as the North Pacific Meridional Mode). This pattern shows up in the eastern Pacific as warmer-than-average surface water north of the equator and cooler-than-average water south of the equator. The weaker trades of the NPO encourage the warmer ocean surface on the north side of the equator, which in turn helps to reinforce the weakening of the trades. For more on this complicated dance, check out Dan Vimont’s post.
The Victoria Mode and Trade Wind Charging also link the NPO to the equatorial region and thereby to ENSO development. The signature of the Victoria Mode is cooler-than-average surface water and related weaker trades in the western North Pacific. The cooler western Pacific signature of the Victoria Mode develops in tandem with the NPO circulation.
“Trade Wind Charging” is the mechanism linking the changes in trade winds to increased subsurface water temperature. Its signature is reduced wind stress—the force on the surface that is caused by the wind—in the eastern Pacific, and increased wind stress in the western Pacific. The changes in wind stress are what help to kick off downwelling Kelvin waves, which increase the subsurface temperature. This source of warmer water is necessary for a developing El Niño.
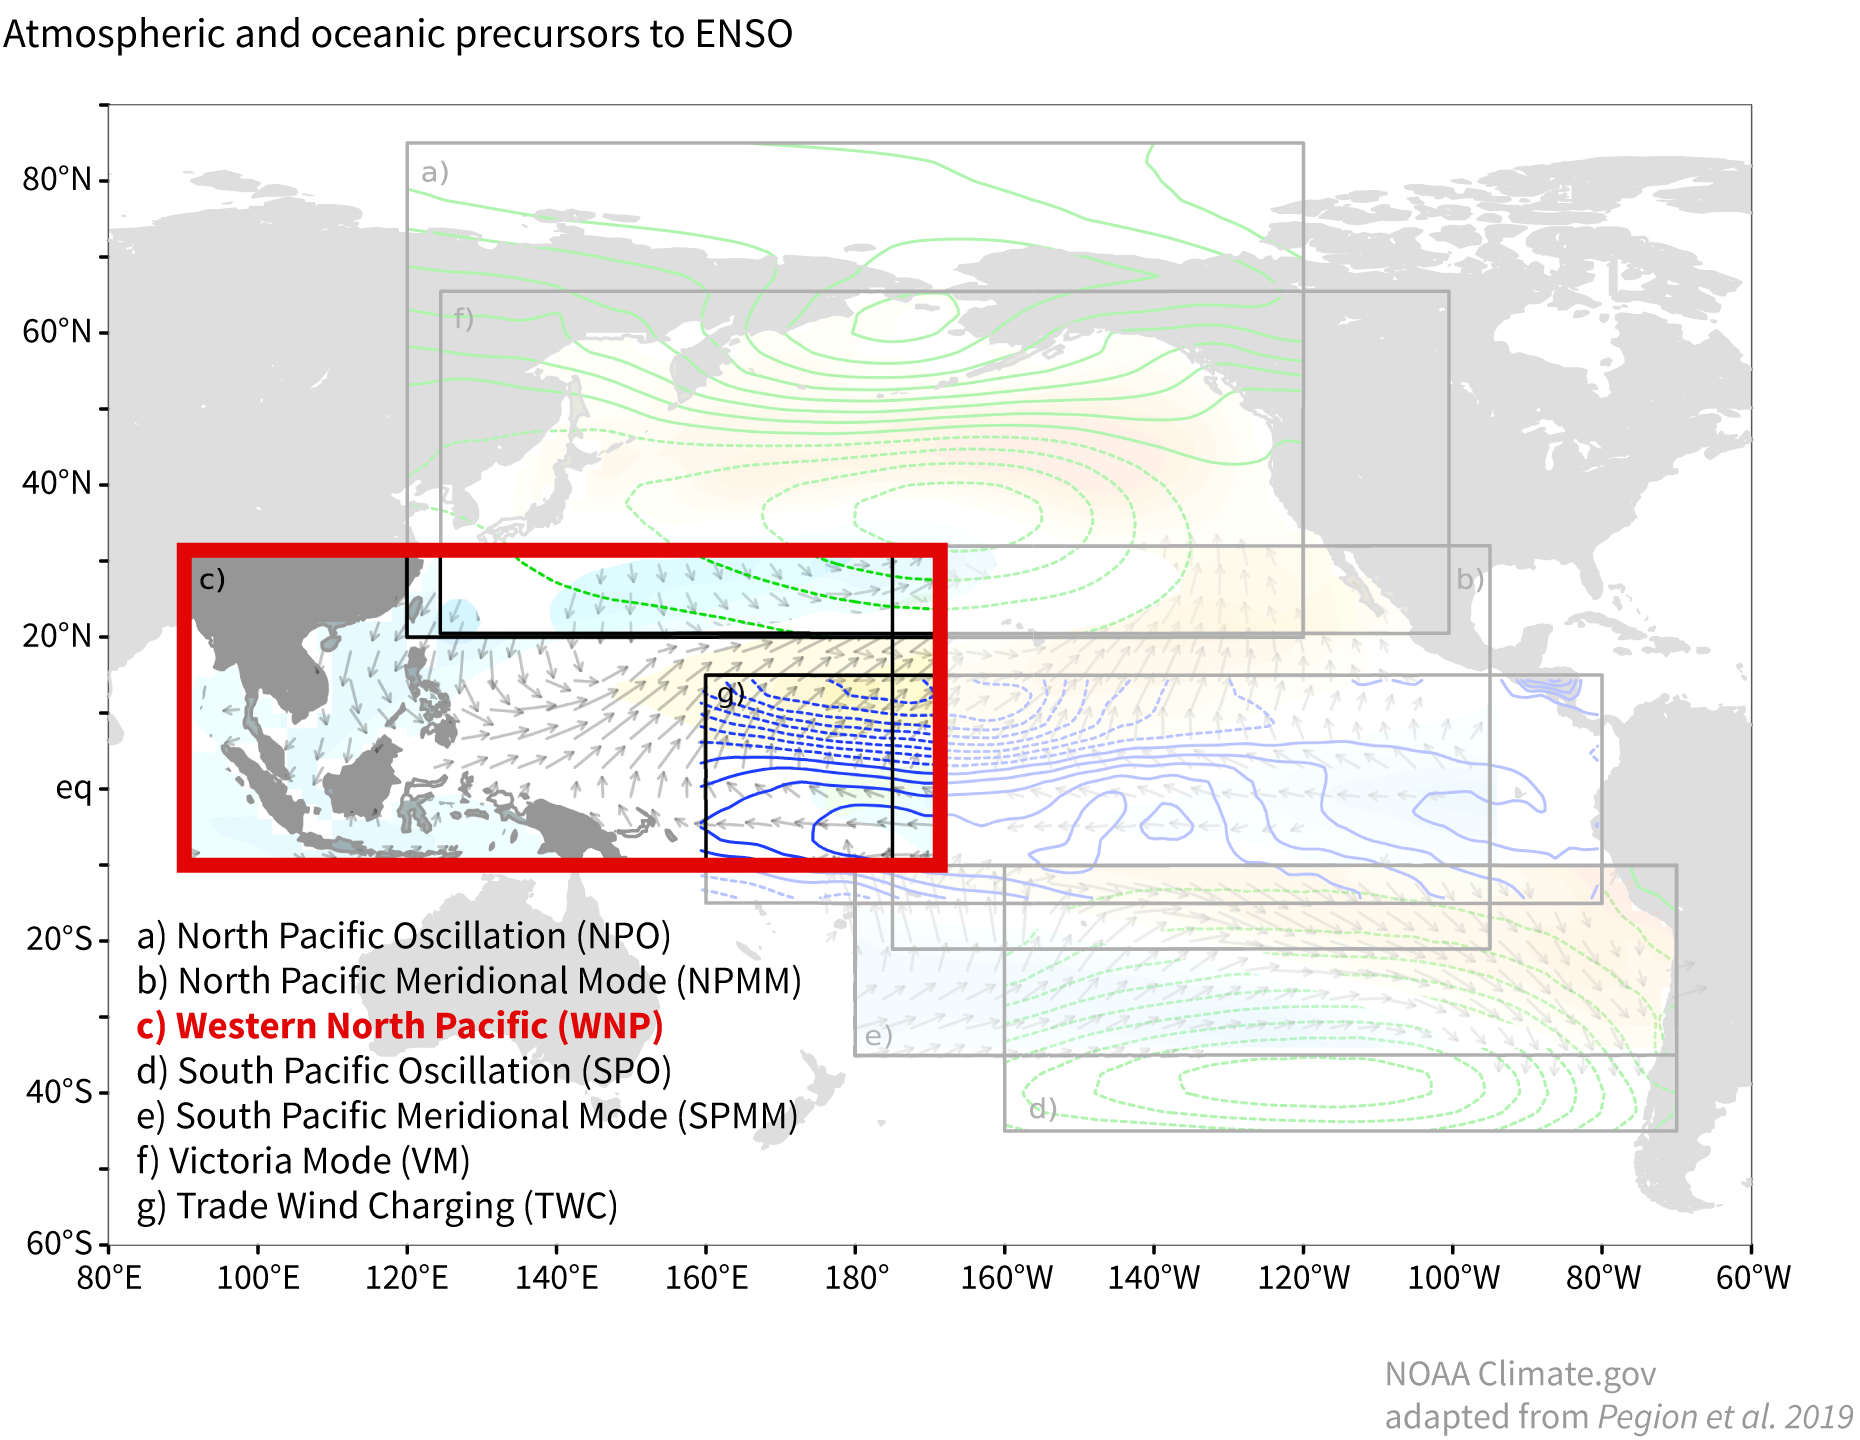 [Western North Pacific pattern. Shaded colors show sea surface temperature (reds = warmer than average, blues = cooler) and arrows show wind direction. Figure by NOAA Climate based on original by Kathy Pegion.]
Not directly related to the NPO is the Western North Pacific pattern. The signature of this pattern is cooler-than-average water off the coast of China and warmer water in the central equatorial Pacific in the winter. This leads to slower trades and lower wind stress on the surface of the western equatorial Pacific, inducing downwelling Kelvin waves and increasing subsurface heat content. Research has found this pattern can precede the development of El Niño by a full year.
In the Southern Hemisphere, we have the South Pacific Oscillation and the South Pacific Meridional Mode. (Hey, we can’t all have catchy names like The Blob.) Whereas the northern precursors I described above are most useful during December–February, the southern ones are most active during June–August, winter in the Southern Hemisphere. Like its North Pacific counterpart, the South Pacific Oscillation is a change in sea level pressure, leading to a reduction in the trade winds. And, also like its northern sibling, the South Pacific Meridional Mode appears as warmer-than-average water to the south of the equator, and helps to link the trade wind changes of the South Pacific Oscillation to the equatorial winds.
[Western North Pacific pattern. Shaded colors show sea surface temperature (reds = warmer than average, blues = cooler) and arrows show wind direction. Figure by NOAA Climate based on original by Kathy Pegion.]
Not directly related to the NPO is the Western North Pacific pattern. The signature of this pattern is cooler-than-average water off the coast of China and warmer water in the central equatorial Pacific in the winter. This leads to slower trades and lower wind stress on the surface of the western equatorial Pacific, inducing downwelling Kelvin waves and increasing subsurface heat content. Research has found this pattern can precede the development of El Niño by a full year.
In the Southern Hemisphere, we have the South Pacific Oscillation and the South Pacific Meridional Mode. (Hey, we can’t all have catchy names like The Blob.) Whereas the northern precursors I described above are most useful during December–February, the southern ones are most active during June–August, winter in the Southern Hemisphere. Like its North Pacific counterpart, the South Pacific Oscillation is a change in sea level pressure, leading to a reduction in the trade winds. And, also like its northern sibling, the South Pacific Meridional Mode appears as warmer-than-average water to the south of the equator, and helps to link the trade wind changes of the South Pacific Oscillation to the equatorial winds.
on safari developing outlooks for ENSO.
The tiger’s stripes
Around the tropics, climate patterns can be identified in several different ways. They can include changes in the ocean surface temperature and/or some change in the atmospheric circulation. Atmospheric circulation changes can be detected in air pressure, wind direction/strength, rainfall, and other indicators. Many are called “oscillations,” which in weather and climate science means a see-saw between two locations—also called a dipole—on an irregular time interval. Dozens, probably hundreds, of scientific papers have been written about identifying ENSO precursor patterns, how they might affect ENSO, and how they interact with each other. And, of course, the complexity of the ocean/atmosphere system is such that all these patterns are entangled, with interactions that we are only just beginning to understand. Add climate change on top—suffice to say, this post is just scratching the surface!
[Animation showing seven ENSO precursor patterns. Shaded colors show sea surface temperature (reds = warmer than average, blues = cooler), green lines show sea level pressure (solid = stronger than average, dotted = weaker), arrows show wind direction, and blue lines show wind stress, the force exerted on the water surface by the wind (solid = more than average, dotted = less). Figure by Kathy Pegion, animation by NOAA Climate]
The tiger’s stripes
Around the tropics, climate patterns can be identified in several different ways. They can include changes in the ocean surface temperature and/or some change in the atmospheric circulation. Atmospheric circulation changes can be detected in air pressure, wind direction/strength, rainfall, and other indicators. Many are called “oscillations,” which in weather and climate science means a see-saw between two locations—also called a dipole—on an irregular time interval. Dozens, probably hundreds, of scientific papers have been written about identifying ENSO precursor patterns, how they might affect ENSO, and how they interact with each other. And, of course, the complexity of the ocean/atmosphere system is such that all these patterns are entangled, with interactions that we are only just beginning to understand. Add climate change on top—suffice to say, this post is just scratching the surface!
[North Pacific Oscillation pattern in sea level pressure. Green solid lines show higher-than-average sea level pressure; dotted green lines show lower-than-average sea level pressure. Figure by NOAA Climate based on original by Kathy Pegion.]
The North Pacific Oscillation (NPO) doesn’t act alone. Other precursor patterns help link the weakening of the subtropical high to the slowing of the trade winds. You may remember your brief fling with the Pacific Meridional Mode (re-branded for our purposes here as the North Pacific Meridional Mode). This pattern shows up in the eastern Pacific as warmer-than-average surface water north of the equator and cooler-than-average water south of the equator. The weaker trades of the NPO encourage the warmer ocean surface on the north side of the equator, which in turn helps to reinforce the weakening of the trades. For more on this complicated dance, check out Dan Vimont’s post.
The Victoria Mode and Trade Wind Charging also link the NPO to the equatorial region and thereby to ENSO development. The signature of the Victoria Mode is cooler-than-average surface water and related weaker trades in the western North Pacific. The cooler western Pacific signature of the Victoria Mode develops in tandem with the NPO circulation.
“Trade Wind Charging” is the mechanism linking the changes in trade winds to increased subsurface water temperature. Its signature is reduced wind stress—the force on the surface that is caused by the wind—in the eastern Pacific, and increased wind stress in the western Pacific. The changes in wind stress are what help to kick off downwelling Kelvin waves, which increase the subsurface temperature. This source of warmer water is necessary for a developing El Niño.
[Western North Pacific pattern. Shaded colors show sea surface temperature (reds = warmer than average, blues = cooler) and arrows show wind direction. Figure by NOAA Climate based on original by Kathy Pegion.]
Not directly related to the NPO is the Western North Pacific pattern. The signature of this pattern is cooler-than-average water off the coast of China and warmer water in the central equatorial Pacific in the winter. This leads to slower trades and lower wind stress on the surface of the western equatorial Pacific, inducing downwelling Kelvin waves and increasing subsurface heat content. Research has found this pattern can precede the development of El Niño by a full year.
In the Southern Hemisphere, we have the South Pacific Oscillation and the South Pacific Meridional Mode. (Hey, we can’t all have catchy names like The Blob.) Whereas the northern precursors I described above are most useful during December–February, the southern ones are most active during June–August, winter in the Southern Hemisphere. Like its North Pacific counterpart, the South Pacific Oscillation is a change in sea level pressure, leading to a reduction in the trade winds. And, also like its northern sibling, the South Pacific Meridional Mode appears as warmer-than-average water to the south of the equator, and helps to link the trade wind changes of the South Pacific Oscillation to the equatorial winds.
[South Pacific Oscillation. Green lines show sea level pressure (solid = stronger than average, dotted = weaker). Figure by climate.gov based on original by Kathy Pegion.]
Chimera
In case you can’t tell from the maps, all these patterns overlap and influence each other, as well as providing clues to the development of ENSO. Also, some have alternate names, or have been identified differently by different researchers, and I’m sure if I were to write this post ten years into the future it would be a different animal. Regardless, now you have an idea of some of the many patterns forecasters keep an eye on whenAll Weather News
More
East Gears Up for Stormy, Wet Weekend
A low pressure system crashing through the Mi
1 Aug 2026 11:35 AM

Flooding, Severe Storms Target the Midwest Again
After an active week of storms across the nor
1 Aug 2026 1:40 AM


After Reaching Category 5, Genevieve Weakens in the Pacific
PacificFausto is now a post-tropical cyclone.
31 Jul 2026 1:30 AM

Flooding Risk Increases as Heavy Rain Targets the Tri-State Area
Tuesday, heavy rainfall moved across the Nort
30 Jul 2026 12:25 AM

Severe Weather: Energy From the Midwest Now in the Southeast
UPPER MIDWEST - Through Monday, dangerous tor
29 Jul 2026 10:30 PM