When the Average Temperature Misses the Mark
Special Stories
3 May 2018 11:56 AM
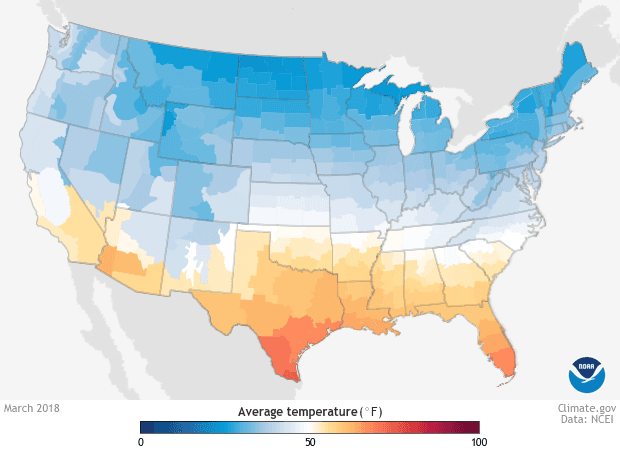
[Average temperature in March 2018 for the contiguous United States. Most of the country is colored in shades of blue, indicating average temperatures below 50°F. NOAA Climate map, based on climate division data from NCEI.]
From NOAA by Jake Crouch
We are all familiar with average temperature. The climate stat is one of the most used datasets provided at the National Centers for Environmental Information (NCEI). The average temperature data for locations on land have been collected for centuries by the military, automated systems at airports and even volunteers. You will often see these numbers used on how the day compared to normal.
These maps work great for a lot of purposes, including highlighting how a month or season compared to average or how temperatures are changing with time, but sometimes they wash out important details. To capture some of these details, we have a lesser known way to utilize daily average temperature: heating and cooling degree-days.
Before we go further, let’s talk about terminology. A degree-day is, obviously, different from a real day. Generically speaking, it’s the number of degrees above or below a specific temperature threshold times the number of days the anomaly lasted. Degrees times days=degree-days. These values are added up over the course of a month, season, or year. The threshold temperature is subjective. The most common kind of degree-day calculation is based on thresholds that are relevant to indoor heating and cooling.
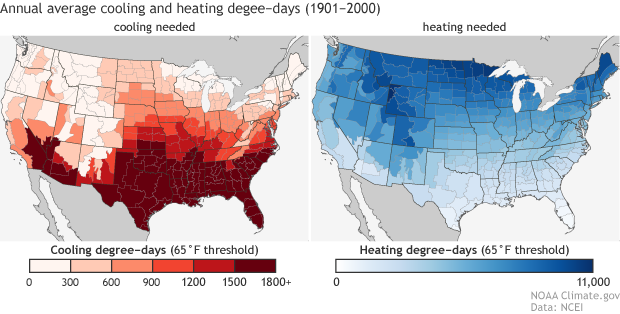 [Average annual cooling (left) and heating (right) degree-days in the contiguous United States from 1901-2000. For the U.S. analysis, a degree-day is equivalent to one day with an average temperature that is one degree above or below 65° F. Maps by NOAA Climate, based on NCEI data provided by Jake Crouch]
The nation as a whole experiences many more heating degree-days compared to cooling degree-days, but that isn’t not the case for every location. This would mean that according to historical temperature data, Americans tend to use more energy to heat their homes than to cool their homes.
To calculate the heating and cooling degree-days in the U.S., once we know the daily average temperature for a location, we subtract it from 65˚F. For example, if the daily average temperature is 70˚F, the cooling degree-days would be 5˚F (65˚F-70˚F=|-5˚F|). If the value is negative, we take the absolute value, and then sum the heating and cooling degree-days for each day in a month to determine the monthly value.
[Average annual cooling (left) and heating (right) degree-days in the contiguous United States from 1901-2000. For the U.S. analysis, a degree-day is equivalent to one day with an average temperature that is one degree above or below 65° F. Maps by NOAA Climate, based on NCEI data provided by Jake Crouch]
The nation as a whole experiences many more heating degree-days compared to cooling degree-days, but that isn’t not the case for every location. This would mean that according to historical temperature data, Americans tend to use more energy to heat their homes than to cool their homes.
To calculate the heating and cooling degree-days in the U.S., once we know the daily average temperature for a location, we subtract it from 65˚F. For example, if the daily average temperature is 70˚F, the cooling degree-days would be 5˚F (65˚F-70˚F=|-5˚F|). If the value is negative, we take the absolute value, and then sum the heating and cooling degree-days for each day in a month to determine the monthly value.
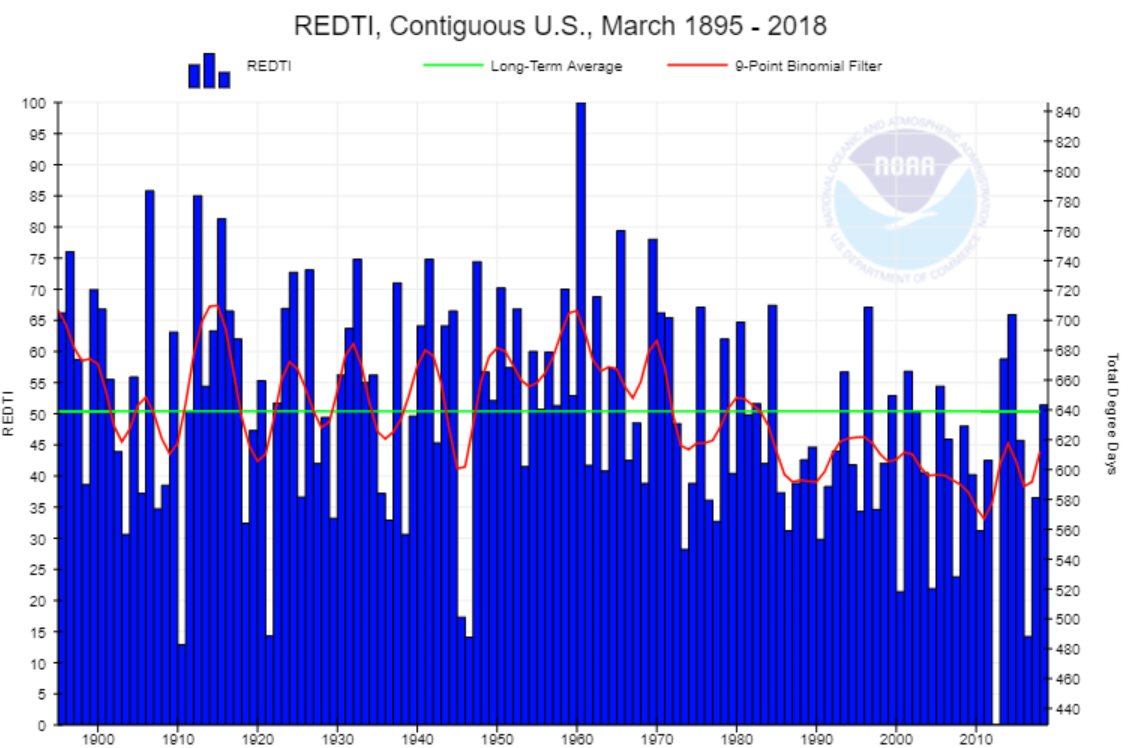 [Residential Energy Demand Index. From NCEI]
The population-weighted data provides additional insights and better approximations of energy usage by taking into account where more people (and buildings) are located. One of the ways we do this at NCEI is calculating the Residential Energy Demand Temperature Index. Heating and cooling degree-days can also be used to forecast commodity prices, like the cost of home heating oil, and can be an important input for energy traders.
[Residential Energy Demand Index. From NCEI]
The population-weighted data provides additional insights and better approximations of energy usage by taking into account where more people (and buildings) are located. One of the ways we do this at NCEI is calculating the Residential Energy Demand Temperature Index. Heating and cooling degree-days can also be used to forecast commodity prices, like the cost of home heating oil, and can be an important input for energy traders.
 [A peach orchard in full bloom on March 26, 2015, in Spartanburg County, South Carolina. Early flowering in fruit trees due to unusually high numbers of cooling-degree days (or unusually low numbers of heating-degree days) can bring flowers out too early, making an entire crop vulnerable to late season wintry weather. Image by Martin LeBar, used under a Creative Commons license.]
Setting a new target
Heating and cooling degree-days (which you will often see abbreviated to HDD and CDD) were developed to better understand the relationship between temperature conditions and energy usage, particularly how much energy is used to heat or cool buildings including homes and offices. In the U.S., the base temperature of 65˚F is typically used since it relates well to most climate conditions across the nation. In some instances other base temperatures are used to understand other phenomenon or better represent different climates. For example, in the European Union a temperature of 60˚F is used.
[Average annual cooling (left) and heating (right) degree-days in the contiguous United States from 1901-2000. For the U.S. analysis, a degree-day is equivalent to one day with an average temperature that is one degree above or below 65° F. Maps by NOAA Climate, based on NCEI data provided by Jake Crouch]
The nation as a whole experiences many more heating degree-days compared to cooling degree-days, but that isn’t not the case for every location. This would mean that according to historical temperature data, Americans tend to use more energy to heat their homes than to cool their homes.
To calculate the heating and cooling degree-days in the U.S., once we know the daily average temperature for a location, we subtract it from 65˚F. For example, if the daily average temperature is 70˚F, the cooling degree-days would be 5˚F (65˚F-70˚F=|-5˚F|). If the value is negative, we take the absolute value, and then sum the heating and cooling degree-days for each day in a month to determine the monthly value.
Tuning your thermostat
The assumption is that if the daily average temperature is above 65˚F, energy will be required to cool a building and the warmer the temperature, additional energy will be required. So if the daily average temperature is 80˚F, more energy would be required to cool buildings compared to if the daily average temperature was 66˚F. The same is true on the other side with the amount of heat required to warm buildings during the colder parts of the year. While this assumption doesn’t hold up in every single case, it does provide a good approximation. Heating and cooling degree-days can also be used in conjunction with population data. Let’s use New York City as an example, if the temperature is really warm in the city, there are a lot more buildings to cool with more energy used compared to if the same warm temperatures were experienced in a sparsely populated region in eastern Montana.
[Residential Energy Demand Index. From NCEI]
The population-weighted data provides additional insights and better approximations of energy usage by taking into account where more people (and buildings) are located. One of the ways we do this at NCEI is calculating the Residential Energy Demand Temperature Index. Heating and cooling degree-days can also be used to forecast commodity prices, like the cost of home heating oil, and can be an important input for energy traders.
Hunting for the ideal conditions
Heating and cooling degree-days are also important for understanding temperature impacts on agriculture -- heating degree-days quantify if winter temperatures were cool enough, while cooling degree-days help to quantify vulnerability to damaging spring freezes. Many blooming trees and bushes that provide fruit, like apple and peach trees, require a certain number of hours with temperature below a certain threshold during the cold season to produce fruit during the following spring and summer. Accumulated heating degree-days during the cold season can be used as a proxy to understand if the temperatures were sufficiently cold enough to maximize fruit production. If there were fewer than normal heating degree-days (i.e. fewer than normal days when indoor heating would have been necessary), that indicates a mild winter--possibly so mild that crops’ “chilling period” wasn’t met. Cooling degree-days can be used to help understand the vulnerability of crops to a spring freeze. If a region experiences a certain number of cooling degree-days during the winter, it can indicate that fruit trees in a region might be susceptible to a damaging freeze. An example of this was in the early spring of 2017, when a March freeze caused over $1 billion in damages following a very warm February in the Southeast. In this particular case, there were an above-average number of cooling degree-days accumulated before the last freeze, indicating that temperatures were sometimes warm enough to have required indoor cooling. Under these conditions, fruit developed too early in the year, before the threat of a damaging freeze had passed.
[A peach orchard in full bloom on March 26, 2015, in Spartanburg County, South Carolina. Early flowering in fruit trees due to unusually high numbers of cooling-degree days (or unusually low numbers of heating-degree days) can bring flowers out too early, making an entire crop vulnerable to late season wintry weather. Image by Martin LeBar, used under a Creative Commons license.]
A moving target
When you use average temperature data for a month, you can sometimes under-represent any warm or cool periods that only persisted for a few days – a week with an above average temperature will be averaged out by a week of below average temperatures and show a near-average temperature. If there was a really cold week in March, but the rest of the month was warmer than average, the days when it was cold, heating degree-days would have accumulated. Since we add the heating degree-days for each day of the month, but average the daily temperatures, monthly heating degree-days and average temperature data tell us different things. Let’s take for example where I live in Asheville, North Carolina. April 2018 has been marked by extreme swings in temperature, as it has for much of the nation. On April 14th, the daily average temperature was 65˚F with an afternoon high temperature of 77˚F. Plants in my yard were blooming and I had to take allergy medicine. Two days later the daily average temperature was 40˚F with snow, which required me to turn on the heat in my house. While the average temperature for the month might average out to near-normal, having to use my heat this late in April was not normal. The heating degree-days accumulated for April would better reflect these day-to-day swings in temperature than just looking at the April average temperature. The use of average temperatures, whether on the daily, monthly or annual timescale can provide numerous insights into our climate system and other systems that our nation relies on. Heating and cooling degree-days were developed to help glean additional information from temperature and how it impacts our world, including energy usage and agriculture. While there are some assumptions that have to be made about both ways of examining temperature, when using them together we can better understand the connection between weather, climate, and their impact on our society. Edited for WeatherNation by Meteorologist Mace MichaelsAll Weather News
More
Fronts Continue To Spark Severe Weather Across the Plains
A cold front that brought record lows to the
18 Jul 2025 10:40 PM

Extreme Heat Impacts for the East Coast & South
Extreme heat continues to impact several area
18 Jul 2025 10:05 PM

Flooding Threat Remains Elevated in the East
A cold front pushing through the Eastern Seab
18 Jul 2025 9:10 PM

EF-2 Firenado from the Deer Creek Fire in Utah
A fire tornado was spotted near La Sal, Utah
18 Jul 2025 7:30 AM

Tropical System Brings Flood Risk to the Central Gulf
Time has run out for notable tropical develop
18 Jul 2025 3:05 AM

Heavy Rain, Flooding Threat Returns to Florida
Keep the rain boots handy in Florida - heavy
13 Jul 2025 12:50 PM

Severe Storm Risk Pushes into the Great Lakes, Ohio Valley
Friday was another busy day with severe weath
12 Jul 2025 8:00 PM