El Nino Mash-Up: What’s the Best Way to Combine Human Expertise with Forecast Models?
Special Stories
8 Jul 2019 2:05 AM
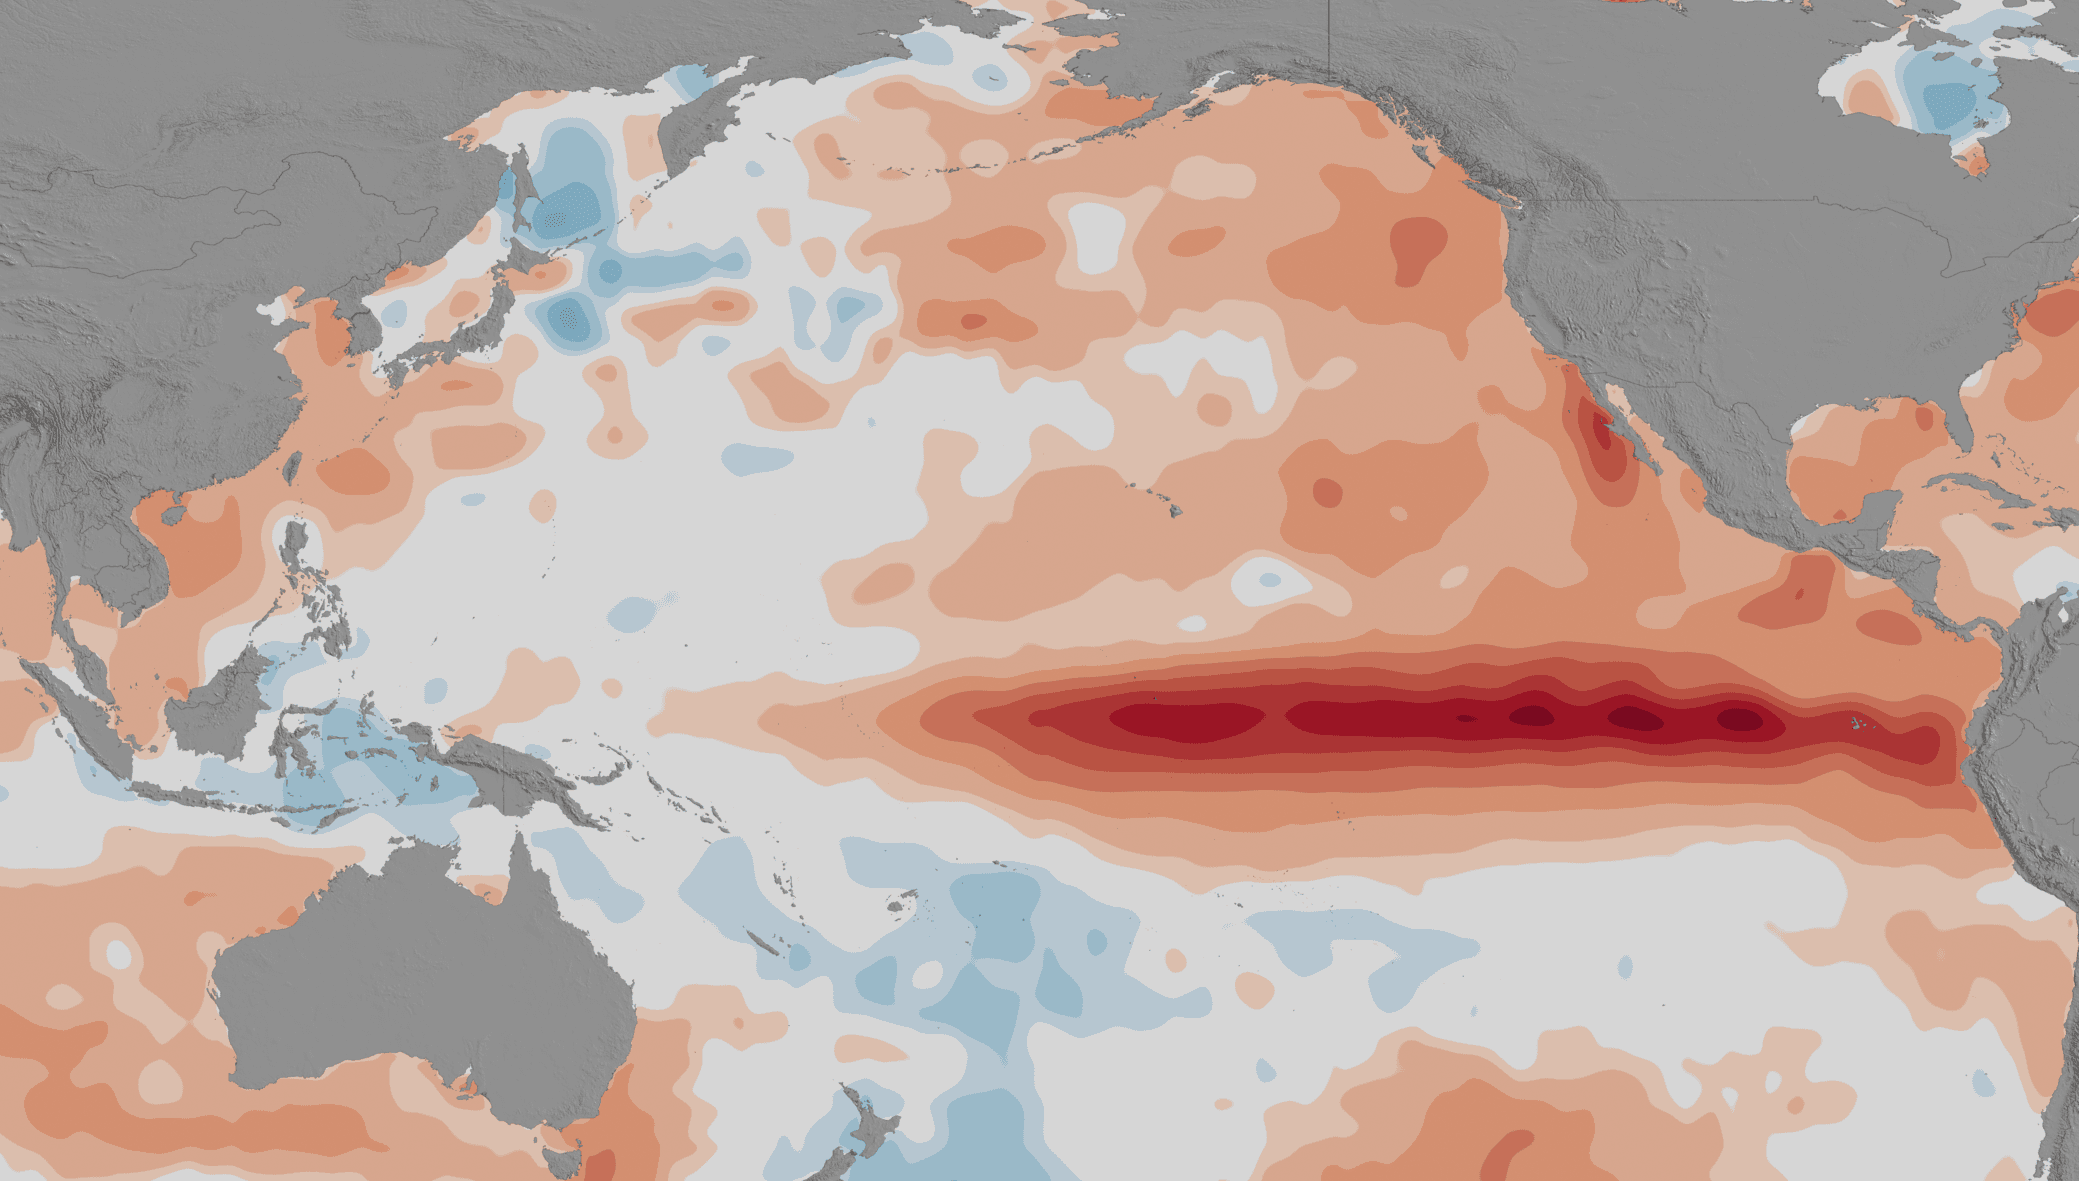
[Increased sea surface temperatures in the equatorial Pacific Ocean in 2015 characterizes an El Niño (darkest red colors), which is followed by weather changes throughout the world. Credit: NASA Goddard’s Scientific Visualization Studio]
[NOAA by Tom Di Liberto] As meteorologists and climate scientists, we talk about, think about, and commiserate about forecasts a lot. One enhancement that NOAA’s ENSO (La Nina and El Nino) forecasting team has been working toward is the prediction of the strength of an El Niño or La Nina event. Judging by the comments left on social media or under our articles, that’s something you want from us too.
It was with that in mind that the NOAA ENSO blog’s own Michelle L’Heureux and colleagues set up an experiment for the ENSO forecasting team. She documents the results in a recent journal article (which I am seventh author on (1)). The experiment demonstrated that skillful strength forecasts were feasible, and also something else. It also revealed how we human forecasters can be too conservative—and how wrong certain computer models are at times. Luckily, this experiment identifies a new, more skillful way to mash up model intel with human expertise and intuition. How nice is that?!
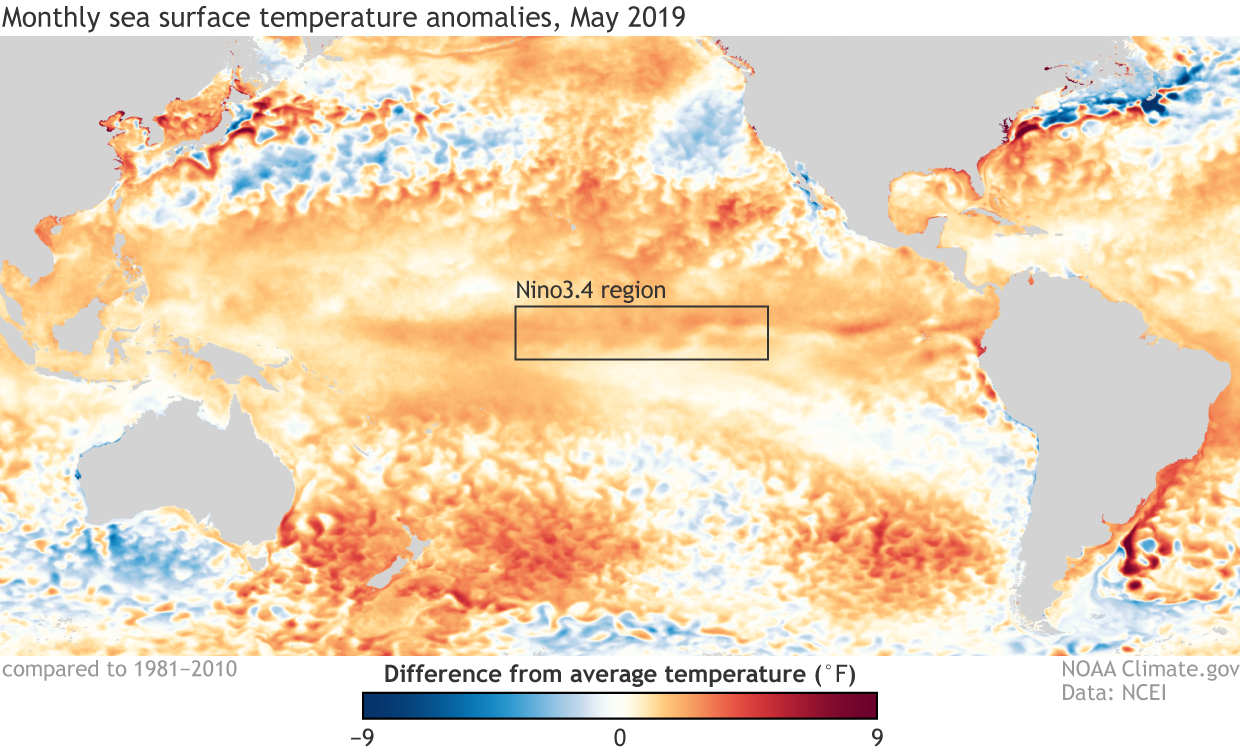 [Sea surface temperature in May 2019 compared to the 1981-2010 average. A recent experiment tested strategies for predicting the monthly difference from average temperature in the heart of ENSO territory—the Nino 3.4 region of the tropical Pacific. NOAA Climate image using data from NCEI.]
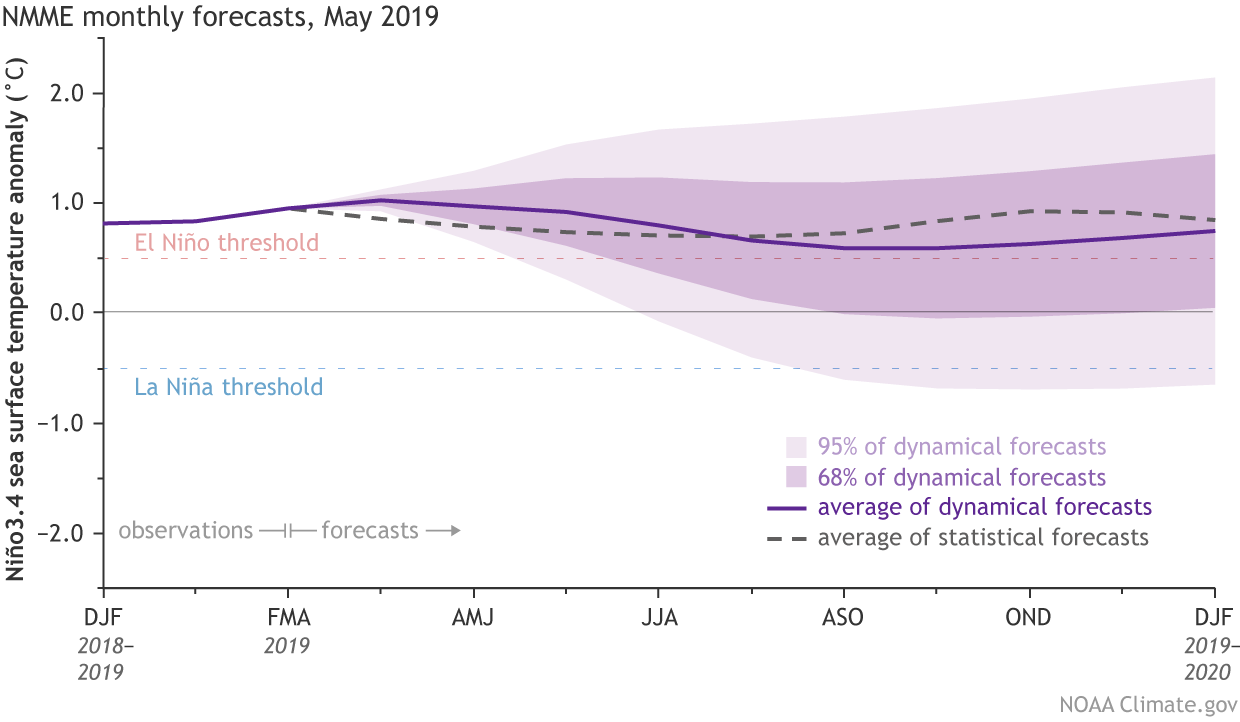 [Model forecasts for the Niño3.4 index. Dynamical model average (purple line) from the North American Multi-Model Ensemble (NMME). Statistical model average (dashed line) from CPC’s Consolidated SST Forecasts. Shading shows the range of forecasts: 95% are within the lighter shading, and 68% are within the darker shading. NOAA Climate image from CPC data.]
Instead, Michelle asked all of the ENSO forecasters to make a single addition to their forecasts: predict the monthly SST anomaly in the Niño3.4 region. Instead of having the forecasters come up with uncertainty estimates, she derived them from statistical information provided by observations and models (2): how much a given month’s SST has historically varied, and how well model forecasts have historically performed for a given time of year.
The beauty of this method is that it allows us to forecast the probability of SST anomalies being greater or less than any number, not just the 0.5°C and -0.5°C thresholds used for determining El Niño and La Niña. This means we can issue probabilities for different strengths of La Niña and El Niño for any new category; for example, El Niño strength between 1.0°C and 1.5°C.
This also means that humans wouldn’t have to forecast multiple probabilities. Instead, we’d have to forecast only one number for the upcoming seasons. That makes life easier. As it turns out, it also makes the forecasts better.
[Model forecasts for the Niño3.4 index. Dynamical model average (purple line) from the North American Multi-Model Ensemble (NMME). Statistical model average (dashed line) from CPC’s Consolidated SST Forecasts. Shading shows the range of forecasts: 95% are within the lighter shading, and 68% are within the darker shading. NOAA Climate image from CPC data.]
Instead, Michelle asked all of the ENSO forecasters to make a single addition to their forecasts: predict the monthly SST anomaly in the Niño3.4 region. Instead of having the forecasters come up with uncertainty estimates, she derived them from statistical information provided by observations and models (2): how much a given month’s SST has historically varied, and how well model forecasts have historically performed for a given time of year.
The beauty of this method is that it allows us to forecast the probability of SST anomalies being greater or less than any number, not just the 0.5°C and -0.5°C thresholds used for determining El Niño and La Niña. This means we can issue probabilities for different strengths of La Niña and El Niño for any new category; for example, El Niño strength between 1.0°C and 1.5°C.
This also means that humans wouldn’t have to forecast multiple probabilities. Instead, we’d have to forecast only one number for the upcoming seasons. That makes life easier. As it turns out, it also makes the forecasts better.
our machine overlords climate models already give us strength forecasts. We could always just use those. And it would be worse than pointless if the new method was less skillful than the current approach. So, how did the experimental method perform? Here’s where things get interesting.
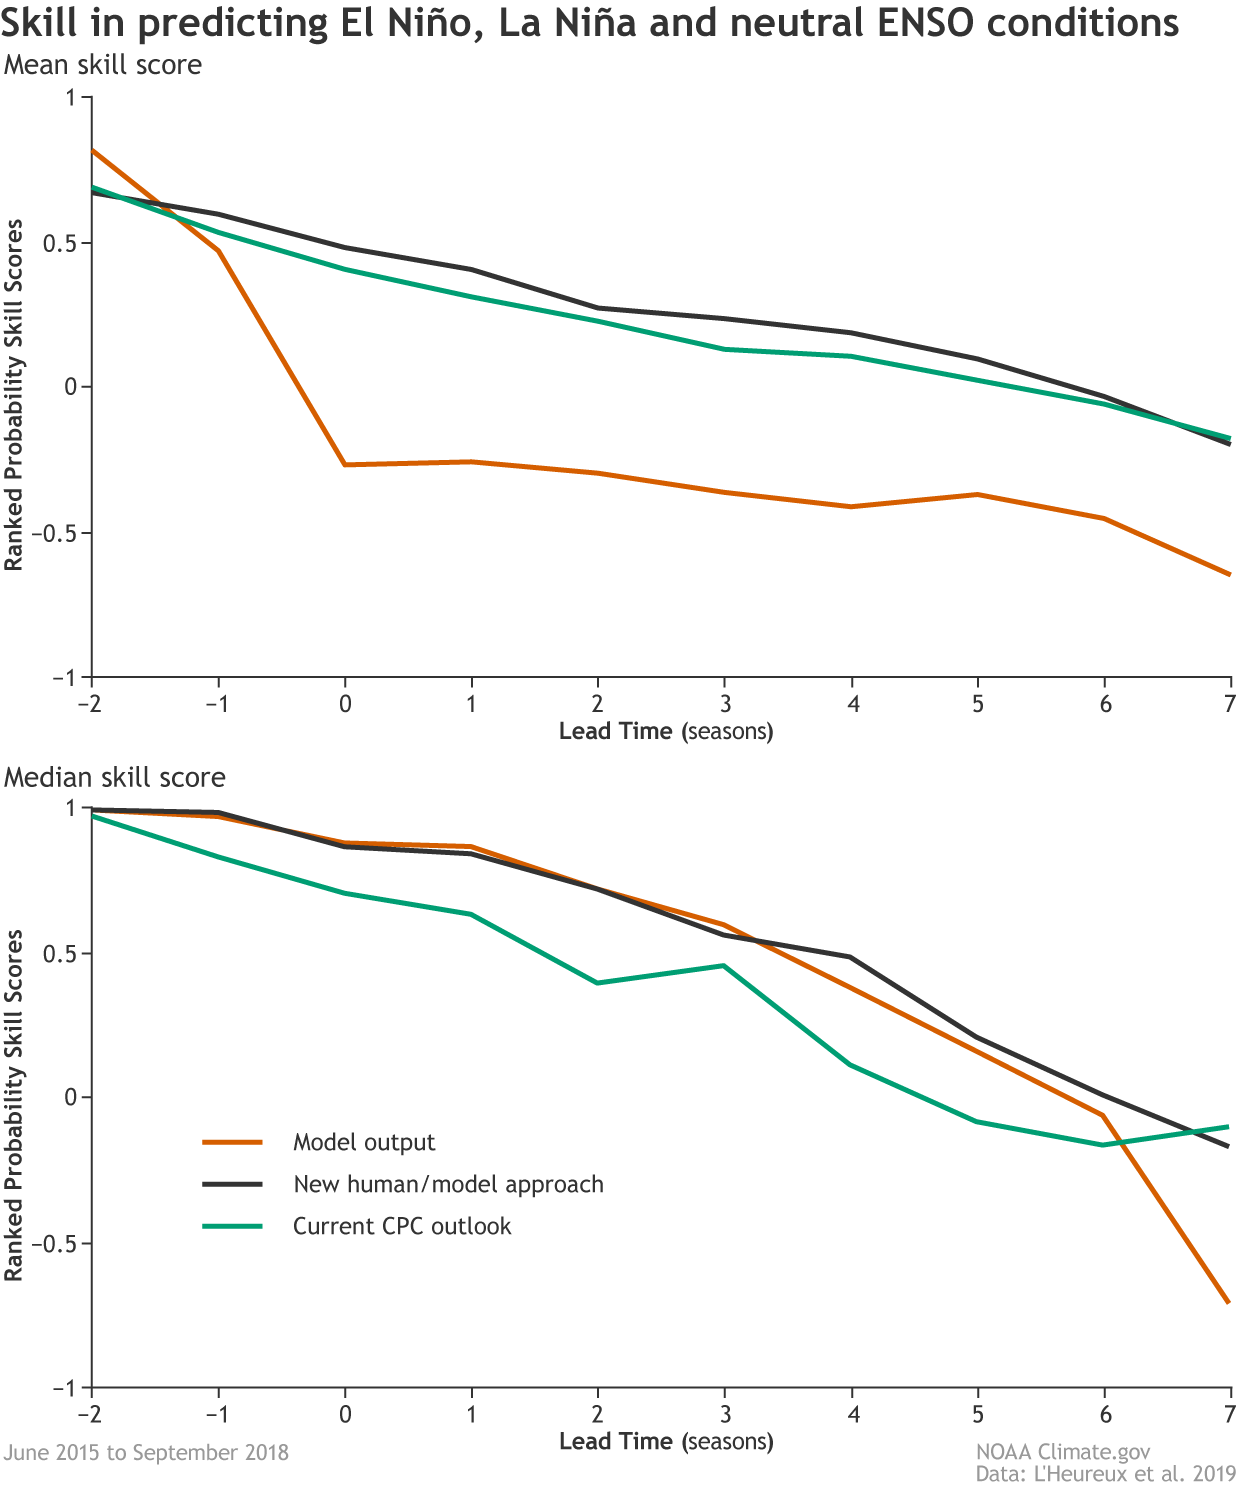 [Mean (top) and median (below) skill scores out to seven seasons for three methods of predicting ENSO: model output alone, a new human/model hybrid approach, and the current Climate Prediction Center outlook. A score of one would be a perfect prediction, while scores less than zero indicate the forecast was less skillful than simply predicting the climatological seasonal averages for El Niño, La Niña, and neutral conditions. Based on mean scores, the new hybrid strategy performed best over the test period (June 2015–September 2018). NOAA Climate image adapted from L'Heureux et al., 2019.]
Comparing the average skill (4) of the three methods (human synthesis, model output, new hybrid (5)) for forecasts made from June 2015 to September 2018 shows that the new method that combines human forecasters’ SST predictions with model-derived information performed best for forecasts from one month out to seven.
The analysis also hinted at a quirk of human nature: on average, human forecasters were too conservative, having lower probabilities for certain categories even in cases where it was more obvious a given outcome was becoming likely. This pattern may be consistent with psychological research that suggests people are more troubled by the possibility of loss (a BIG forecast bust) than by missing out on a comparable gain (getting the forecast right).
Meanwhile, the model output was the worst in terms of mean skill score. Interestingly, though, if you instead looked at the median (exact middle) scores, the model output outscores the original human synthesis. It’s like the models have a “Go big or go home” mentality, and they don’t second guess themselves. When they miss, they miss BIG. But when they nail it, they really NAIL IT. Human forecasters lowered their median skill score by not “going all in,” even in situations that called for high confidence. Either way, the new human-model hybrid approach had the best scores.
[Mean (top) and median (below) skill scores out to seven seasons for three methods of predicting ENSO: model output alone, a new human/model hybrid approach, and the current Climate Prediction Center outlook. A score of one would be a perfect prediction, while scores less than zero indicate the forecast was less skillful than simply predicting the climatological seasonal averages for El Niño, La Niña, and neutral conditions. Based on mean scores, the new hybrid strategy performed best over the test period (June 2015–September 2018). NOAA Climate image adapted from L'Heureux et al., 2019.]
Comparing the average skill (4) of the three methods (human synthesis, model output, new hybrid (5)) for forecasts made from June 2015 to September 2018 shows that the new method that combines human forecasters’ SST predictions with model-derived information performed best for forecasts from one month out to seven.
The analysis also hinted at a quirk of human nature: on average, human forecasters were too conservative, having lower probabilities for certain categories even in cases where it was more obvious a given outcome was becoming likely. This pattern may be consistent with psychological research that suggests people are more troubled by the possibility of loss (a BIG forecast bust) than by missing out on a comparable gain (getting the forecast right).
Meanwhile, the model output was the worst in terms of mean skill score. Interestingly, though, if you instead looked at the median (exact middle) scores, the model output outscores the original human synthesis. It’s like the models have a “Go big or go home” mentality, and they don’t second guess themselves. When they miss, they miss BIG. But when they nail it, they really NAIL IT. Human forecasters lowered their median skill score by not “going all in,” even in situations that called for high confidence. Either way, the new human-model hybrid approach had the best scores.
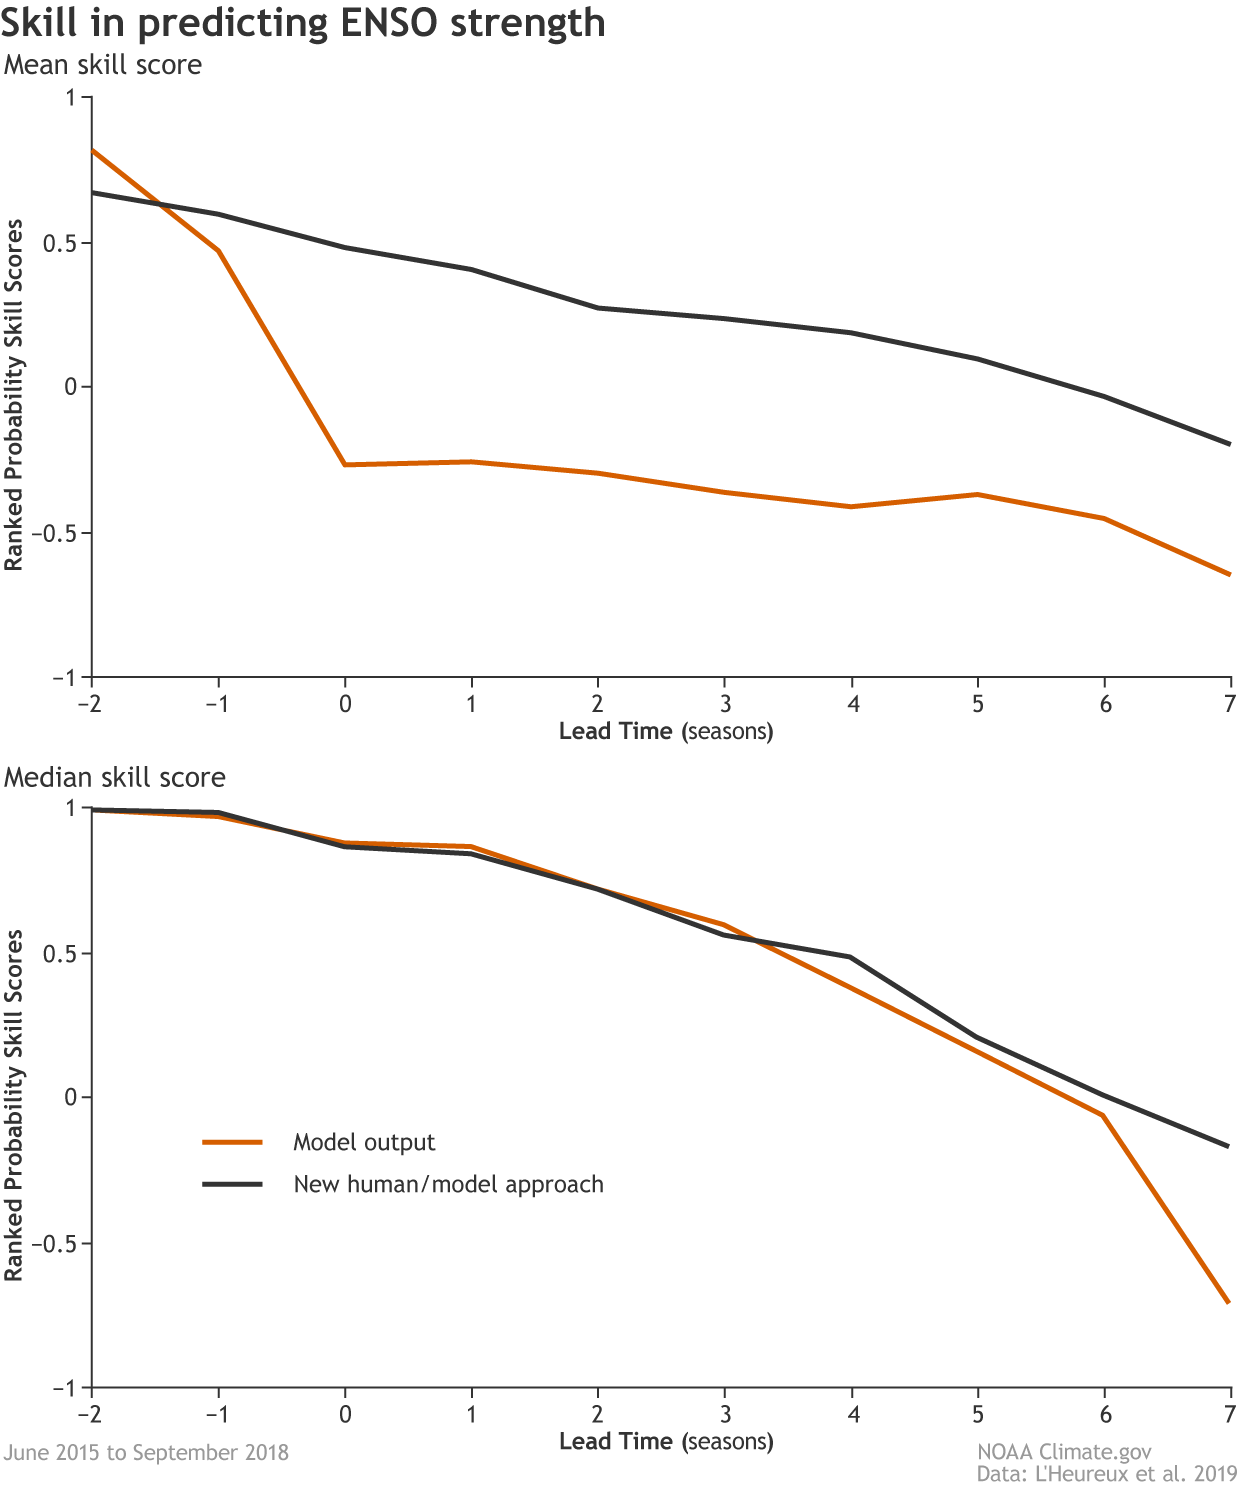 [Mean (top) and median (below) skill scores for two methods of predicting the strength of El Niño and La Niña: model output and a new human/model hybrid approach. A score of one would be a perfect prediction, while scores less than zero indicate the forecast was less skillful than simply predicting the climatological seasonal averages of strength. Forecast lead time is on the x-axis, and extends to seven seasons. The new hybrid approach performed better than simply using the model output to predict ENSO strength across the verification period (June 2015–September 2018). NOAA Climate image adapted from L'Heureux et al., 2019.]
This holds true for the strength forecasts as well: the new hybrid method not only outperformed the model output (6), but it also had skill similar to the current strategy that only forecasts the three categories (El Niño, La Niña, or neutral) and does not say anything about strength. These results indicate that the addition of more strength categories won’t degrade existing skill.
[Mean (top) and median (below) skill scores for two methods of predicting the strength of El Niño and La Niña: model output and a new human/model hybrid approach. A score of one would be a perfect prediction, while scores less than zero indicate the forecast was less skillful than simply predicting the climatological seasonal averages of strength. Forecast lead time is on the x-axis, and extends to seven seasons. The new hybrid approach performed better than simply using the model output to predict ENSO strength across the verification period (June 2015–September 2018). NOAA Climate image adapted from L'Heureux et al., 2019.]
This holds true for the strength forecasts as well: the new hybrid method not only outperformed the model output (6), but it also had skill similar to the current strategy that only forecasts the three categories (El Niño, La Niña, or neutral) and does not say anything about strength. These results indicate that the addition of more strength categories won’t degrade existing skill.
[Sea surface temperature in May 2019 compared to the 1981-2010 average. A recent experiment tested strategies for predicting the monthly difference from average temperature in the heart of ENSO territory—the Nino 3.4 region of the tropical Pacific. NOAA Climate image using data from NCEI.]
You don’t forecast ENSO strength?
Not exactly. Each month, NOAA’s ENSO team organized by the Climate Prediction Center forecasts the probability that surface temperatures (SST) in the heart of El Niño territory (the Niño3.4 region) will fall into three categories: more than 0.5°C below average (La Niña), more than 0.5°C above average (El Niño) or in between (neutral). This is done for nine consecutive, overlapping three-month seasons—for example July–September, then August–October, and so on. The final ENSO outlook averages all the forecasters’ probabilities. However, we do not provide probabilities for the potential strength of an El Niño or La Niña event. Forecasting the probabilities for three categories for nine seasons (27 total probability estimates) is tough enough. Imagine if we had to do it for nine categories (say, the odds of a very strong El Niño, a strong El Niño, a moderate El Niño, or a weak El Niño. Plus the same for La Niña.) For nine upcoming seasons, that’d be 81 total probability estimates. Triple the homework? Forecasters would mutiny! I’d cry.
[Model forecasts for the Niño3.4 index. Dynamical model average (purple line) from the North American Multi-Model Ensemble (NMME). Statistical model average (dashed line) from CPC’s Consolidated SST Forecasts. Shading shows the range of forecasts: 95% are within the lighter shading, and 68% are within the darker shading. NOAA Climate image from CPC data.]
Instead, Michelle asked all of the ENSO forecasters to make a single addition to their forecasts: predict the monthly SST anomaly in the Niño3.4 region. Instead of having the forecasters come up with uncertainty estimates, she derived them from statistical information provided by observations and models (2): how much a given month’s SST has historically varied, and how well model forecasts have historically performed for a given time of year.
The beauty of this method is that it allows us to forecast the probability of SST anomalies being greater or less than any number, not just the 0.5°C and -0.5°C thresholds used for determining El Niño and La Niña. This means we can issue probabilities for different strengths of La Niña and El Niño for any new category; for example, El Niño strength between 1.0°C and 1.5°C.
This also means that humans wouldn’t have to forecast multiple probabilities. Instead, we’d have to forecast only one number for the upcoming seasons. That makes life easier. As it turns out, it also makes the forecasts better.
Risk and reward
Coming up with a method for forecasting ENSO strength, though, would be pointless if it didn’t outperform some of the climate models we forecasters look at for guidance (3). After all,
[Mean (top) and median (below) skill scores out to seven seasons for three methods of predicting ENSO: model output alone, a new human/model hybrid approach, and the current Climate Prediction Center outlook. A score of one would be a perfect prediction, while scores less than zero indicate the forecast was less skillful than simply predicting the climatological seasonal averages for El Niño, La Niña, and neutral conditions. Based on mean scores, the new hybrid strategy performed best over the test period (June 2015–September 2018). NOAA Climate image adapted from L'Heureux et al., 2019.]
Comparing the average skill (4) of the three methods (human synthesis, model output, new hybrid (5)) for forecasts made from June 2015 to September 2018 shows that the new method that combines human forecasters’ SST predictions with model-derived information performed best for forecasts from one month out to seven.
The analysis also hinted at a quirk of human nature: on average, human forecasters were too conservative, having lower probabilities for certain categories even in cases where it was more obvious a given outcome was becoming likely. This pattern may be consistent with psychological research that suggests people are more troubled by the possibility of loss (a BIG forecast bust) than by missing out on a comparable gain (getting the forecast right).
Meanwhile, the model output was the worst in terms of mean skill score. Interestingly, though, if you instead looked at the median (exact middle) scores, the model output outscores the original human synthesis. It’s like the models have a “Go big or go home” mentality, and they don’t second guess themselves. When they miss, they miss BIG. But when they nail it, they really NAIL IT. Human forecasters lowered their median skill score by not “going all in,” even in situations that called for high confidence. Either way, the new human-model hybrid approach had the best scores.
[Mean (top) and median (below) skill scores for two methods of predicting the strength of El Niño and La Niña: model output and a new human/model hybrid approach. A score of one would be a perfect prediction, while scores less than zero indicate the forecast was less skillful than simply predicting the climatological seasonal averages of strength. Forecast lead time is on the x-axis, and extends to seven seasons. The new hybrid approach performed better than simply using the model output to predict ENSO strength across the verification period (June 2015–September 2018). NOAA Climate image adapted from L'Heureux et al., 2019.]
This holds true for the strength forecasts as well: the new hybrid method not only outperformed the model output (6), but it also had skill similar to the current strategy that only forecasts the three categories (El Niño, La Niña, or neutral) and does not say anything about strength. These results indicate that the addition of more strength categories won’t degrade existing skill.
What does that mean?
It is encouraging that this new approach already shows promise. The forecasting team will continue to test it out over a longer time period as part of CPC's plans to integrate strength outlooks into ENSO forecasts. Once the technique is operational, humans will need to forecast only a single number—the SST anomaly—per season, and models and observation statistics will handle the rest. Ahhhhh…human and computer peaceful coexistence. A win for all.Footnotes
(1) After the first three authors, the rest of us were listed alphabetically. I very easily could have been fourth or thirteenth. So I’ll happily take seventh. Fellow ENSO bloggers, Emily and Nat, also co-authored the paper. (2) She took the average of the surface temperature anomaly forecasts from all forecasters and applied a normal, bell-shaped or Gaussian statistical distribution. A normal distribution is simply a type of distribution that is bell-shaped and symmetrical on either side of, in this case, the average SST anomaly forecast. Think of the purpose of the statistical distribution like this. The human-average is the scientist’s best guess at what is most likely to occur, but that is nowhere near a 100% certainty. The distribution helps expand on the probabilities or chances that other SST anomalies could occur. The shape of the bell (is it a narrow bell? A wide bell?) is determined by the SST anomaly observations for the month and the typical forecast skill we can expect for that month—there is more skill in forecasting one month out than eight months into the future for instance. For a description of how statistical distributions are applied, you can head here to see how it applies to one in thousand year rain events. And for a more in depth discussion on how exactly these probabilities were determined, I recommend reading the paper for those details. (3) The climate models used here are the North American Multimodel Ensemble or NMME. This ensemble of climate models predicts a whole host of atmospheric and oceanic variables allowing forecasters to get a sense of what the future hold across the ocean-atmosphere interface. (4) The Ranked Probability Score (RPSS) looks at the sum squared error of the cumulative forecast probabilities. This means that the RPSS evaluates the entire probability distribution. So, for example, if the observation qualified for El Niño, a forecaster would get penalized more for putting probabilities in La Niña than Neutral, but the forecaster overall would get penalized for any probability outside of El Niño. The paper also uses an additional method (LSS) to evaluate the forecasts with similar results. (5) To be clear, “human synthesis” refers to the current subjective method of doing business, in which humans make probability estimates for ENSO status after considering output from many different model collections. “Model output” refers to objective numeric output from the North American Multi-model Ensemble (NMME). (The human synthesis considers many models beyond the NMME, but we had to pick something compare against.) The “new hybrid” is the strategy of having humans forecast only the SST anomaly and using model and observation statistics to generate the probabilities. (6) For this part of the analysis, the new hybrid method is only compared with the model output because the current human synthesis method does not include probabilistic strength forecasts. Edited for WeatherNation by Meteorologist Mace MichaelsAll Weather News
More
Fronts Continue To Spark Severe Weather Across the Plains
A cold front that brought record lows to the
18 Jul 2025 10:40 PM

Extreme Heat Impacts for the East Coast & South
Extreme heat continues to impact several area
18 Jul 2025 10:05 PM

Flooding Threat Remains Elevated in the East
A cold front pushing through the Eastern Seab
18 Jul 2025 9:10 PM

EF-2 Firenado from the Deer Creek Fire in Utah
A fire tornado was spotted near La Sal, Utah
18 Jul 2025 7:30 AM

Tropical System Brings Flood Risk to the Central Gulf
Time has run out for notable tropical develop
18 Jul 2025 3:05 AM

Heavy Rain, Flooding Threat Returns to Florida
Keep the rain boots handy in Florida - heavy
13 Jul 2025 12:50 PM

Severe Storm Risk Pushes into the Great Lakes, Ohio Valley
Friday was another busy day with severe weath
12 Jul 2025 8:00 PM