Explaining the New Climate Normals
Special Stories
19 Mar 2021 1:00 AM
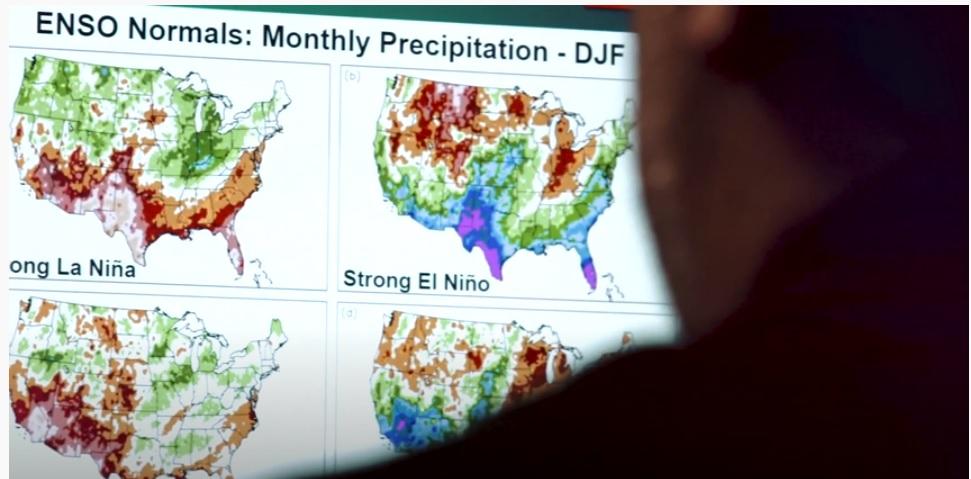
[NCEI climatologist Anthony Arguez reviews El Niño/Southern Oscillation winter precipitation Climate Normals from NOAA for the contiguous United States. Courtesy of NOAA NCEI.]
[Written by NOAA] Climatologists from NOAA’s National Centers for Environmental Information (NCEI) are currently compiling and reviewing 30 years of weather and climate data from across the U.S. to serve as the nation’s official climate “normals” for the next 10 years. This updated 30-year dataset, which spans from 1991 to 2020, is scheduled for release in May 2021.
Ahead of the scheduled release, NOAA posed a few questions to Mike Palecki, the project manager for NOAA NCEI’s 1991-to-2020 Climate Normals.
Palecki’s love of weather and climate started in elementary school, when he began collecting daily maximum and minimum temperature and precipitation measurements in his backyard in Easthampton, Massachusetts. He eventually graduated with a PhD in geography—with an emphasis on climatology—from The Pennsylvania State University, and came to work for NOAA in 2008.
Climate Normals provide a baseline to compare yesterday’s weather and tomorrow’s forecast to a standard for each location and time of year. They can also be used to understand the impacts of climate on many activities impacting all sectors of the U.S. economy.
 [Preliminary set of maximum temperature change maps for winter.]
What things are Climate Normals used for?
Climate Normals have a wide range of applications beyond weather and climate comparison. They are used for the regulation of power companies, energy load forecasting, crop selection and planting times, construction planning, building design, and many other disciplines, industries, and sectors.
Why does NOAA update the normals?
NOAA produces and updates the Climate Normals in accordance with the World Meteorological Organization (WMO), which mandates that each of its member nations must compute these 30-year averages (1931–1960, 1961–1990, 1991–2020, etc.), and recommends an update each decade.
This is, in part, to incorporate newer weather stations; however, more recent updates acknowledge the need to keep pace with conditions as climate changes over time, This is why temperature and precipitation normals of means, totals, and statistics often shift and change from one 30-year period to the next.
[Preliminary set of maximum temperature change maps for winter.]
What things are Climate Normals used for?
Climate Normals have a wide range of applications beyond weather and climate comparison. They are used for the regulation of power companies, energy load forecasting, crop selection and planting times, construction planning, building design, and many other disciplines, industries, and sectors.
Why does NOAA update the normals?
NOAA produces and updates the Climate Normals in accordance with the World Meteorological Organization (WMO), which mandates that each of its member nations must compute these 30-year averages (1931–1960, 1961–1990, 1991–2020, etc.), and recommends an update each decade.
This is, in part, to incorporate newer weather stations; however, more recent updates acknowledge the need to keep pace with conditions as climate changes over time, This is why temperature and precipitation normals of means, totals, and statistics often shift and change from one 30-year period to the next.
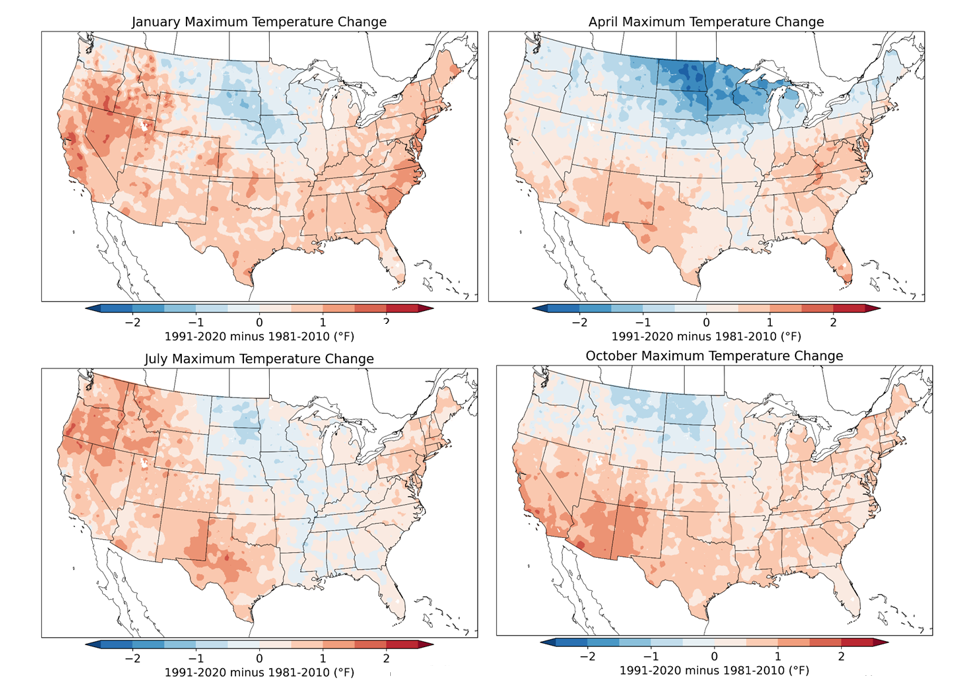 [Preliminary set of maximum temperature change maps for the center months in each season.]
What changes are you seeing with the 1991–2020 U.S. Climate Normals update?
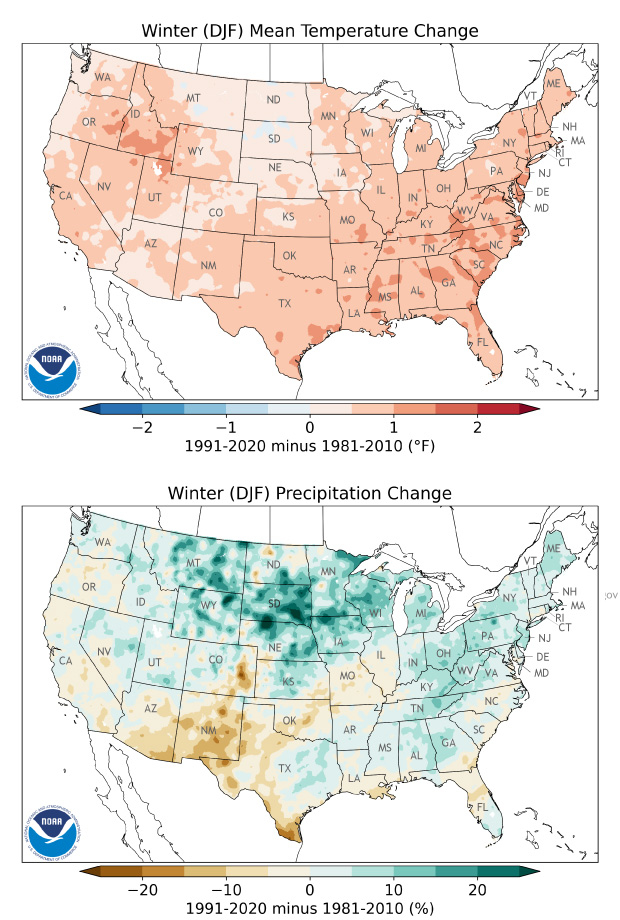
Preliminary analysis shows that the Climate Normals for 1991–2020 are generally warmer in most seasons and regions of the United States, but not everywhere. Notably, the North Central U.S. region temperatures are somewhat cooler than those based on 1981–2010, especially in the late winter and spring seasons.
Precipitation normals also change for 1991–2020, with increases especially large in the Southeast and South Central U.S., and distinct seasonally dependent shifts in the West. Since the most recent normals and the new normals overlap between 1991–2010, the changes are somewhat muted compared to trends during the late 20th Century and early 21st Century.
Are the changes from the previous Climate Normals attributable to climate change?
Changes from the previous Climate Normals are driven by the differences between the 1980s and 2010s, since the 1991–2010 period is incorporated in both normals sets. That means the changes in Climate Normals from 1981–2010 to 1991–2020 are a combination of long-term climate changes over both periods, as well as decade-scale climate variations within the 1980s and 2010s.
What do Climate Normals tell us about global warming or climate change?
Climate Normals are designed—and best-suited for—current climate. Longer-term climate change is best studied with longer time series of climate observations. However, as normals have been recalculated over the last several cycles, they do tend to reflect some of the trends seen in longer time series.
It is also very clear that in some regions of the U.S., occurrences of above-normal days have increased, and the 30-year normal is no longer as fully representative of the region’s current climate.
[Preliminary set of maximum temperature change maps for the center months in each season.]
What changes are you seeing with the 1991–2020 U.S. Climate Normals update?
Preliminary analysis shows that the Climate Normals for 1991–2020 are generally warmer in most seasons and regions of the United States, but not everywhere. Notably, the North Central U.S. region temperatures are somewhat cooler than those based on 1981–2010, especially in the late winter and spring seasons.
Precipitation normals also change for 1991–2020, with increases especially large in the Southeast and South Central U.S., and distinct seasonally dependent shifts in the West. Since the most recent normals and the new normals overlap between 1991–2010, the changes are somewhat muted compared to trends during the late 20th Century and early 21st Century.
Are the changes from the previous Climate Normals attributable to climate change?
Changes from the previous Climate Normals are driven by the differences between the 1980s and 2010s, since the 1991–2010 period is incorporated in both normals sets. That means the changes in Climate Normals from 1981–2010 to 1991–2020 are a combination of long-term climate changes over both periods, as well as decade-scale climate variations within the 1980s and 2010s.
What do Climate Normals tell us about global warming or climate change?
Climate Normals are designed—and best-suited for—current climate. Longer-term climate change is best studied with longer time series of climate observations. However, as normals have been recalculated over the last several cycles, they do tend to reflect some of the trends seen in longer time series.
It is also very clear that in some regions of the U.S., occurrences of above-normal days have increased, and the 30-year normal is no longer as fully representative of the region’s current climate.
 More about our expert
In addition to his Climate Normals role, Mike Palecki is also the science project manager for the U.S. Climate Reference Network (USCRN) at NOAA's NCEI. The USCRN was established in the early 2000s to provide a research-quality set of measurements of climate in the U.S. The network deploys instruments that are redundant at each location so that if one fails, another continues operating, providing improved quality and continuity of records. The USCRN was used over the last ten years to verify that our typical station networks provide an accurate record of climate change over recent times despite concerns about station exposure changes and urban expansion issues.
More about our expert
In addition to his Climate Normals role, Mike Palecki is also the science project manager for the U.S. Climate Reference Network (USCRN) at NOAA's NCEI. The USCRN was established in the early 2000s to provide a research-quality set of measurements of climate in the U.S. The network deploys instruments that are redundant at each location so that if one fails, another continues operating, providing improved quality and continuity of records. The USCRN was used over the last ten years to verify that our typical station networks provide an accurate record of climate change over recent times despite concerns about station exposure changes and urban expansion issues.
[Preliminary set of maximum temperature change maps for winter.]
What things are Climate Normals used for?
Climate Normals have a wide range of applications beyond weather and climate comparison. They are used for the regulation of power companies, energy load forecasting, crop selection and planting times, construction planning, building design, and many other disciplines, industries, and sectors.
Why does NOAA update the normals?
NOAA produces and updates the Climate Normals in accordance with the World Meteorological Organization (WMO), which mandates that each of its member nations must compute these 30-year averages (1931–1960, 1961–1990, 1991–2020, etc.), and recommends an update each decade.
This is, in part, to incorporate newer weather stations; however, more recent updates acknowledge the need to keep pace with conditions as climate changes over time, This is why temperature and precipitation normals of means, totals, and statistics often shift and change from one 30-year period to the next.
[Preliminary set of maximum temperature change maps for the center months in each season.]
What changes are you seeing with the 1991–2020 U.S. Climate Normals update?
Preliminary analysis shows that the Climate Normals for 1991–2020 are generally warmer in most seasons and regions of the United States, but not everywhere. Notably, the North Central U.S. region temperatures are somewhat cooler than those based on 1981–2010, especially in the late winter and spring seasons.
Precipitation normals also change for 1991–2020, with increases especially large in the Southeast and South Central U.S., and distinct seasonally dependent shifts in the West. Since the most recent normals and the new normals overlap between 1991–2010, the changes are somewhat muted compared to trends during the late 20th Century and early 21st Century.
Are the changes from the previous Climate Normals attributable to climate change?
Changes from the previous Climate Normals are driven by the differences between the 1980s and 2010s, since the 1991–2010 period is incorporated in both normals sets. That means the changes in Climate Normals from 1981–2010 to 1991–2020 are a combination of long-term climate changes over both periods, as well as decade-scale climate variations within the 1980s and 2010s.
What do Climate Normals tell us about global warming or climate change?
Climate Normals are designed—and best-suited for—current climate. Longer-term climate change is best studied with longer time series of climate observations. However, as normals have been recalculated over the last several cycles, they do tend to reflect some of the trends seen in longer time series.
It is also very clear that in some regions of the U.S., occurrences of above-normal days have increased, and the 30-year normal is no longer as fully representative of the region’s current climate.
More about our expert
In addition to his Climate Normals role, Mike Palecki is also the science project manager for the U.S. Climate Reference Network (USCRN) at NOAA's NCEI. The USCRN was established in the early 2000s to provide a research-quality set of measurements of climate in the U.S. The network deploys instruments that are redundant at each location so that if one fails, another continues operating, providing improved quality and continuity of records. The USCRN was used over the last ten years to verify that our typical station networks provide an accurate record of climate change over recent times despite concerns about station exposure changes and urban expansion issues.All Weather News
More

Flooding, Severe Storms Target the Midwest Again
After several tornadoes ripped through the Mi
31 Jul 2026 11:20 AM


After Reaching Category 5, Genevieve Weakens in the Pacific
PacificFausto is now a post-tropical cyclone.
31 Jul 2026 1:30 AM

Flooding Risk Increases as Heavy Rain Targets the Tri-State Area
Tuesday, heavy rainfall moved across the Nort
30 Jul 2026 12:25 AM

Severe Weather: Energy From the Midwest Now in the Southeast
UPPER MIDWEST - Through Monday, dangerous tor
29 Jul 2026 10:30 PM

Southeast Flood Risk Lingers Near Stalled Front
A stalled boundary over the Southeast will ke
25 Jul 2026 10:55 AM