February La Niña Update: Just Along for the Ride
Special Stories
14 Feb 2022 2:00 AM
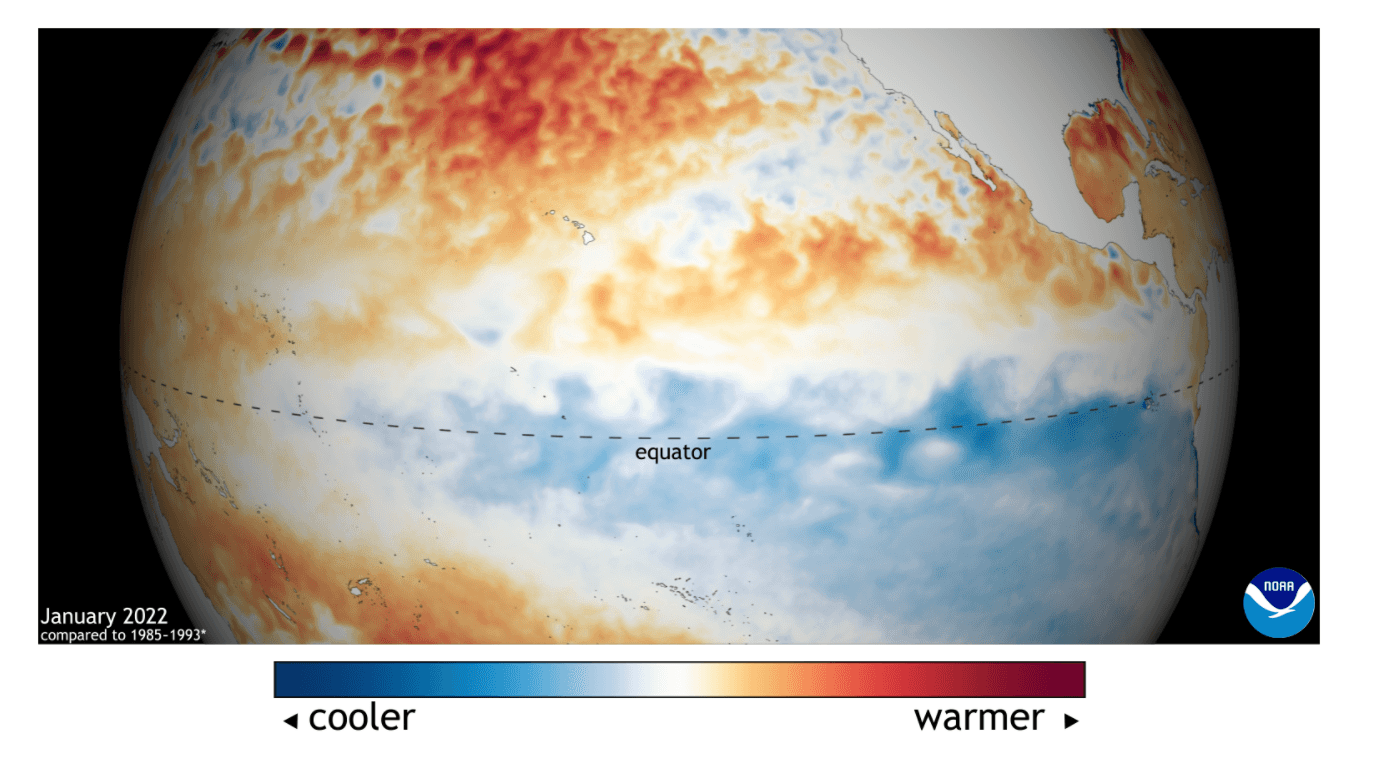
[January 2022 sea surface temperature departure. Image from Data Snapshots on NOAA Climate]
[From NOAA Climate written by Emily Becker] La Niña is likely to hang around through the spring, with a transition to neutral favored for the May–July period. Hop in, and we’ll cruise through some updates on current conditions and the recent past!
 [Monthly sea surface temperature anomalies (difference from average) in the Niño 3.4 region of the tropical Pacific for 2020-21 (purple line) and all other years (gray lines) starting from first-year La Niña winters since 1950. NOAA Climate graph based on ERSSTv5 temperature data.]
Will there be a third? We still don’t have a very clear picture of that. Right now, there’s a 77% chance that La Niña will last through the spring (March–May), largely based on computer model forecasts and bolstered by a recent uptick in the trade winds. Neutral is most likely for summer (June–August), with a 57% chance. By fall (September–November), neutral still has the edge, but forecasters can’t currently give any category a strong chance.
[Monthly sea surface temperature anomalies (difference from average) in the Niño 3.4 region of the tropical Pacific for 2020-21 (purple line) and all other years (gray lines) starting from first-year La Niña winters since 1950. NOAA Climate graph based on ERSSTv5 temperature data.]
Will there be a third? We still don’t have a very clear picture of that. Right now, there’s a 77% chance that La Niña will last through the spring (March–May), largely based on computer model forecasts and bolstered by a recent uptick in the trade winds. Neutral is most likely for summer (June–August), with a 57% chance. By fall (September–November), neutral still has the edge, but forecasters can’t currently give any category a strong chance.
 [Average location of the jet stream and typical temperature and precipitation impacts during La Niña winter over North America.]
I’m sure you noticed all the qualifying words in the previous paragraph. “Somewhat,” “might,” “tends,” etc. Believe me, I wish we could make stronger statements and more confident predictions! But I try to remember that it’s pretty amazing that we can get any idea of what the average weather might be like months into the future, given our complex and wildly chaotic Earth system. La Niña doesn’t guarantee warmer weather in the southeast or dry conditions in southern California—far from it—but it makes those conditions more likely overall.
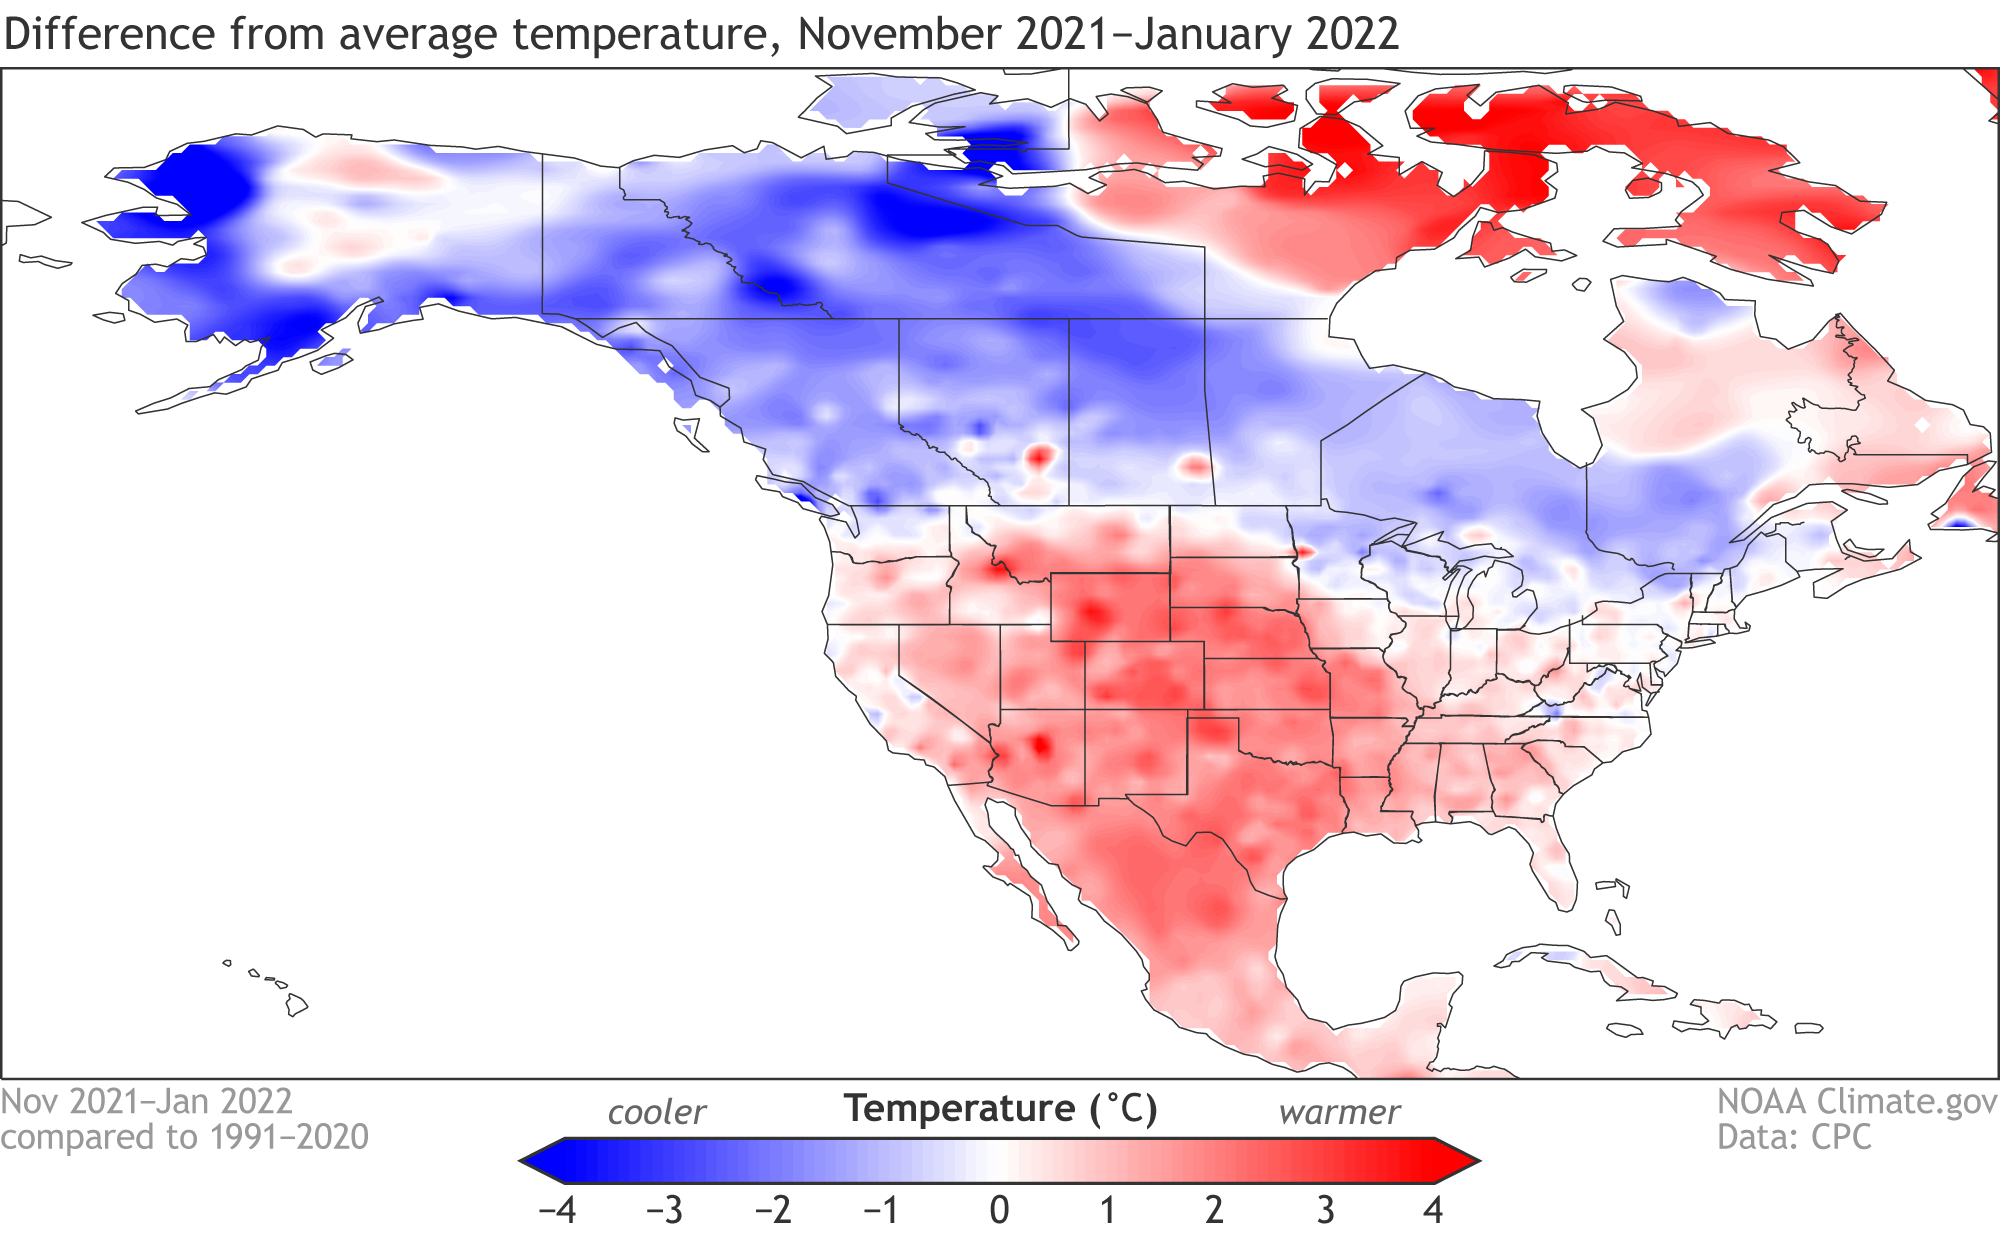
There’s more that goes into the seasonal forecast than ENSO, of course, like trends, or other climate patterns. Check out this post on the winter outlook for an overview of the seasonal outlook process, and a set of maps that illustrate just how much outcomes can vary from one La Niña event to another. That said, ENSO has a big imprint on the seasonal forecast. You can see the Climate Prediction Center’s outlook for November–January 2021–22 here.
The November–January average temperature ended up looking a lot like what we’d expect during La Niña: colder than average through Canada, warmer over most of the US. Not exactly the same, but reasonably similar.
[Average location of the jet stream and typical temperature and precipitation impacts during La Niña winter over North America.]
I’m sure you noticed all the qualifying words in the previous paragraph. “Somewhat,” “might,” “tends,” etc. Believe me, I wish we could make stronger statements and more confident predictions! But I try to remember that it’s pretty amazing that we can get any idea of what the average weather might be like months into the future, given our complex and wildly chaotic Earth system. La Niña doesn’t guarantee warmer weather in the southeast or dry conditions in southern California—far from it—but it makes those conditions more likely overall.
There’s more that goes into the seasonal forecast than ENSO, of course, like trends, or other climate patterns. Check out this post on the winter outlook for an overview of the seasonal outlook process, and a set of maps that illustrate just how much outcomes can vary from one La Niña event to another. That said, ENSO has a big imprint on the seasonal forecast. You can see the Climate Prediction Center’s outlook for November–January 2021–22 here.
The November–January average temperature ended up looking a lot like what we’d expect during La Niña: colder than average through Canada, warmer over most of the US. Not exactly the same, but reasonably similar.
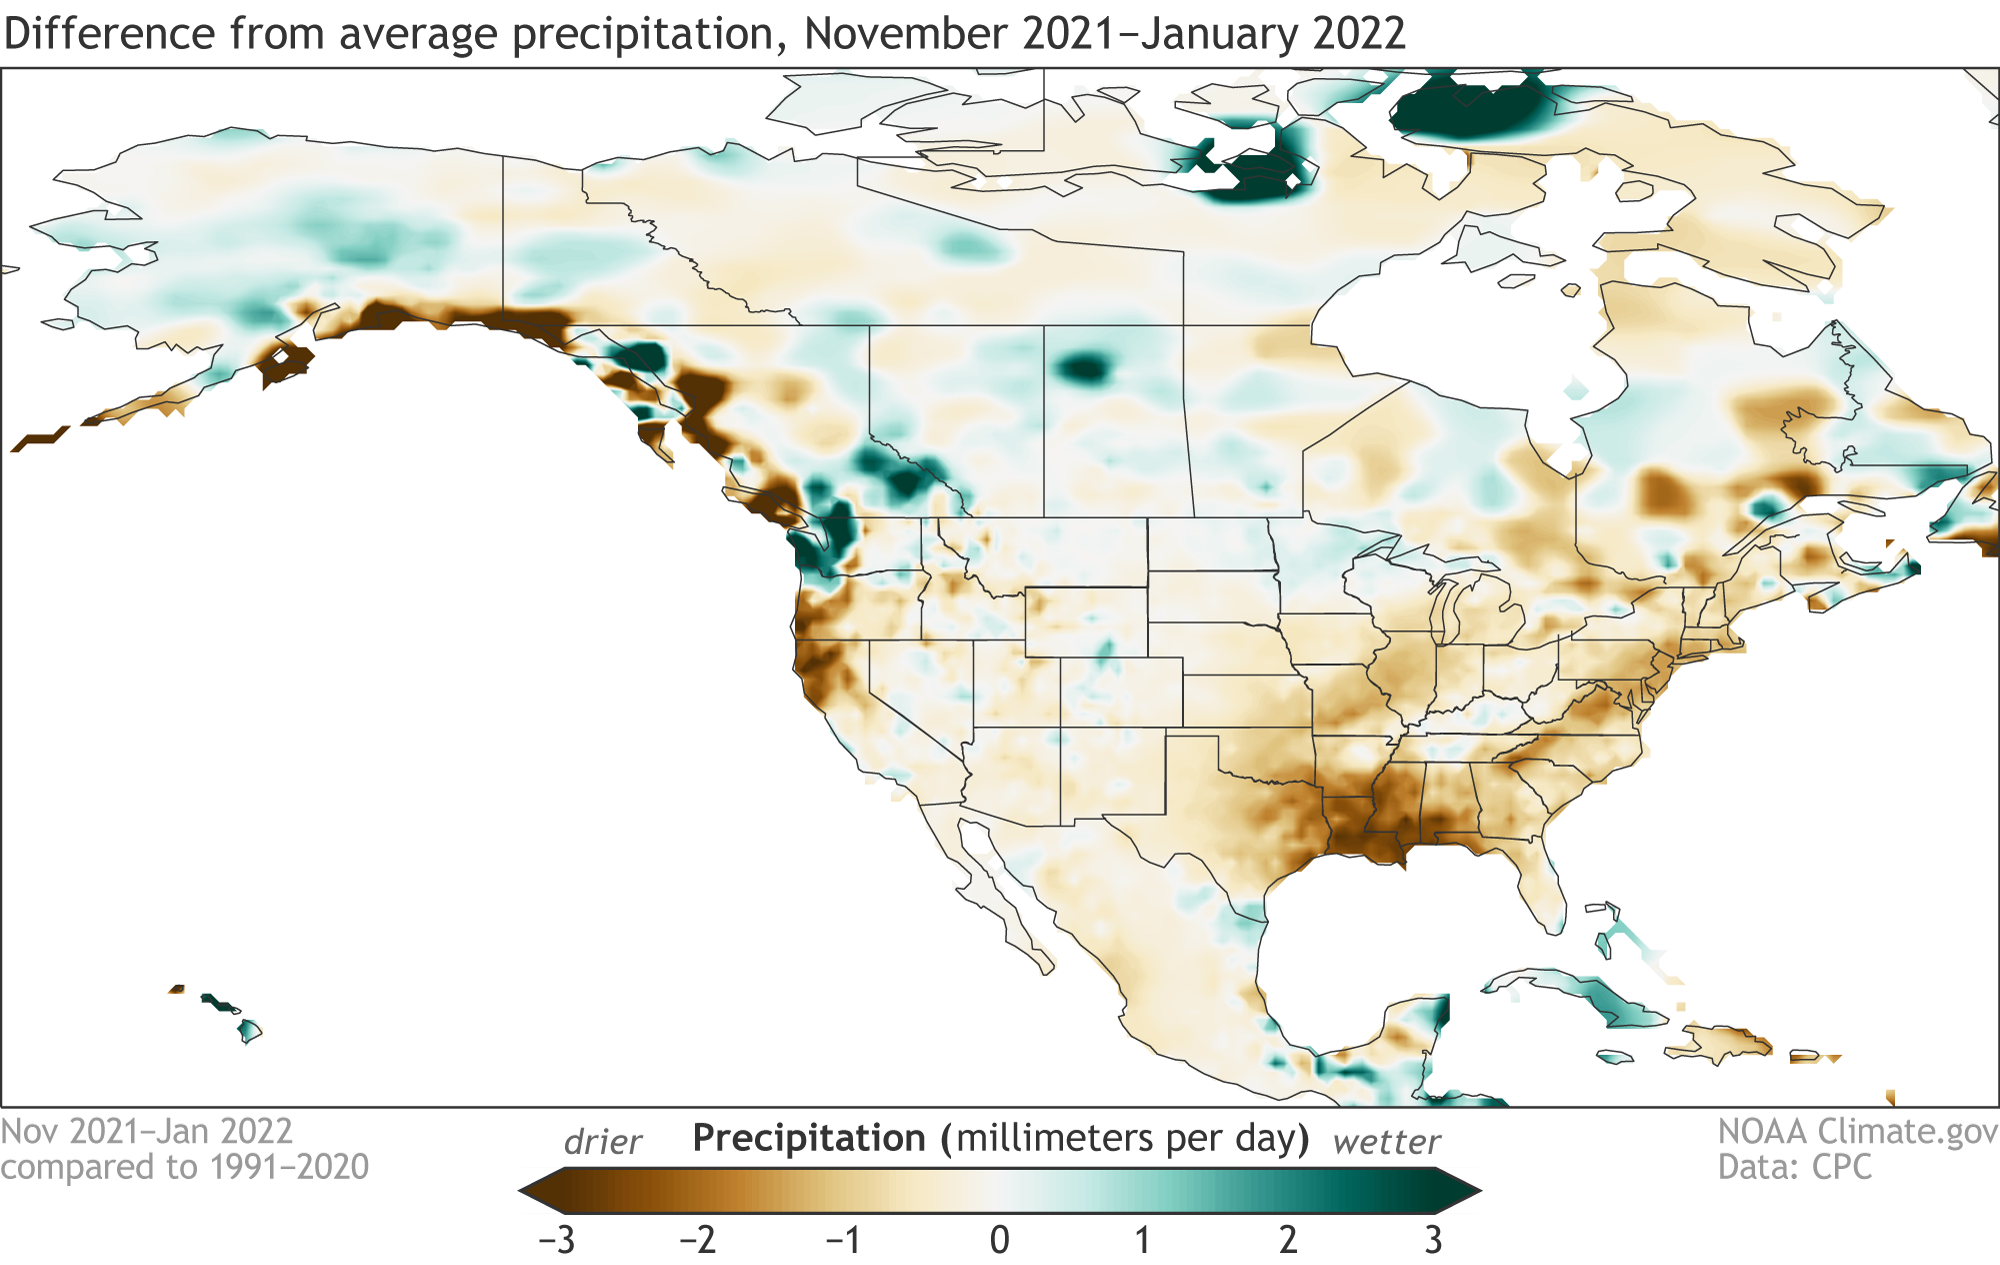
 [Precipitation difference from the 1991–2020 long-term average during November 2021–January 2022. Precipitation is rain plus the liquid equivalent of snow and ice. Map by NOAA Climate from CPC Global Daily Precipitation data.]
Seasonal climate averages matter—for example, your heating bill is going to reflect if the winter was warmer or colder than average overall. However, sometimes it’s hard to see the forest for the trees, like when you have a December that’s 6° F warmer than average, followed by a hair-pin turn into a January that’s 2° F colder than average. (Hello, Annapolis area!) More on this just a mile down the road.
The precipitation map for November–January also looks a fair bit like the typical La Niña impacts map for this season. Lots of rain and snow in the Pacific Northwest, substantially drier than average through the south-central and southeastern states.
[Precipitation difference from the 1991–2020 long-term average during November 2021–January 2022. Precipitation is rain plus the liquid equivalent of snow and ice. Map by NOAA Climate from CPC Global Daily Precipitation data.]
Seasonal climate averages matter—for example, your heating bill is going to reflect if the winter was warmer or colder than average overall. However, sometimes it’s hard to see the forest for the trees, like when you have a December that’s 6° F warmer than average, followed by a hair-pin turn into a January that’s 2° F colder than average. (Hello, Annapolis area!) More on this just a mile down the road.
The precipitation map for November–January also looks a fair bit like the typical La Niña impacts map for this season. Lots of rain and snow in the Pacific Northwest, substantially drier than average through the south-central and southeastern states.
 [Precipitation difference from the 1991–2020 long-term average during November 2021–January 2022. Precipitation is rain plus the liquid equivalent of snow and ice. Map by climate.gov from CPC Global Daily Precipitation data.]
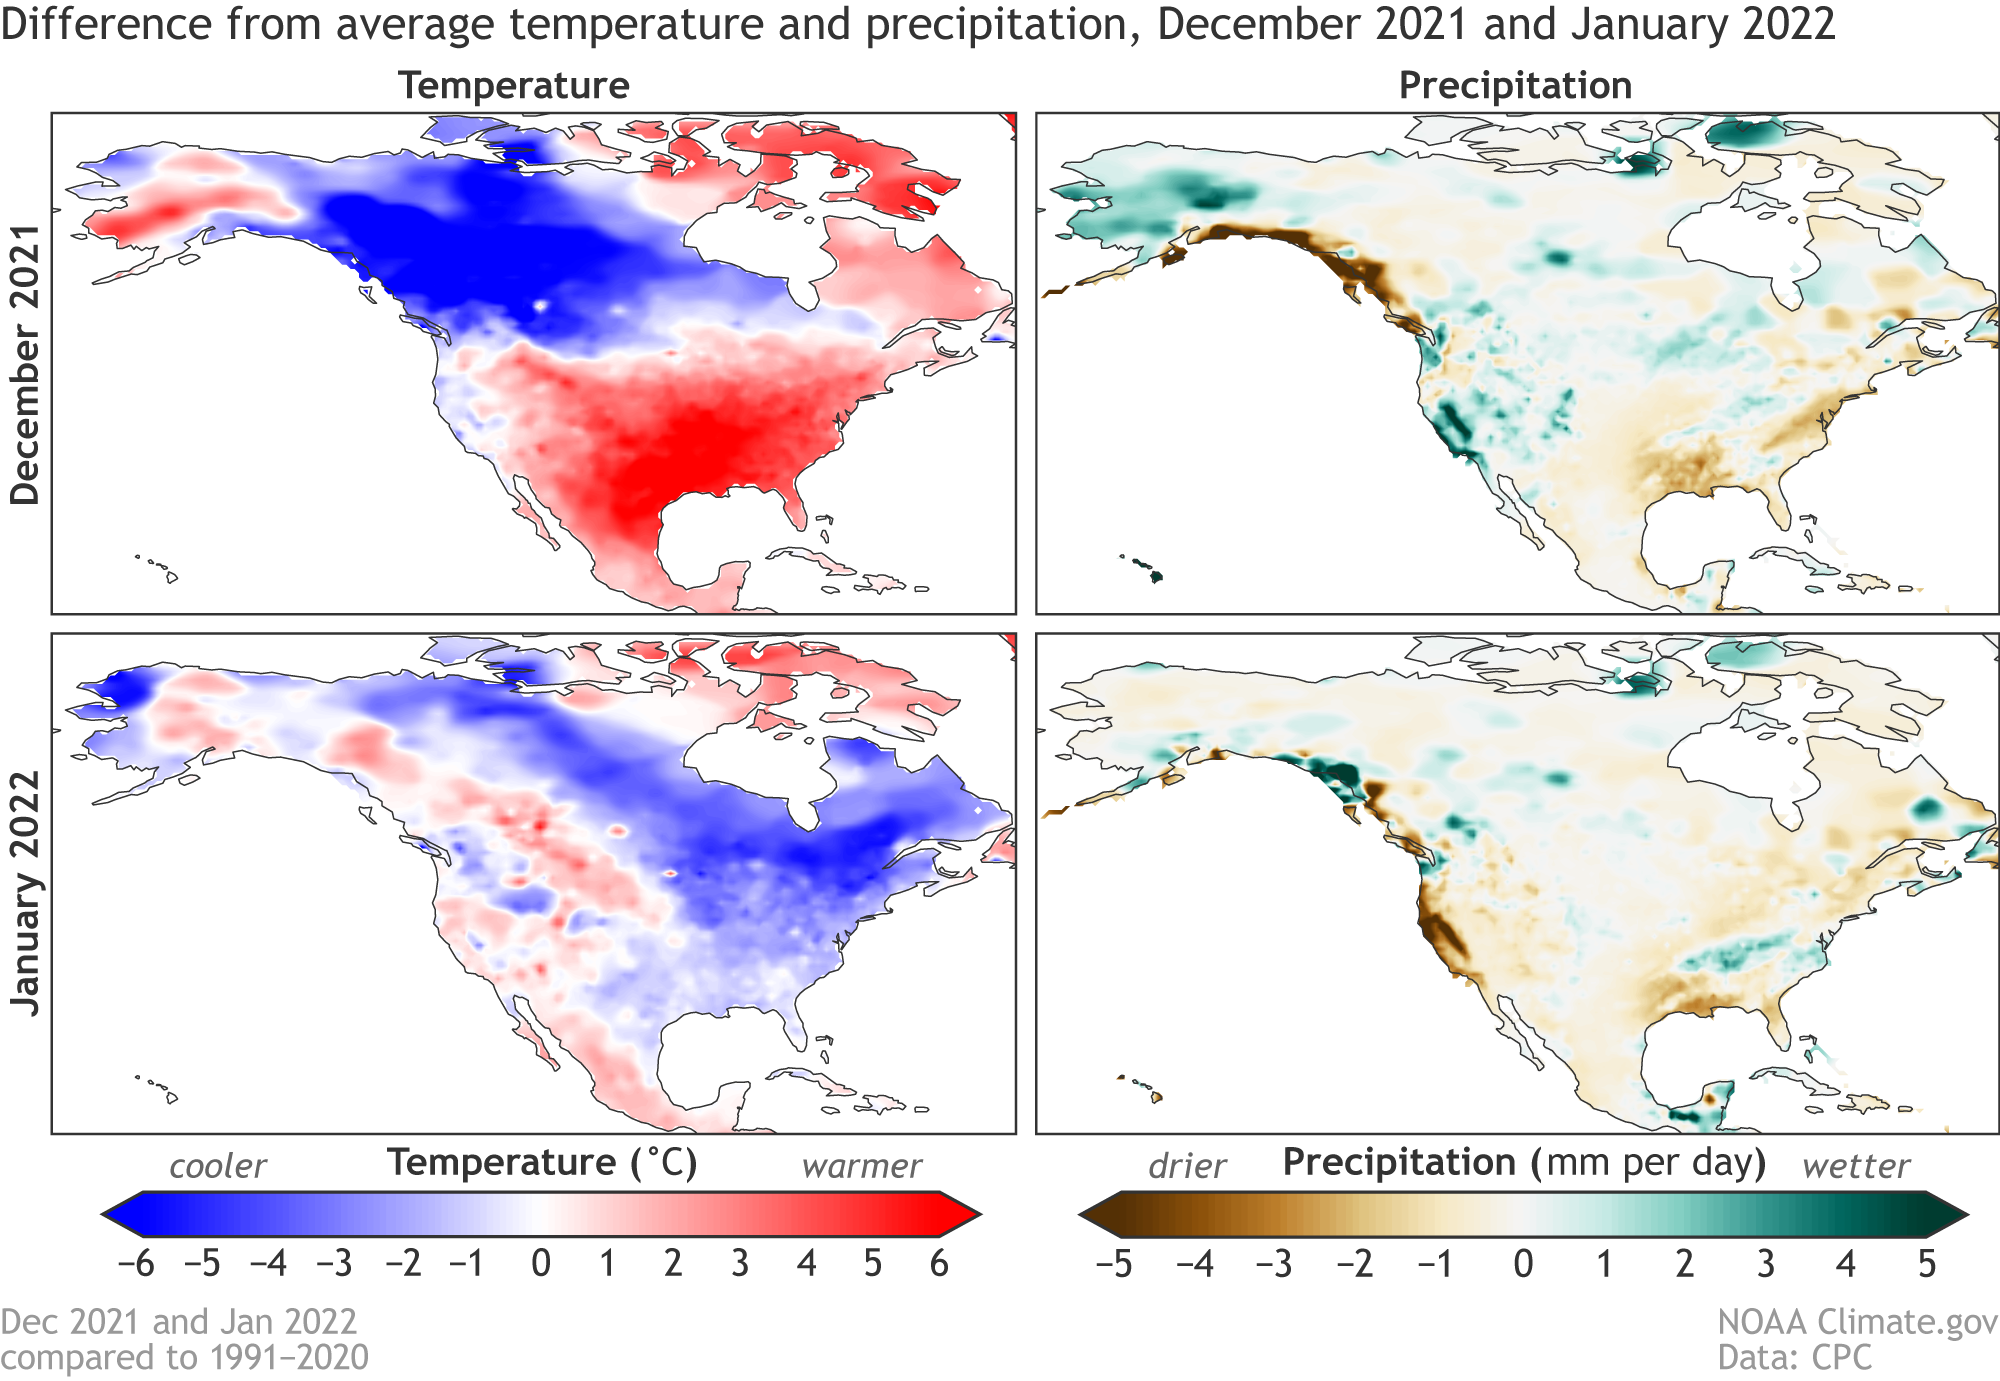 [Temperature (left maps) and precipitation (right maps) difference from the 1991–2020 average during December 2021 (top row) and January 2022 (bottom row). Maps by NOAA climate from CPC Global Daily Temperature data and CPC Global Daily Precipitation data.]
What’s behind these big swings? It’s tough to do a full attribution in the time I have here, but we do have some thoughts about a culprit. The Pacific-North American pattern (aka the PNA) is a major atmospheric circulation pattern that has a big impact on North American weather. The PNA’s positive phase is primarily characterized by below-average air pressure over the North Pacific and above-average pressure over northwestern North America.
[Temperature (left maps) and precipitation (right maps) difference from the 1991–2020 average during December 2021 (top row) and January 2022 (bottom row). Maps by NOAA climate from CPC Global Daily Temperature data and CPC Global Daily Precipitation data.]
What’s behind these big swings? It’s tough to do a full attribution in the time I have here, but we do have some thoughts about a culprit. The Pacific-North American pattern (aka the PNA) is a major atmospheric circulation pattern that has a big impact on North American weather. The PNA’s positive phase is primarily characterized by below-average air pressure over the North Pacific and above-average pressure over northwestern North America.
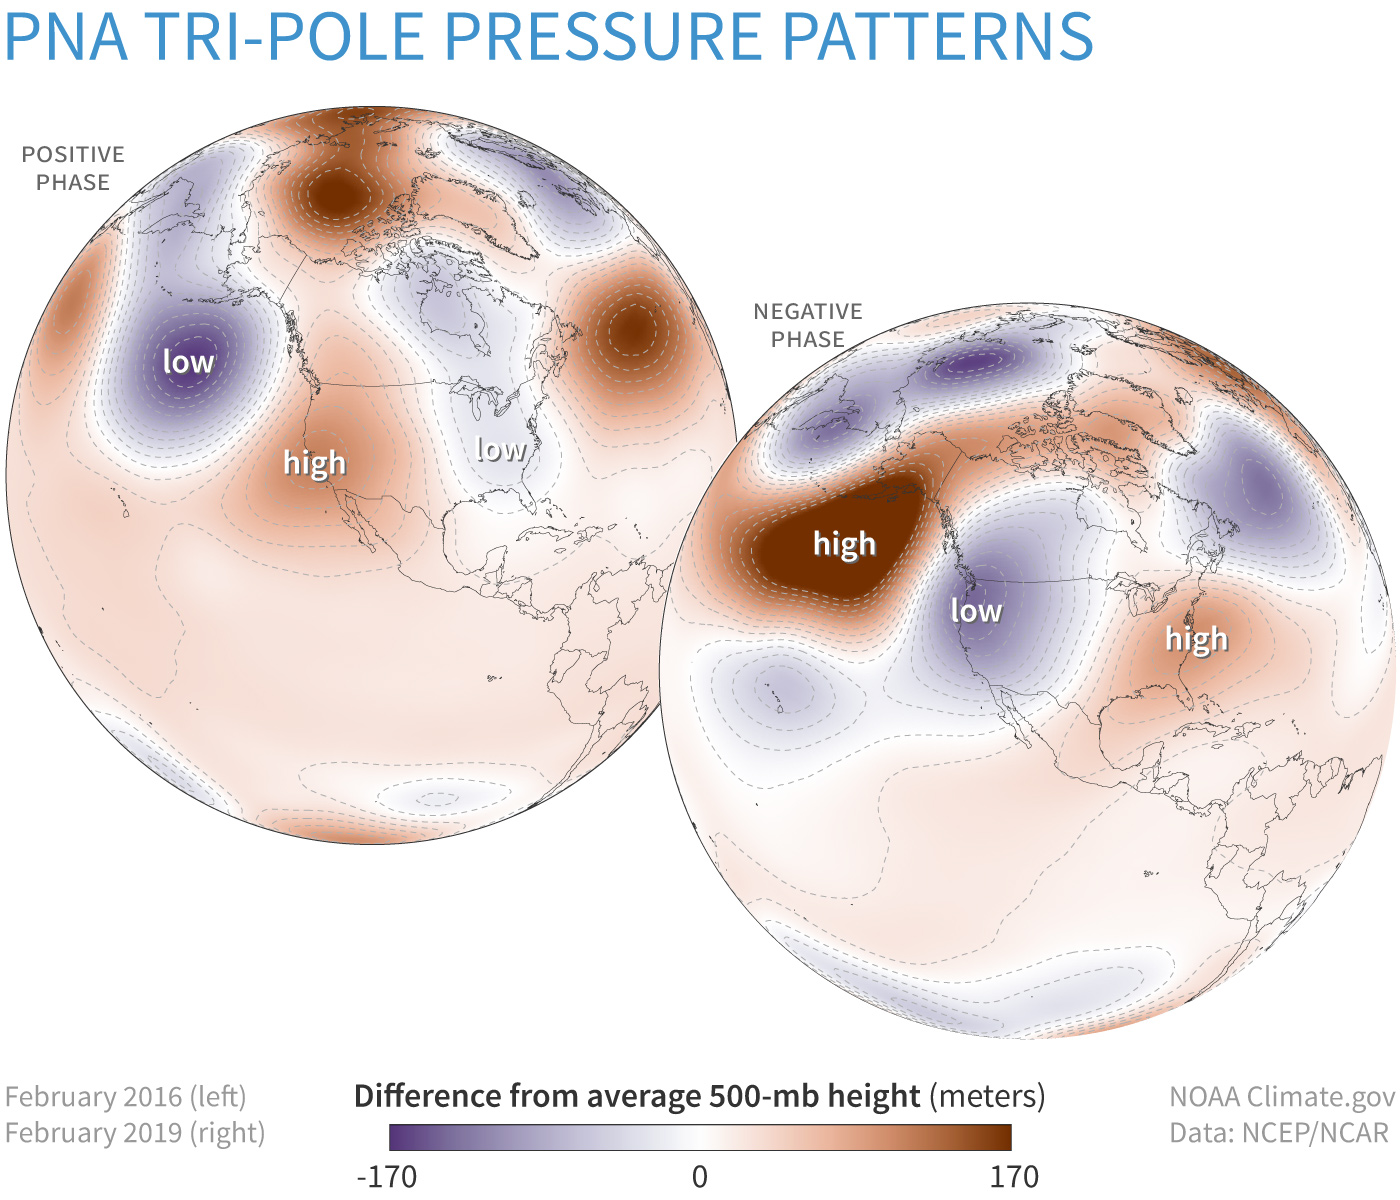 [Air pressure in the lower atmosphere compared to the 1981-2010 average during February 2016 (top), when the PNA was positive, and in February 2019 (bottom), when it was negative. The location of highs and lows and the flow of the jet stream around them often produce a sharp warm-cold split in temperatures in the western and eastern halves of the United States. NOAA Climate, based on data from the Physical Science Lab.]
The negative phase of the PNA is the opposite: higher pressure south of Alaska, lower pressure over Canada. Be sure to check out this post on the PNA, featuring one of our more excellent titles; the PNA Index can be viewed here. During La Niña, the PNA tends to be in its negative phase (that higher pressure over the north Pacific should sound familiar from earlier in this post). However, the PNA can change quickly, so, like the weather, the relationship to ENSO is weaker on a month-to-month basis.
[Air pressure in the lower atmosphere compared to the 1981-2010 average during February 2016 (top), when the PNA was positive, and in February 2019 (bottom), when it was negative. The location of highs and lows and the flow of the jet stream around them often produce a sharp warm-cold split in temperatures in the western and eastern halves of the United States. NOAA Climate, based on data from the Physical Science Lab.]
The negative phase of the PNA is the opposite: higher pressure south of Alaska, lower pressure over Canada. Be sure to check out this post on the PNA, featuring one of our more excellent titles; the PNA Index can be viewed here. During La Niña, the PNA tends to be in its negative phase (that higher pressure over the north Pacific should sound familiar from earlier in this post). However, the PNA can change quickly, so, like the weather, the relationship to ENSO is weaker on a month-to-month basis.
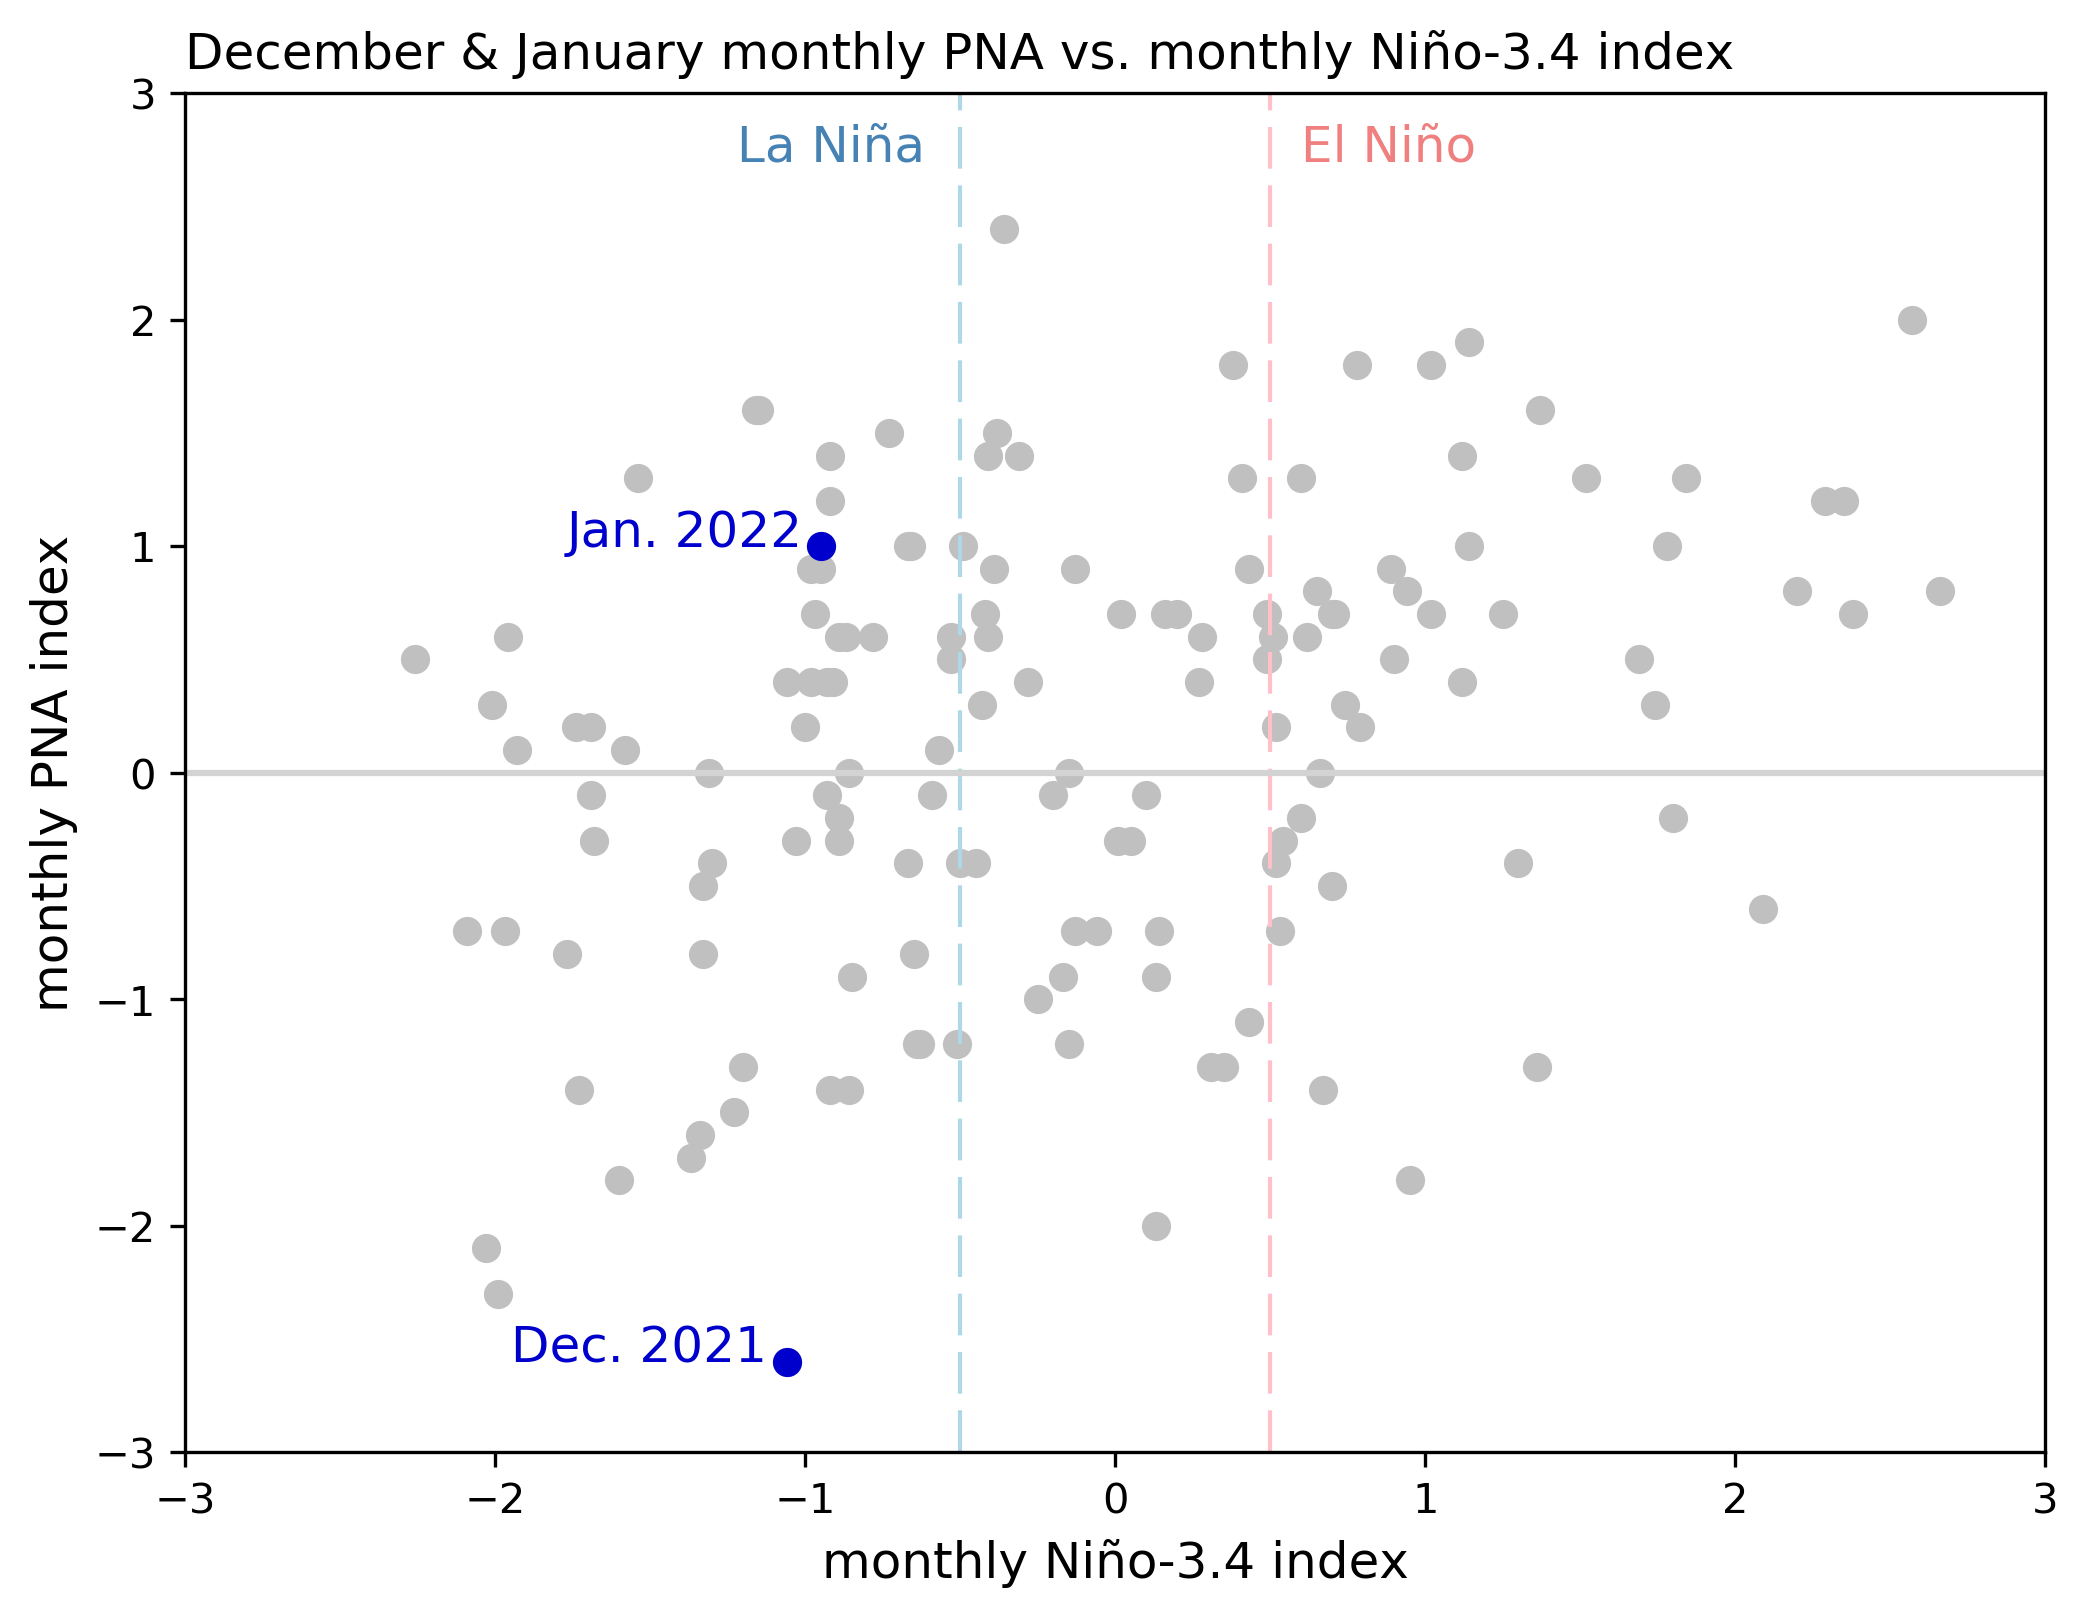 [One-month-average Pacific-North America pattern index (vertical axis) versus the one-month-average Niño-3.4 index (horizontal axis) during Decembers and Januarys, 1950–2022. NOAA Climate graph from CPC data.]
December 2021 featured the strongest negative winter monthly PNA pattern on record (1950–present). Then, in January 2022, the PNA moved into a positive phase, making the largest jump on record from one December to January. Why did the PNA flip? That is a topic for another day. The PNA can be affected by other climate patterns, but, as Michelle says in her earlier post, “a large chunk of the PNA is internally driven.” This means that apparently random, chaotic behavior, aka internal variability, often determines the state of the PNA.
The PNA is forecasted to move back into a more La Niña-consistent negative phase in mid-late February, so this La Niña is not done with us yet. With Nature behind the wheel, we’re all just along for the ride. However, that’s not going to stop us from trying to figure out where we’re going, and how we got where we are!
Edited for WeatherNation by Mace Michaels
[One-month-average Pacific-North America pattern index (vertical axis) versus the one-month-average Niño-3.4 index (horizontal axis) during Decembers and Januarys, 1950–2022. NOAA Climate graph from CPC data.]
December 2021 featured the strongest negative winter monthly PNA pattern on record (1950–present). Then, in January 2022, the PNA moved into a positive phase, making the largest jump on record from one December to January. Why did the PNA flip? That is a topic for another day. The PNA can be affected by other climate patterns, but, as Michelle says in her earlier post, “a large chunk of the PNA is internally driven.” This means that apparently random, chaotic behavior, aka internal variability, often determines the state of the PNA.
The PNA is forecasted to move back into a more La Niña-consistent negative phase in mid-late February, so this La Niña is not done with us yet. With Nature behind the wheel, we’re all just along for the ride. However, that’s not going to stop us from trying to figure out where we’re going, and how we got where we are!
Edited for WeatherNation by Mace Michaels
On the road again
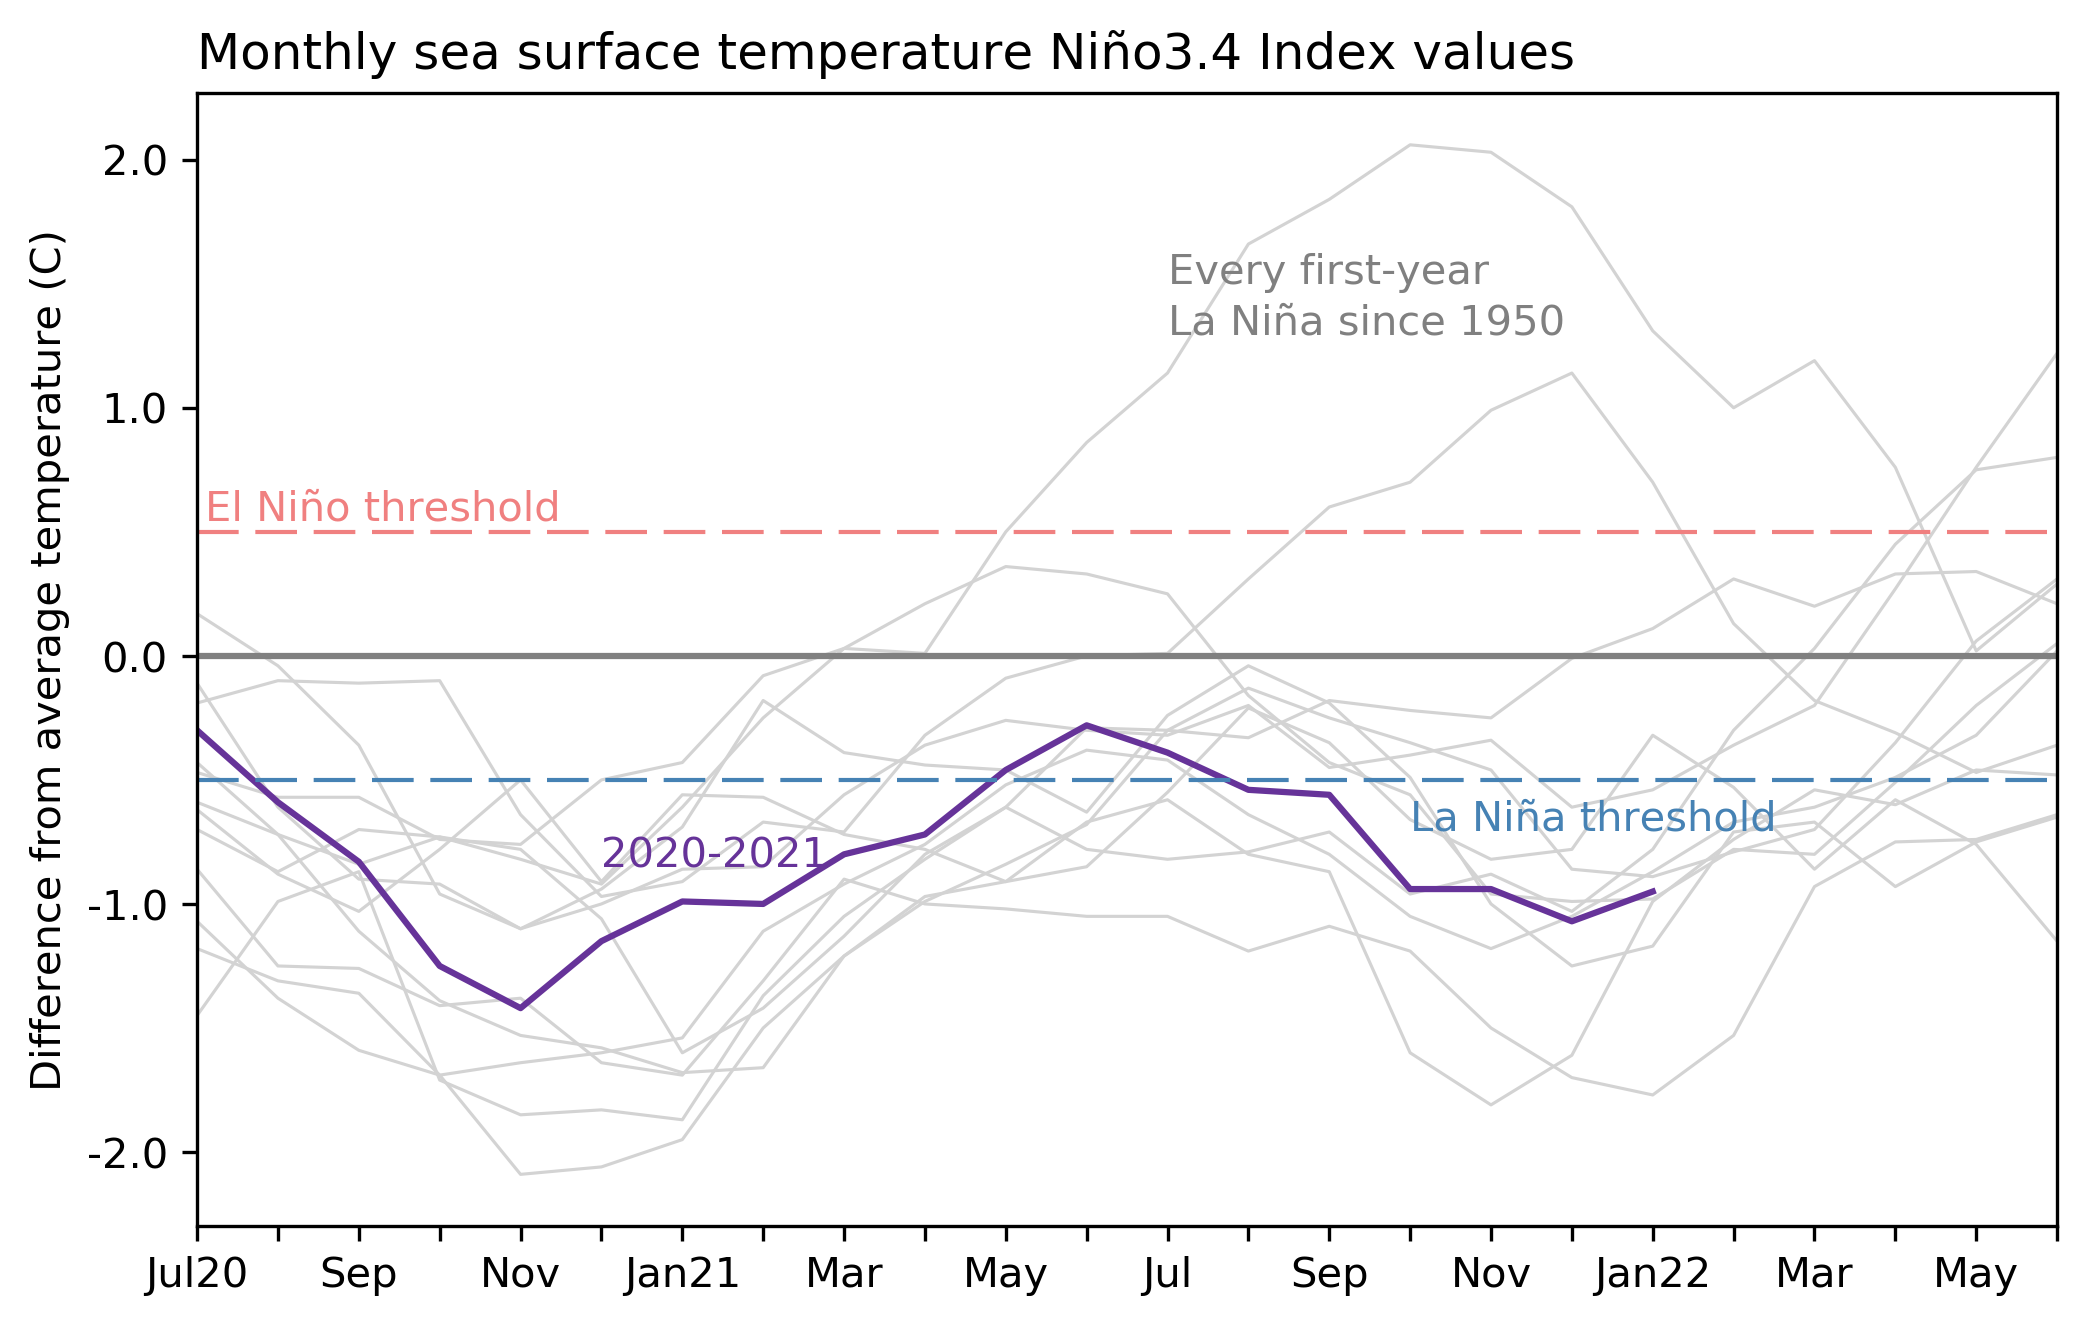
The November–January average Oceanic Niño Index, that is, the three-month-average sea surface temperature anomaly in the Niño-3.4 region of the tropical Pacific, was -1.0 °C. Anomaly means the difference from the long-term average; long-term is currently 1991–2020. This marks our fifth three-month period in a row with an Oceanic Niño Index that exceeds the La Niña threshold of -0.5 °C. Passing this mile marker means this La Niña has persisted long enough to be awarded a bold blue color in our historical table. Congratulations, La Niña 2021–22, already the second La Niña of this young decade.
[Monthly sea surface temperature anomalies (difference from average) in the Niño 3.4 region of the tropical Pacific for 2020-21 (purple line) and all other years (gray lines) starting from first-year La Niña winters since 1950. NOAA Climate graph based on ERSSTv5 temperature data.]
Will there be a third? We still don’t have a very clear picture of that. Right now, there’s a 77% chance that La Niña will last through the spring (March–May), largely based on computer model forecasts and bolstered by a recent uptick in the trade winds. Neutral is most likely for summer (June–August), with a 57% chance. By fall (September–November), neutral still has the edge, but forecasters can’t currently give any category a strong chance.
Every day is a winding road
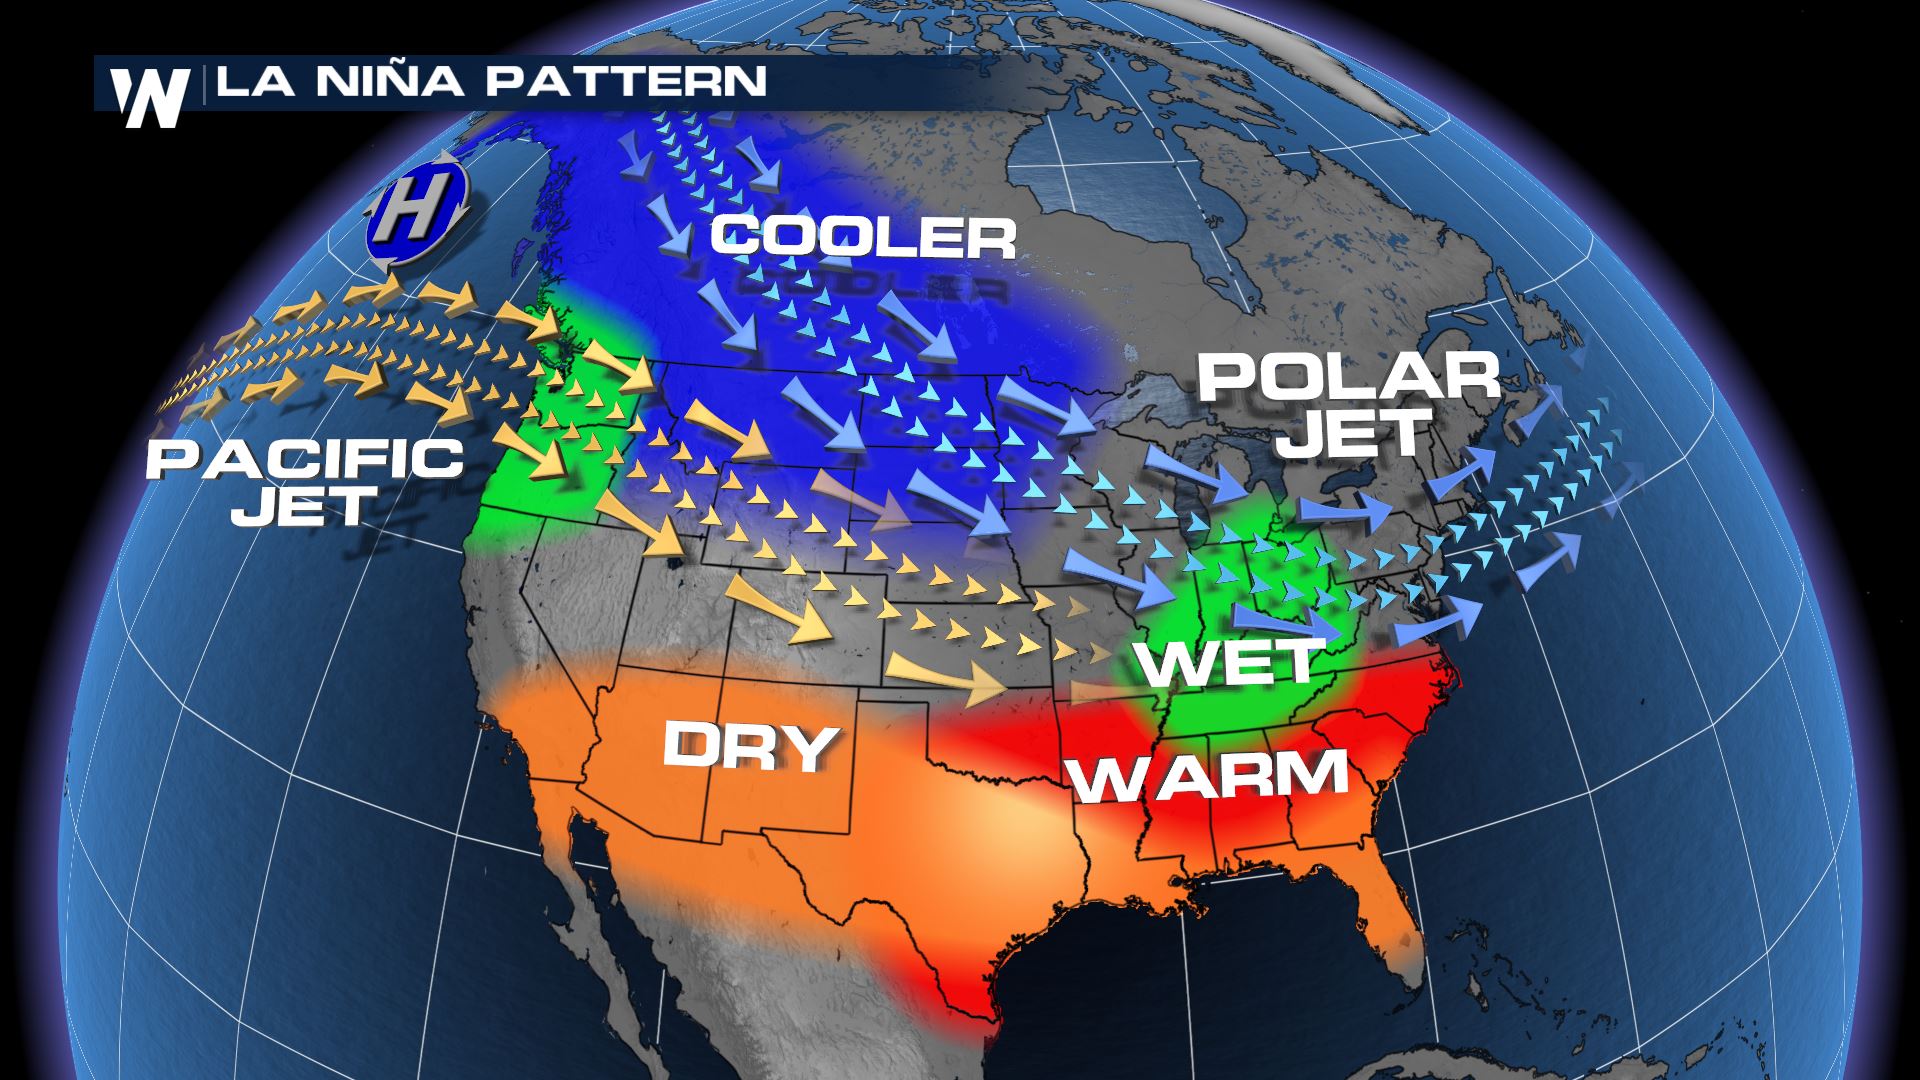
ENSO (El Niño/Southern Oscillation, the entire El Niño/La Niña system) is a seasonal forecaster’s best friend because it changes atmospheric circulation in (somewhat) predictable ways, allowing us to get an early picture of how the average seasonal climate might turn out. For example, during La Niña, the Pacific jet stream tends to be retracted to the west, and high pressure often forms south of Alaska. These effects tend to lead to a colder Northwest/warmer Southeast pattern over North America, along with more rain and snow than average in the Pacific Northwest and Ohio/Tennessee valleys, and drier conditions across the southern tier of states.
[Average location of the jet stream and typical temperature and precipitation impacts during La Niña winter over North America.]
I’m sure you noticed all the qualifying words in the previous paragraph. “Somewhat,” “might,” “tends,” etc. Believe me, I wish we could make stronger statements and more confident predictions! But I try to remember that it’s pretty amazing that we can get any idea of what the average weather might be like months into the future, given our complex and wildly chaotic Earth system. La Niña doesn’t guarantee warmer weather in the southeast or dry conditions in southern California—far from it—but it makes those conditions more likely overall.
There’s more that goes into the seasonal forecast than ENSO, of course, like trends, or other climate patterns. Check out this post on the winter outlook for an overview of the seasonal outlook process, and a set of maps that illustrate just how much outcomes can vary from one La Niña event to another. That said, ENSO has a big imprint on the seasonal forecast. You can see the Climate Prediction Center’s outlook for November–January 2021–22 here.
The November–January average temperature ended up looking a lot like what we’d expect during La Niña: colder than average through Canada, warmer over most of the US. Not exactly the same, but reasonably similar.
[Precipitation difference from the 1991–2020 long-term average during November 2021–January 2022. Precipitation is rain plus the liquid equivalent of snow and ice. Map by NOAA Climate from CPC Global Daily Precipitation data.]
Seasonal climate averages matter—for example, your heating bill is going to reflect if the winter was warmer or colder than average overall. However, sometimes it’s hard to see the forest for the trees, like when you have a December that’s 6° F warmer than average, followed by a hair-pin turn into a January that’s 2° F colder than average. (Hello, Annapolis area!) More on this just a mile down the road.
The precipitation map for November–January also looks a fair bit like the typical La Niña impacts map for this season. Lots of rain and snow in the Pacific Northwest, substantially drier than average through the south-central and southeastern states.
[Precipitation difference from the 1991–2020 long-term average during November 2021–January 2022. Precipitation is rain plus the liquid equivalent of snow and ice. Map by climate.gov from CPC Global Daily Precipitation data.]
Shut up and drive
If we break December and January out individually, we can see some big changes between the two, especially in temperature, and rain/snow in California. For simplicity, I left out November here. You can toggle between the various months for precipitation and temperature in the IRI Maproom.
[Temperature (left maps) and precipitation (right maps) difference from the 1991–2020 average during December 2021 (top row) and January 2022 (bottom row). Maps by NOAA climate from CPC Global Daily Temperature data and CPC Global Daily Precipitation data.]
What’s behind these big swings? It’s tough to do a full attribution in the time I have here, but we do have some thoughts about a culprit. The Pacific-North American pattern (aka the PNA) is a major atmospheric circulation pattern that has a big impact on North American weather. The PNA’s positive phase is primarily characterized by below-average air pressure over the North Pacific and above-average pressure over northwestern North America.
[Air pressure in the lower atmosphere compared to the 1981-2010 average during February 2016 (top), when the PNA was positive, and in February 2019 (bottom), when it was negative. The location of highs and lows and the flow of the jet stream around them often produce a sharp warm-cold split in temperatures in the western and eastern halves of the United States. NOAA Climate, based on data from the Physical Science Lab.]
The negative phase of the PNA is the opposite: higher pressure south of Alaska, lower pressure over Canada. Be sure to check out this post on the PNA, featuring one of our more excellent titles; the PNA Index can be viewed here. During La Niña, the PNA tends to be in its negative phase (that higher pressure over the north Pacific should sound familiar from earlier in this post). However, the PNA can change quickly, so, like the weather, the relationship to ENSO is weaker on a month-to-month basis.
[One-month-average Pacific-North America pattern index (vertical axis) versus the one-month-average Niño-3.4 index (horizontal axis) during Decembers and Januarys, 1950–2022. NOAA Climate graph from CPC data.]
December 2021 featured the strongest negative winter monthly PNA pattern on record (1950–present). Then, in January 2022, the PNA moved into a positive phase, making the largest jump on record from one December to January. Why did the PNA flip? That is a topic for another day. The PNA can be affected by other climate patterns, but, as Michelle says in her earlier post, “a large chunk of the PNA is internally driven.” This means that apparently random, chaotic behavior, aka internal variability, often determines the state of the PNA.
The PNA is forecasted to move back into a more La Niña-consistent negative phase in mid-late February, so this La Niña is not done with us yet. With Nature behind the wheel, we’re all just along for the ride. However, that’s not going to stop us from trying to figure out where we’re going, and how we got where we are!
Edited for WeatherNation by Mace MichaelsAll Weather News
More
Fronts Continue To Spark Severe Weather Across the Plains
A cold front that brought record lows to the
18 Jul 2025 10:40 PM

Extreme Heat Impacts for the East Coast & South
Extreme heat continues to impact several area
18 Jul 2025 10:05 PM

Flooding Threat Remains Elevated in the East
A cold front pushing through the Eastern Seab
18 Jul 2025 9:10 PM

EF-2 Firenado from the Deer Creek Fire in Utah
A fire tornado was spotted near La Sal, Utah
18 Jul 2025 7:30 AM

Tropical System Brings Flood Risk to the Central Gulf
Time has run out for notable tropical develop
18 Jul 2025 3:05 AM

Heavy Rain, Flooding Threat Returns to Florida
Keep the rain boots handy in Florida - heavy
13 Jul 2025 12:50 PM

Severe Storm Risk Pushes into the Great Lakes, Ohio Valley
Friday was another busy day with severe weath
12 Jul 2025 8:00 PM