January 2018 La Niña Update: Summiting the Peak
Special Stories
12 Jan 2018 3:24 PM
From NOAA by Tom Di Liberto
Now that we are smack dab in the middle of winter in the Northern Hemisphere, the time of year when ENSO tends to have its more reliable impacts in the United States, it’s go-time for paying attention to what’s going on in the Pacific. And the latest CPC/IRI ENSO forecast says: La Niña is here to stay for this winter with a 85-95% probability before transitioning to ENSO-Neutral conditions during the spring.
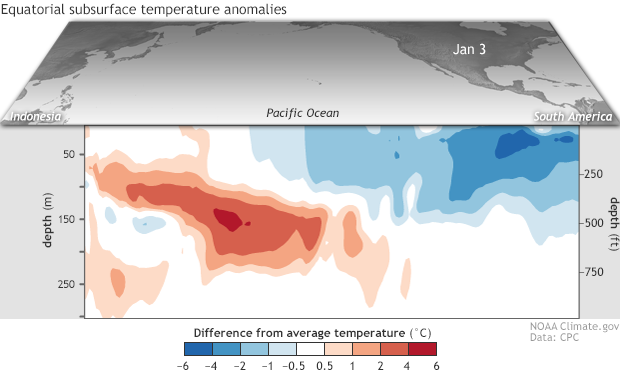 [Departure from average of the surface and subsurface tropical Pacific sea temperature averaged over 5-day periods centered on January 3, 2018. The vertical axis is depth below the surface (meters) and the horizontal axis is longitude, from the western to eastern tropical Pacific. This cross-section is right along the equator.]
If there is one thing to pay attention to moving forward, though, it’s the eastward movement along the equator of warmer than average water at depth in the ocean. This could eventually undercut the ongoing La Niña in the central and eastern Pacific Ocean and help to bring an end to the event.
[Departure from average of the surface and subsurface tropical Pacific sea temperature averaged over 5-day periods centered on January 3, 2018. The vertical axis is depth below the surface (meters) and the horizontal axis is longitude, from the western to eastern tropical Pacific. This cross-section is right along the equator.]
If there is one thing to pay attention to moving forward, though, it’s the eastward movement along the equator of warmer than average water at depth in the ocean. This could eventually undercut the ongoing La Niña in the central and eastern Pacific Ocean and help to bring an end to the event.
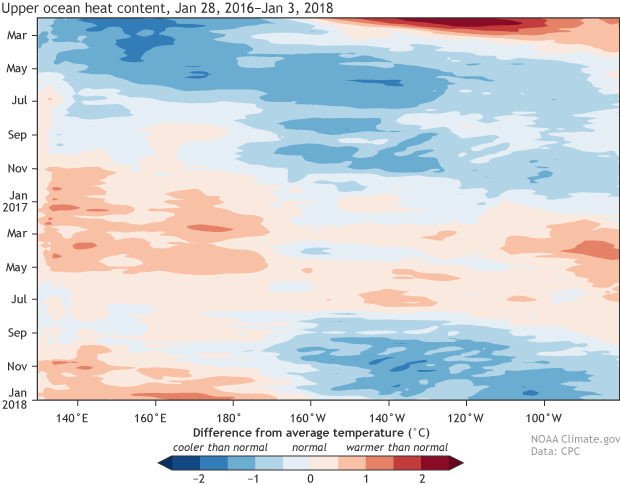 [Heat content in the upper few hundred meters of the tropical Pacific near the equator (5°N-5°S) from January 28, 2016 (top of image) through January 3, 2018 (bottom of image) compared to the 1981-2010 average. The western Pacific is on the left; the eastern Pacific is on the right. Each row of the image shows a 5-day average. Scan the image from top to bottom, and you can see the "double dip" La Niña (two areas of colder than average temperatures) in the central-eastern Pacific. (Still not quite sure what you're looking at? Read more about Hovmoller diagrams.) NOAA image, based on data provided by the Climate Prediction Center.]
However, it’s that brief period of warming that makes this double dip so unique. There have been 7 double-dip La Niña’s on record back to 1950 but none that warmed that much in between. Does this have some over-arching meaning? Not necessarily. But it does reflect an important point about our knowledge of ENSO.
While we constantly harp on the idea that no two La Niñas or El Niños are alike, it’s important to also remember that we simply do not have a ton of events to look back on. After all, who’s to say that the evolution of this double-dip La Niña is so rare when we’ve only documented 7 cases?
[Heat content in the upper few hundred meters of the tropical Pacific near the equator (5°N-5°S) from January 28, 2016 (top of image) through January 3, 2018 (bottom of image) compared to the 1981-2010 average. The western Pacific is on the left; the eastern Pacific is on the right. Each row of the image shows a 5-day average. Scan the image from top to bottom, and you can see the "double dip" La Niña (two areas of colder than average temperatures) in the central-eastern Pacific. (Still not quite sure what you're looking at? Read more about Hovmoller diagrams.) NOAA image, based on data provided by the Climate Prediction Center.]
However, it’s that brief period of warming that makes this double dip so unique. There have been 7 double-dip La Niña’s on record back to 1950 but none that warmed that much in between. Does this have some over-arching meaning? Not necessarily. But it does reflect an important point about our knowledge of ENSO.
While we constantly harp on the idea that no two La Niñas or El Niños are alike, it’s important to also remember that we simply do not have a ton of events to look back on. After all, who’s to say that the evolution of this double-dip La Niña is so rare when we’ve only documented 7 cases?
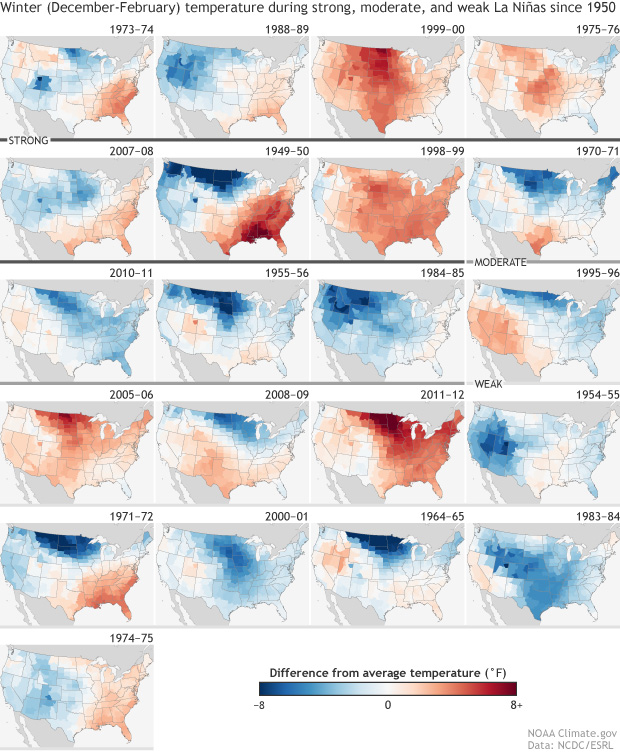 [December-February temperatures compared to the 1981-2010 average during each La Niña winter since records began in 1950. Gray lines under the maps indicate event strength: strong (dark gray), moderate (medium gray), and weak (light gray). NOAA Climate.gov image based on climate division data from NOAA ESRL. ]
And this is also true for those images of what a La Niña winter might bring to the United States. As shown in previous articles, there is considerable variability when it comes to the temperature and precipitation patterns during a La Niña winter. The figure we often look at is an average of all of those events, but we don’t know whether the number of events we have in our historical record fully encapsulates the possibilities. This is yet another reason why we issue our outlooks in terms of probabilities.
[December-February temperatures compared to the 1981-2010 average during each La Niña winter since records began in 1950. Gray lines under the maps indicate event strength: strong (dark gray), moderate (medium gray), and weak (light gray). NOAA Climate.gov image based on climate division data from NOAA ESRL. ]
And this is also true for those images of what a La Niña winter might bring to the United States. As shown in previous articles, there is considerable variability when it comes to the temperature and precipitation patterns during a La Niña winter. The figure we often look at is an average of all of those events, but we don’t know whether the number of events we have in our historical record fully encapsulates the possibilities. This is yet another reason why we issue our outlooks in terms of probabilities.
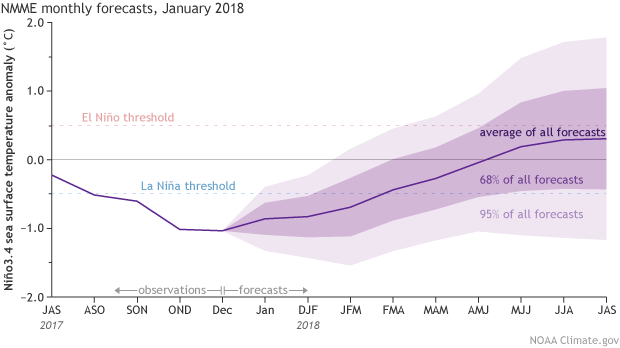 [Climate model forecasts for the Niño3.4 Index, from the North American Multi-Model Ensemble (NMME). Darker purple envelope shows the range of 68% of all model forecasts; lighter purple shows the range of 95% of all model forecasts. NOAA image from CPC data.]
It's time to go over what’s going on in the Pacific
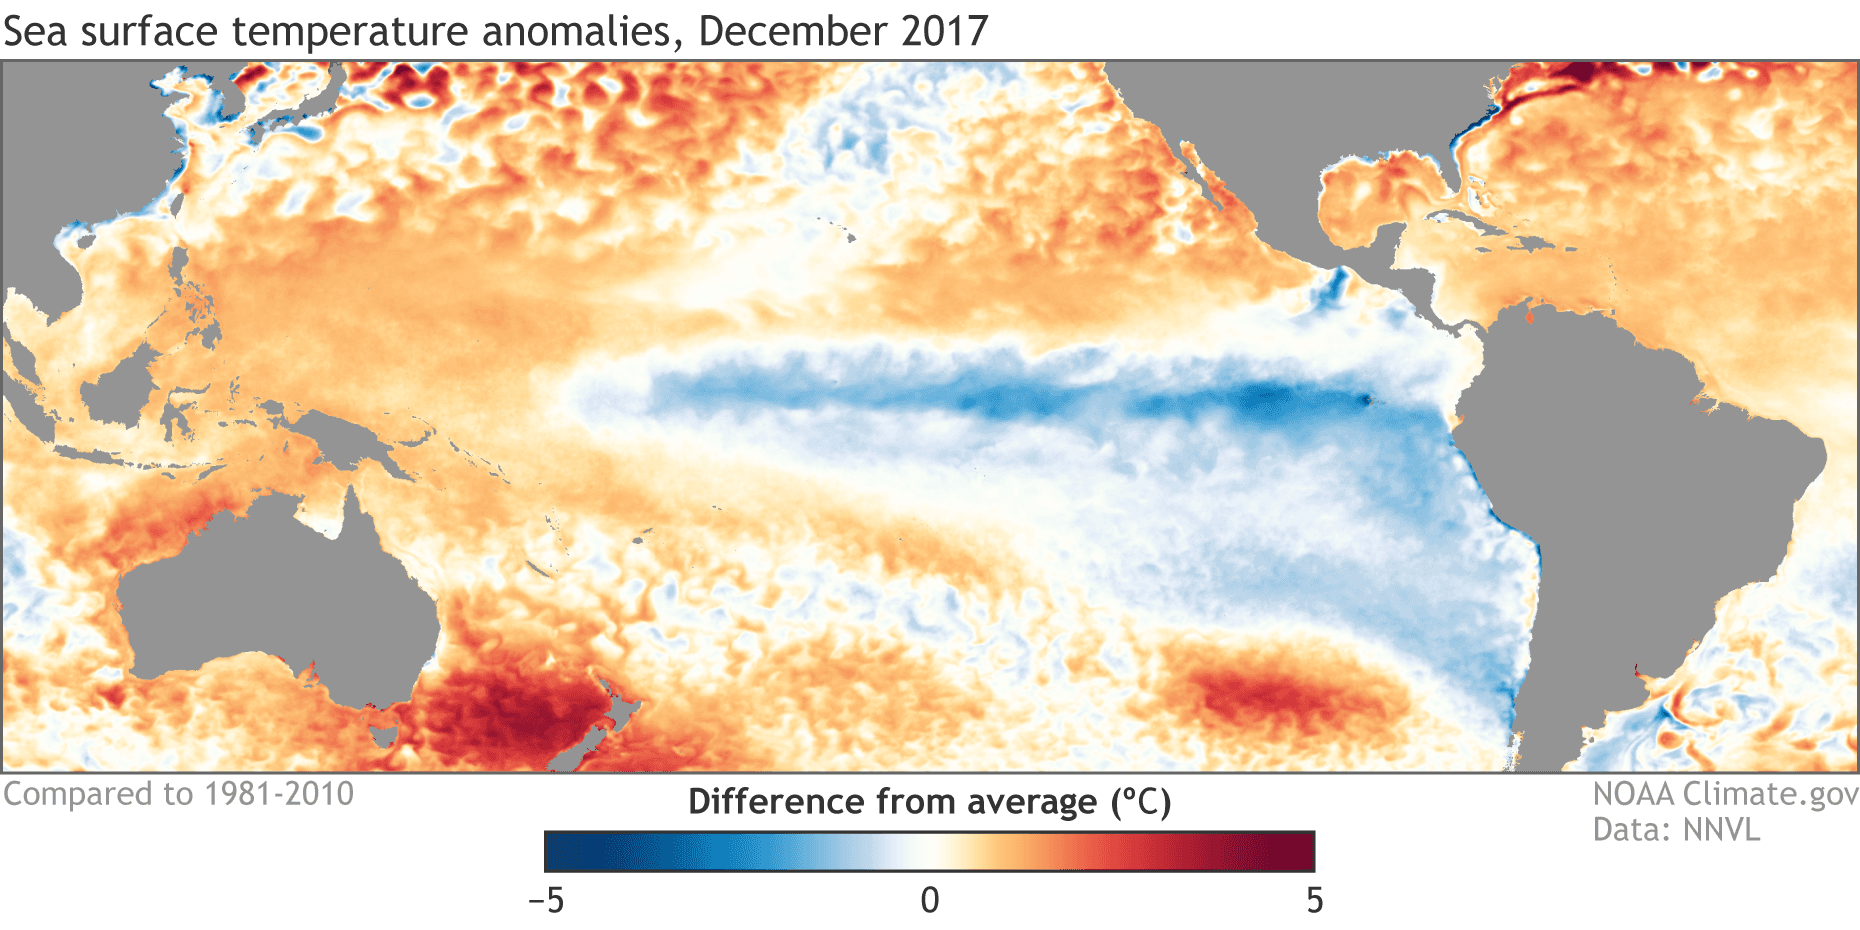
We are certainly in the midst of a La Niña event as sea surface temperatures across the central/equatorial Pacific continue to remain colder than average. In fact, in December the SSTs in the Niño3.4 region—the box in the Pacific Ocean where we look for La Niña or El Niño conditions—were around 1°C cooler than average for the second consecutive month. Three-month average anomalies of 1°C mark the cutoff between weak and moderate ENSO events, putting this La Niña on the cusp of a moderate event, should the anomalies last one more month. Of course, we can’t forget that La Niña is a coupled ocean-atmospheric system. So what is the atmosphere doing? For the month of December, the thunderstorm activity across the equatorial Pacific looked pretty La Niña-like with reduced precipitation near the date-line and farther east while enhanced precipitation fell across the broader Maritime continent in the western Pacific Ocean. Backing this up, the Equatorial Southern Oscillation Index, which monitors areas closely related to ENSO along the equator, measured 0.9 for December. Positive values reflect lower than average pressure in the western Pacific and higher than average pressure in the central/eastern Pacific Ocean (2).
[Departure from average of the surface and subsurface tropical Pacific sea temperature averaged over 5-day periods centered on January 3, 2018. The vertical axis is depth below the surface (meters) and the horizontal axis is longitude, from the western to eastern tropical Pacific. This cross-section is right along the equator.]
If there is one thing to pay attention to moving forward, though, it’s the eastward movement along the equator of warmer than average water at depth in the ocean. This could eventually undercut the ongoing La Niña in the central and eastern Pacific Ocean and help to bring an end to the event.
Pop quiz on last month’s post: what do we mean by "double-dip" La Niña?
As Emily noted last month, this year’s La Niña followed closely behind the previous La Niña, which weakly petered out by Winter 2017. This is called a double-dip La Niña and can be seen clearly in the Hovmöller image above of the heat content in the equatorial Pacific. The 2016-2018 double dipping—here it’s not a party foul—is represented by the two areas of colder than average ocean heat content that sandwich a brief period of warmer than average conditions.
[Heat content in the upper few hundred meters of the tropical Pacific near the equator (5°N-5°S) from January 28, 2016 (top of image) through January 3, 2018 (bottom of image) compared to the 1981-2010 average. The western Pacific is on the left; the eastern Pacific is on the right. Each row of the image shows a 5-day average. Scan the image from top to bottom, and you can see the "double dip" La Niña (two areas of colder than average temperatures) in the central-eastern Pacific. (Still not quite sure what you're looking at? Read more about Hovmoller diagrams.) NOAA image, based on data provided by the Climate Prediction Center.]
However, it’s that brief period of warming that makes this double dip so unique. There have been 7 double-dip La Niña’s on record back to 1950 but none that warmed that much in between. Does this have some over-arching meaning? Not necessarily. But it does reflect an important point about our knowledge of ENSO.
While we constantly harp on the idea that no two La Niñas or El Niños are alike, it’s important to also remember that we simply do not have a ton of events to look back on. After all, who’s to say that the evolution of this double-dip La Niña is so rare when we’ve only documented 7 cases?
[December-February temperatures compared to the 1981-2010 average during each La Niña winter since records began in 1950. Gray lines under the maps indicate event strength: strong (dark gray), moderate (medium gray), and weak (light gray). NOAA Climate.gov image based on climate division data from NOAA ESRL. ]
And this is also true for those images of what a La Niña winter might bring to the United States. As shown in previous articles, there is considerable variability when it comes to the temperature and precipitation patterns during a La Niña winter. The figure we often look at is an average of all of those events, but we don’t know whether the number of events we have in our historical record fully encapsulates the possibilities. This is yet another reason why we issue our outlooks in terms of probabilities.
[Climate model forecasts for the Niño3.4 Index, from the North American Multi-Model Ensemble (NMME). Darker purple envelope shows the range of 68% of all model forecasts; lighter purple shows the range of 95% of all model forecasts. NOAA image from CPC data.]
What’s going to happen to La Niña this year?
But enough looking back. Let’s look forward. Dynamical models are confident that La Niña will continue during the Northern Hemisphere winter. Although, it does appear to have peaked in strength as expected because ENSO events typically peak during the winter. As we move into the spring, there is considerable uncertainty as to the direction of ENSO. And by the summer, the model forecasts show quite a range of potential outcomes with some models forecasting an El Niño, some predicting Neutral, while others expect La Niña. This sort of uncertainty is not uncommon the farther we look into the future. Hopefully, as we approach spring and summer, this uncertainty will decrease. https://www.youtube.com/watch?v=fAvk4RXrW_EFootnotes
(1) Boo Tom! Where’s Emily? Emily is currently with thousands of other meteorologists at the annual meeting of the American Meteorological Society and therefore has handed off blogging duties to me, the author of such high energy posts like three separate articles on how we verify forecasts. I know…It’s not ideal. (2) However, the Southern Oscillation Index (SOI) which measures the pressure differences between Tahiti and Darwin, Australia, fell from a La Niña reflecting value of 0.9 in November to a neutral -0.1 value in December. Because the SOI uses locations that are not directly along the equator, these numbers could be influenced by other atmospheric phenomena related to the mid-latitudes and unrelated to ENSO. And in fact, we had an MJO event throughout December, which may have influenced the SOI. Edited for WeatherNation by Meteorologist Mace MichaelsAll Weather News
More
Fronts Continue To Spark Severe Weather Across the Plains
A cold front that brought record lows to the
18 Jul 2025 10:40 PM

Extreme Heat Impacts for the East Coast & South
Extreme heat continues to impact several area
18 Jul 2025 10:05 PM

Flooding Threat Remains Elevated in the East
A cold front pushing through the Eastern Seab
18 Jul 2025 9:10 PM

EF-2 Firenado from the Deer Creek Fire in Utah
A fire tornado was spotted near La Sal, Utah
18 Jul 2025 7:30 AM

Tropical System Brings Flood Risk to the Central Gulf
Time has run out for notable tropical develop
18 Jul 2025 3:05 AM

Heavy Rain, Flooding Threat Returns to Florida
Keep the rain boots handy in Florida - heavy
13 Jul 2025 12:50 PM

Severe Storm Risk Pushes into the Great Lakes, Ohio Valley
Friday was another busy day with severe weath
12 Jul 2025 8:00 PM