January El Nino Update: New Year, New You
Special Stories
15 Jan 2020 12:30 AM
[NOAA by Emily Becker] Ocean and atmosphere conditions in the tropical Pacific are El Nino neutral, and forecasters favor neutral through the spring. Wait, don’t go! As usual, there’s a lot more to the El Nino story.
 Most climate models predict that the Niño3.4 sea surface temperature will stay above the long-term average for a couple more months, hovering around the El Niño threshold, before decreasing to near-average through the spring. We’re not yet into the time of year when we have to worry about the spring predictability barrier (essentially, dynamical model forecasts made during April and May tend to be less reliable than those made during other times of the year), lending weight to these predictions.
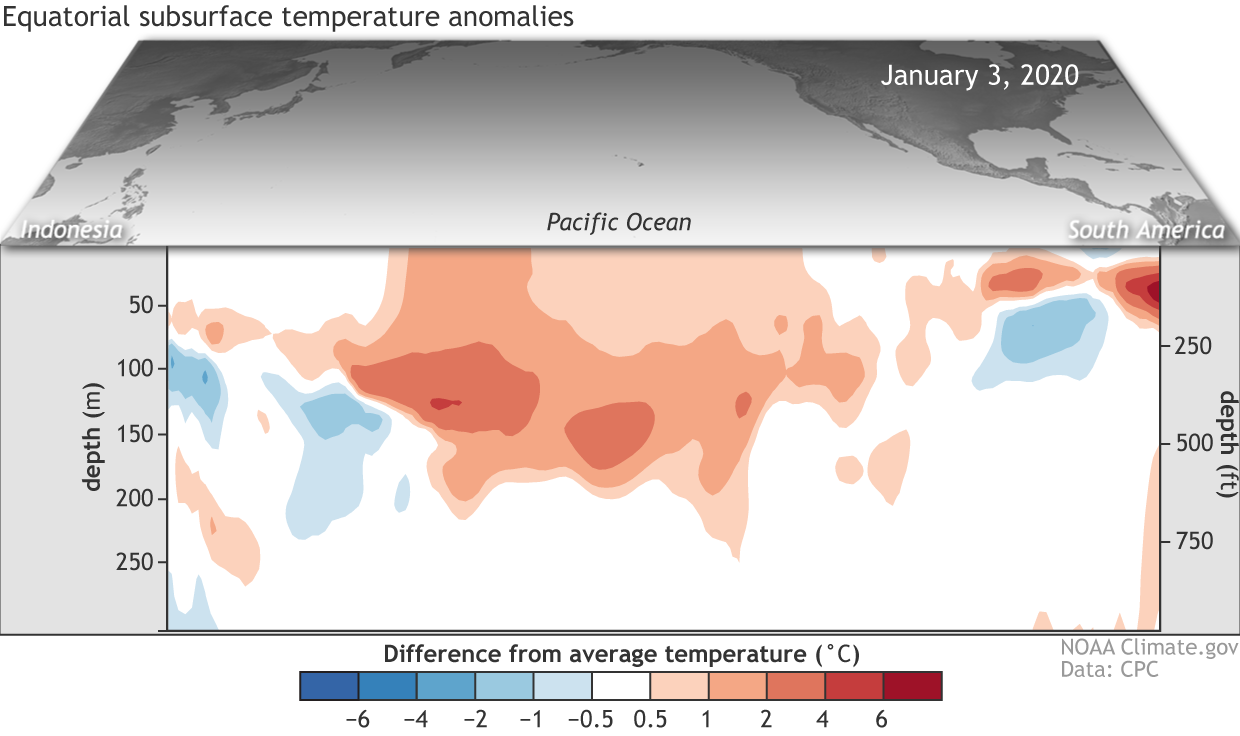
Based in large part on these model predictions, forecasters estimate a greater than 50% chance the November–January and December–February Oceanic Niño Index values will be about 0.5°C above average. A downwelling Kelvin wave that will continue moving eastward under the surface of the tropical Pacific over the next month or so will also provide a source of warmer-than-average water to keep the surface temperature elevated for at least another month or two.
Most climate models predict that the Niño3.4 sea surface temperature will stay above the long-term average for a couple more months, hovering around the El Niño threshold, before decreasing to near-average through the spring. We’re not yet into the time of year when we have to worry about the spring predictability barrier (essentially, dynamical model forecasts made during April and May tend to be less reliable than those made during other times of the year), lending weight to these predictions.
Based in large part on these model predictions, forecasters estimate a greater than 50% chance the November–January and December–February Oceanic Niño Index values will be about 0.5°C above average. A downwelling Kelvin wave that will continue moving eastward under the surface of the tropical Pacific over the next month or so will also provide a source of warmer-than-average water to keep the surface temperature elevated for at least another month or two.
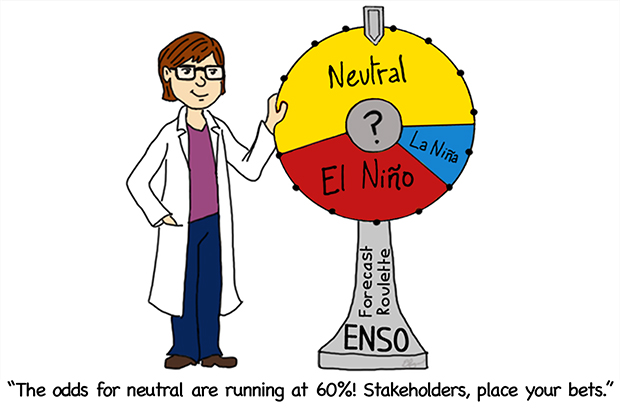
 After that, the largest share of the probability pie, about 60%, goes to neutral, meaning Oceanic Niño Index between -0.5°C and 0.5°C. What all this boils down to is that forecasters do not expect the current warmer equatorial Pacific water to develop into a full-blown El Niño. That said, the recent warm surface conditions do bear monitoring, and the chance of El Niño through the spring is estimated at about 30%. La Niña has the smallest chance of developing through the spring, at around 10%.
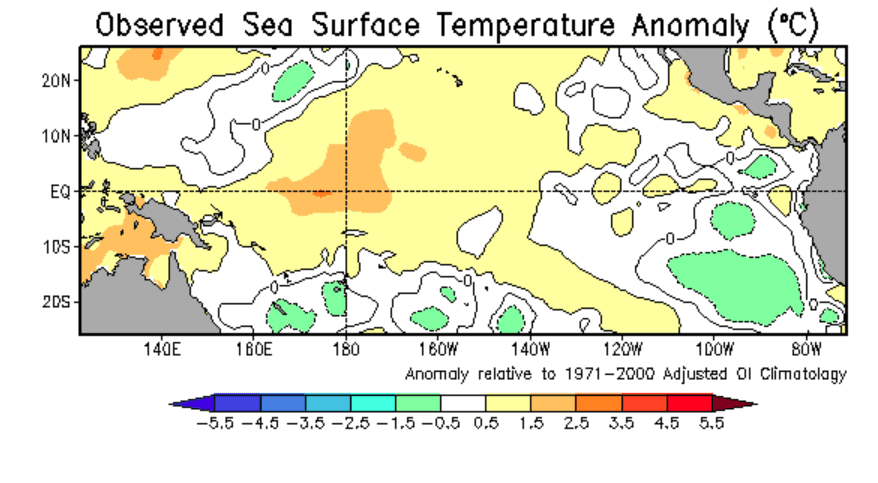
 Colder-than-average water in the eastern Indian Ocean and the islands of Southeast Asia—the “Maritime Continent”—has the effect of suppressing convection, meaning there is less rising air, cloud formation, and rain than usual. This contributed to the devastating fire conditions Australia has experienced over the past few months. As the positive Indian Ocean Dipole has weakened, convection has re-emerged over the Maritime Continent in the last week.
Get organized
The sea surface temperature in the Niño3.4 region in the east-central equatorial Pacific, our primary location for monitoring the El Niño-Southern Oscillation (ENSO) climate phenomenon, has been above average for a few months now. In fact, the 3-month-average (the Oceanic Niño Index) in October–December was 0.46°C above normal, which rounds to 0.5°C. “Hey!” you say. “Isn’t that the El Niño threshold?” Indeed it is, but of course El Niño requires more than a couple months of above-average sea surface temperature. According to the El Niño criteria, we also need an expectation that the sea surface temperature will stay above the threshold for several more seasons. (In climate-speak, “season” is any three-month-average period.) In addition, there’s that pesky requirement that the tropical Pacific atmospheric circulation shows a response.
[Summary of decision process in determining El Niño conditions. NOAA Climate drawing by Glen Becker and Fiona Martin.]
[Departure from average of the surface and subsurface tropical Pacific sea temperature averaged over the 5-day period centered on January 3, 2020. The vertical axis is depth below the surface (meters) and the horizontal axis is longitude, from the western to eastern tropical Pacific. This cross-section is right along the equator. A downwelling (warm anomaly) Kelvin wave is moving across the equatorial Pacific Ocean. NOAA Climate figure from CPC data.]
Embrace uncertainty
All this “x chance of whatever,” “y chance of some other whatever” can seem unnecessarily complicated. Wouldn’t it be easier if our forecast just said “neutral will remain” or “La Niña is coming,” sort of like how your weather forecast just says “high of 70°F tomorrow?” Perhaps, but it wouldn’t give a complete picture of the possible futures. When we’re making climate forecasts the future is just more uncertain. By assigning probabilities to each of the three categories, forecasters can provide decision-makers with potentially useful information. Knowing that neutral is most likely (6-in-10 chance) but there is still a 3-in-10 chance of El Niño advises people to remain attentive to this potential. For more on how to understand probabilistic forecasts, check out Tony and Michelle’s posts “Why do ENSO forecasts use probabilities” and “Betting on climate predictions.”
[Illustration by Emily Greenhalgh, NOAA Climate]
Exercise more
Over the few weeks, the positive Indian Ocean Dipole pattern (colder-than-average water in the eastern Indian Ocean, warmer-than-average in the western Indian Ocean) has finally abated.
[Animation showing sea surface temperature departure from the long-term average from September 2019 through early January 2020. Graphic by NOAA Climate; data from NOAA’s Environmental Visualization Lab.]
Learn a new hobby
Our resolution is the same as ever—keep you updated on all things ENSO. And maybe get to the gym a little more often….All Weather News
More
Western Heat Wave Pushes into Work Week
Another ridge of high pressure is parked over
16 Jun 2026 2:25 AM

Chances of Tropical Development Increase in the Atlantic
AtlanticThe first area of investigation of th
16 Jun 2026 2:20 AM


Welcome To Monsoon Season - Here's What to Expect
WELCOME TO THE NORTH AMERICAN MONSOON SEASON.
15 Jun 2026 8:00 PM

El Niño Forms, Very Strong El Niño Likely Late 2026
El Niño has arrived! It didn't take long for
15 Jun 2026 8:00 AM

Confirmed Tornadoes in Ohio and Pennsylvania on Sunday
A cold front on Sunday brought severe weather
15 Jun 2026 1:50 AM