July La Niña Update: Comic Timing
Special Stories
31 Jul 2022 1:00 AM
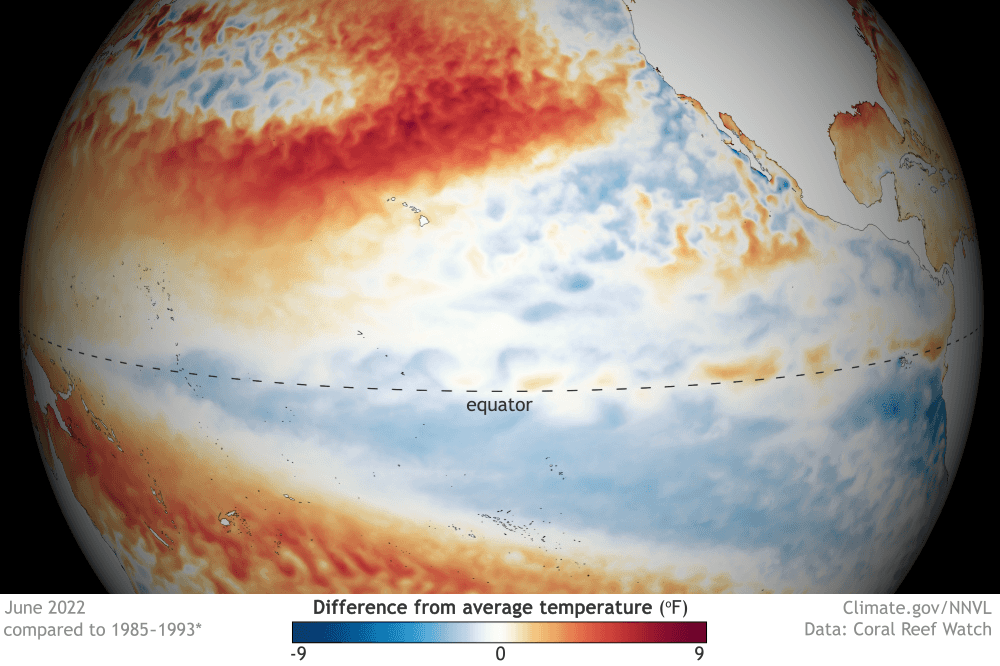
[Sea surface temperatures around the equator in the central and eastern Pacific were mostly cooler than average (blue) in June 2022. A few warm pockets (orange) dotted the far eastern Pacific. NOAA Climate map from our Data Snapshots collection.]
[From NOAA Climate written by Emily Becker] I’m in San Diego this week, gazing out across the Pacific toward La Niña’s cool tropical ocean surface. (I’m not here for Comic-Con, but there are a lot of posters around the city that keep that upcoming event in the forefront.) Just over my horizon, La Niña—the cool phase of the El Niño-Southern Oscillation (“ENSO” for short)—remains in force, despite some warming in the sea surface temperature over the past month or so. Forecasters expect La Niña to continue through the summer and into the fall and early winter.
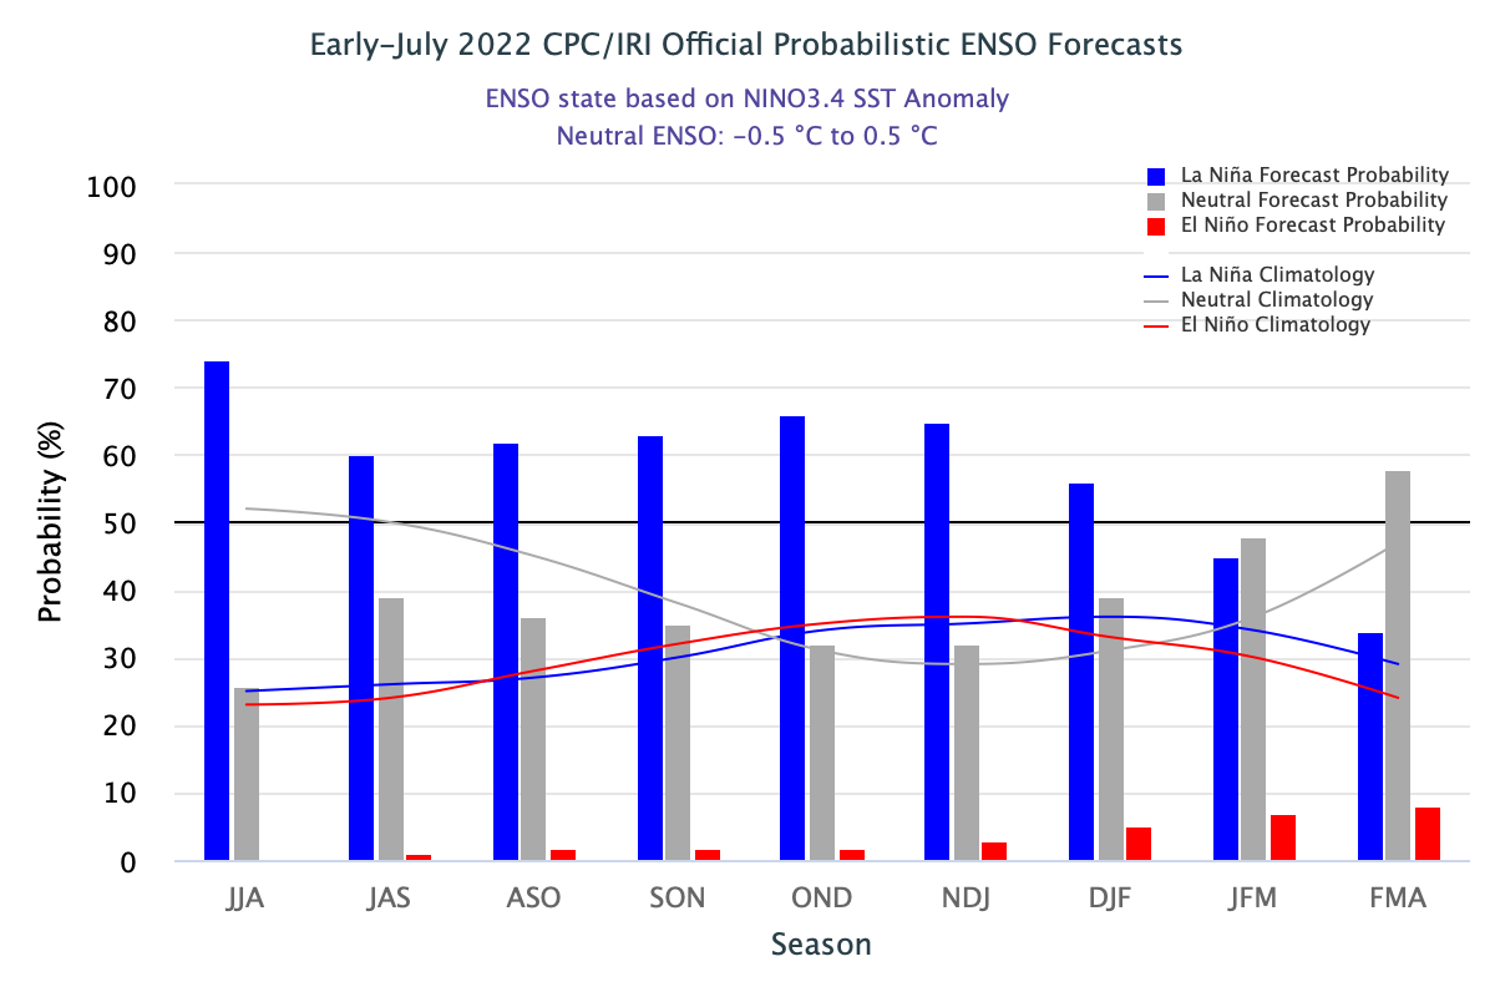 [The official CPC/IRI ENSO probability forecast. The bars show the seasonal chances for each possible ENSO state—El Niño (red), La Niña (blue), and neutral (gray)—from spring 2022 through winter 2022–23. The forecast is based on a consensus of CPC and IRI forecasters, and it is updated during the first half of the month, in association with the official CPC/IRI ENSO Diagnostic Discussion. It is based on observational and predictive information from early in the month and from the previous month. Image from IRI.]
While we’re doing the numbers, let’s see how La Niña measured up last month. As I mentioned above, the cool sea surface temperature anomaly weakened a bit in June, but remained in La Niña territory. (Anomaly = difference from the long-term average, long-term being 1991–2020 here, and the La Niña threshold is -0.5 °Celsius, which is just shy of 1 degree Fahrenheit.) According to the ERSSTv5, our most consistent sea surface temperature dataset, June’s sea surface temperature anomaly in the Niño-3.4 region was -0.8 °C. This is the 7th-strongest negative June anomaly in our 1950–present record.
[The official CPC/IRI ENSO probability forecast. The bars show the seasonal chances for each possible ENSO state—El Niño (red), La Niña (blue), and neutral (gray)—from spring 2022 through winter 2022–23. The forecast is based on a consensus of CPC and IRI forecasters, and it is updated during the first half of the month, in association with the official CPC/IRI ENSO Diagnostic Discussion. It is based on observational and predictive information from early in the month and from the previous month. Image from IRI.]
While we’re doing the numbers, let’s see how La Niña measured up last month. As I mentioned above, the cool sea surface temperature anomaly weakened a bit in June, but remained in La Niña territory. (Anomaly = difference from the long-term average, long-term being 1991–2020 here, and the La Niña threshold is -0.5 °Celsius, which is just shy of 1 degree Fahrenheit.) According to the ERSSTv5, our most consistent sea surface temperature dataset, June’s sea surface temperature anomaly in the Niño-3.4 region was -0.8 °C. This is the 7th-strongest negative June anomaly in our 1950–present record.
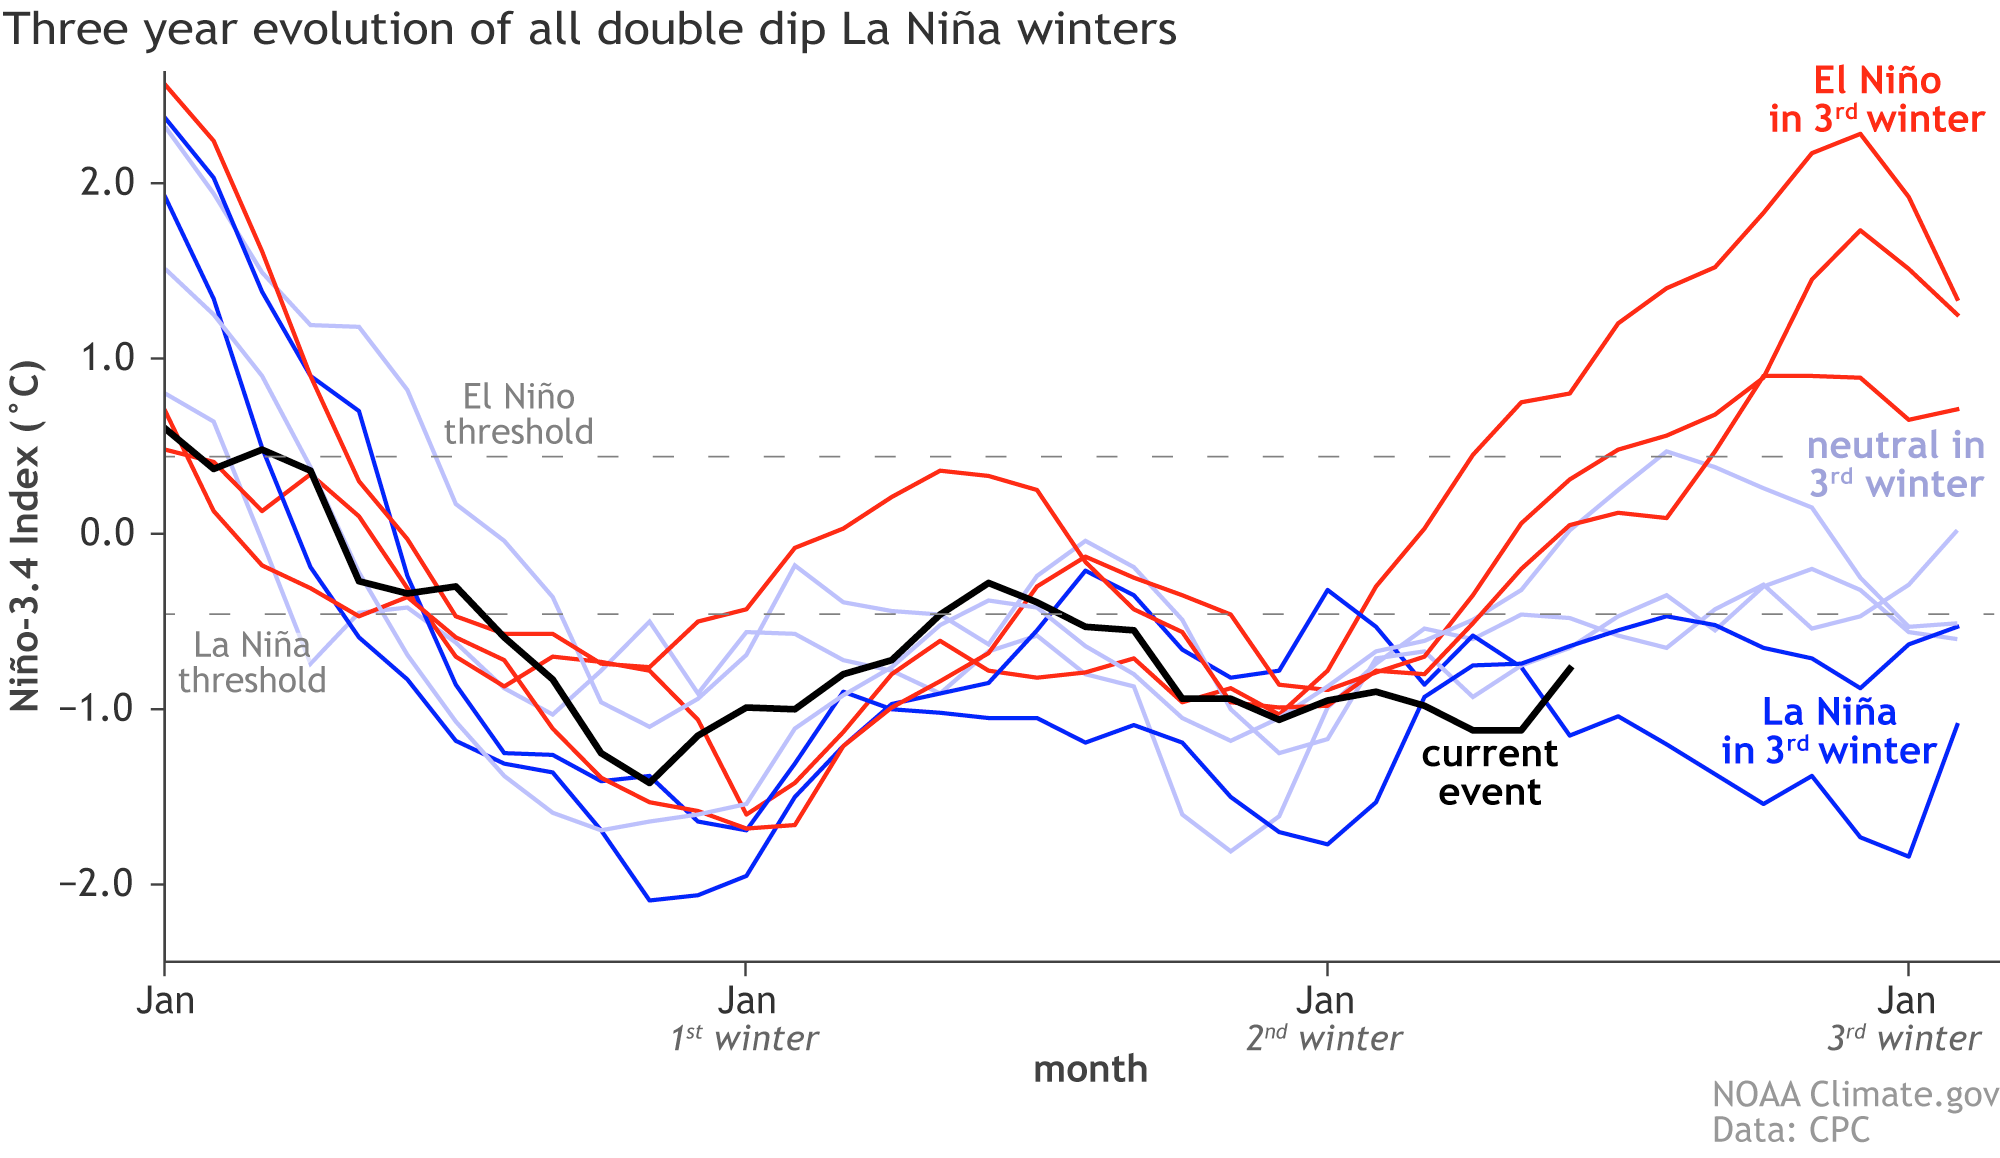 [Three-year history of sea surface temperatures in the Niño-3.4 region of the tropical Pacific for 8 previous double-dip La Niña events. The color of the line shows the ENSO state in the third winter (red: El Niño, darker blue: La Niña, lighter blue: neutral). The black line shows the current event. Monthly Niño-3.4 index is from CPC using ERSSTv5. Time series comparison was created by Michelle L’Heureux, and modified by NOAA Climate.]
This recent weakening in the Niño-3.4 anomaly—it was -1.1 °C in May—is partly due to a slight diminishment of the trade winds, the prevailing east-to-west winds near the Equator, in the first half of June. When the trade winds weaken, wind-driven evaporative cooling slows and the surface warms. Also, a fairly weak downwelling Kelvin wave, a region of warmer-than-average water under the surface, has been moving from west to east over the past few months , gradually rising toward the surface.
The trade winds re-strengthened over the second half of June, and remain stronger than average as we go to press. This will likely help to cool the surface, and may contribute to an upwelling Kelvin wave, a region of cooler-than-average subsurface water that moves west to east. Along with being a sign that La Niña’s amped-up Walker circulation—the atmospheric response to La Niña’s cooler sea surface—is still present, the stronger trades are a source of confidence in the forecast for La Niña to continue through the summer.
[Three-year history of sea surface temperatures in the Niño-3.4 region of the tropical Pacific for 8 previous double-dip La Niña events. The color of the line shows the ENSO state in the third winter (red: El Niño, darker blue: La Niña, lighter blue: neutral). The black line shows the current event. Monthly Niño-3.4 index is from CPC using ERSSTv5. Time series comparison was created by Michelle L’Heureux, and modified by NOAA Climate.]
This recent weakening in the Niño-3.4 anomaly—it was -1.1 °C in May—is partly due to a slight diminishment of the trade winds, the prevailing east-to-west winds near the Equator, in the first half of June. When the trade winds weaken, wind-driven evaporative cooling slows and the surface warms. Also, a fairly weak downwelling Kelvin wave, a region of warmer-than-average water under the surface, has been moving from west to east over the past few months , gradually rising toward the surface.
The trade winds re-strengthened over the second half of June, and remain stronger than average as we go to press. This will likely help to cool the surface, and may contribute to an upwelling Kelvin wave, a region of cooler-than-average subsurface water that moves west to east. Along with being a sign that La Niña’s amped-up Walker circulation—the atmospheric response to La Niña’s cooler sea surface—is still present, the stronger trades are a source of confidence in the forecast for La Niña to continue through the summer.
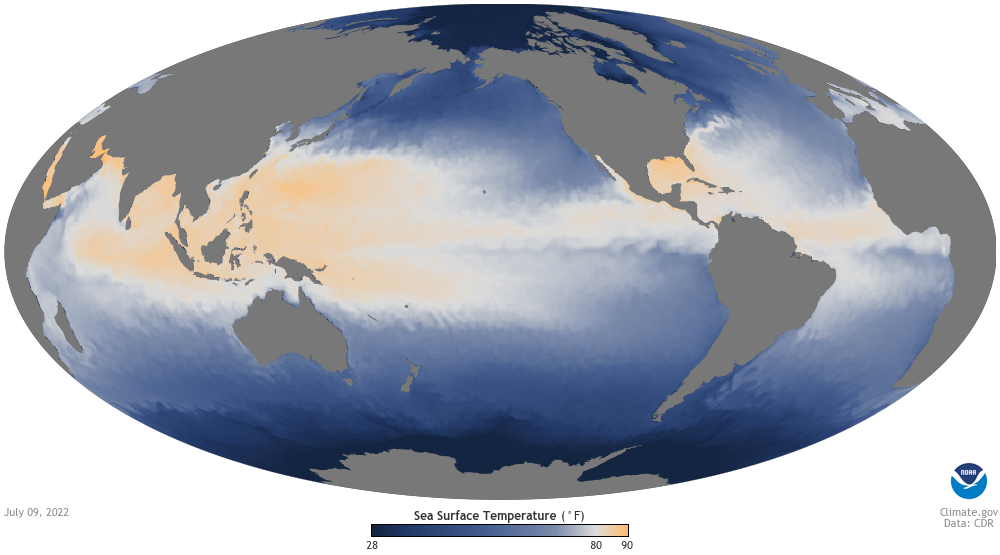 [Sea surface temperatures the week of July 9, 2022, showing the warm-to-cool gradient in temperatures across the tropical Pacific Ocean from west to east. Temperatures in the West Pacific Warm Pool, around the Maritime Continent, are above 80 degrees Fahrenheit (yellow-orange), while a cooler tongue of water (blue) extends from the coast of South America to the central Pacific. The prevailing east-to-west trade winds near the equator create this temperature contrast by pushing warm water west and allowing deeper, cooler water to well up to the surface. NOAA Climate image from our Data Snapshots collection.]
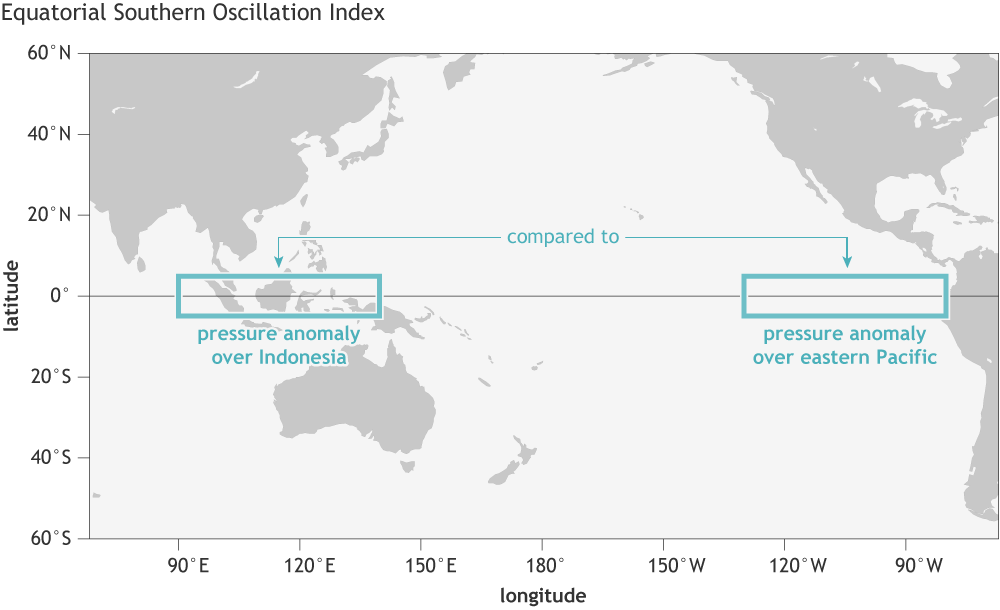 [The Equatorial Southern Oscillation Index compares pressure anomalies across a broad region of the eastern tropical Pacific (5 degrees North and South latitude, 80–130 degrees West longitude) to pressure anomalies on the other side of the basin (5 degrees North and South latitude, 90–140 degrees East longitude). NOAA Climate image by Fiona Martin.]
When this index is positive, it means the pressure is relatively higher in the east and lower in the west, indicating a stronger Walker circulation. June 2022 tied for third strongest on record (1950–present), which got me wondering about the relationship between the strength of the Walker circulation in the summer to the Niño-3.4 index in the following early winter.
It turns out that the June EQSOI has a correlation of about 0.7 with the Niño-3.4 index in the following November–January period. This is a fairly strong correlation, but by no means does it guarantee any particular November-January outcome. The other tied-for-third June, 2013, was followed by an ENSO-neutral winter. Most other Junes in the range of the 2022 value were followed by La Niña winters, though.
[The Equatorial Southern Oscillation Index compares pressure anomalies across a broad region of the eastern tropical Pacific (5 degrees North and South latitude, 80–130 degrees West longitude) to pressure anomalies on the other side of the basin (5 degrees North and South latitude, 90–140 degrees East longitude). NOAA Climate image by Fiona Martin.]
When this index is positive, it means the pressure is relatively higher in the east and lower in the west, indicating a stronger Walker circulation. June 2022 tied for third strongest on record (1950–present), which got me wondering about the relationship between the strength of the Walker circulation in the summer to the Niño-3.4 index in the following early winter.
It turns out that the June EQSOI has a correlation of about 0.7 with the Niño-3.4 index in the following November–January period. This is a fairly strong correlation, but by no means does it guarantee any particular November-January outcome. The other tied-for-third June, 2013, was followed by an ENSO-neutral winter. Most other Junes in the range of the 2022 value were followed by La Niña winters, though.
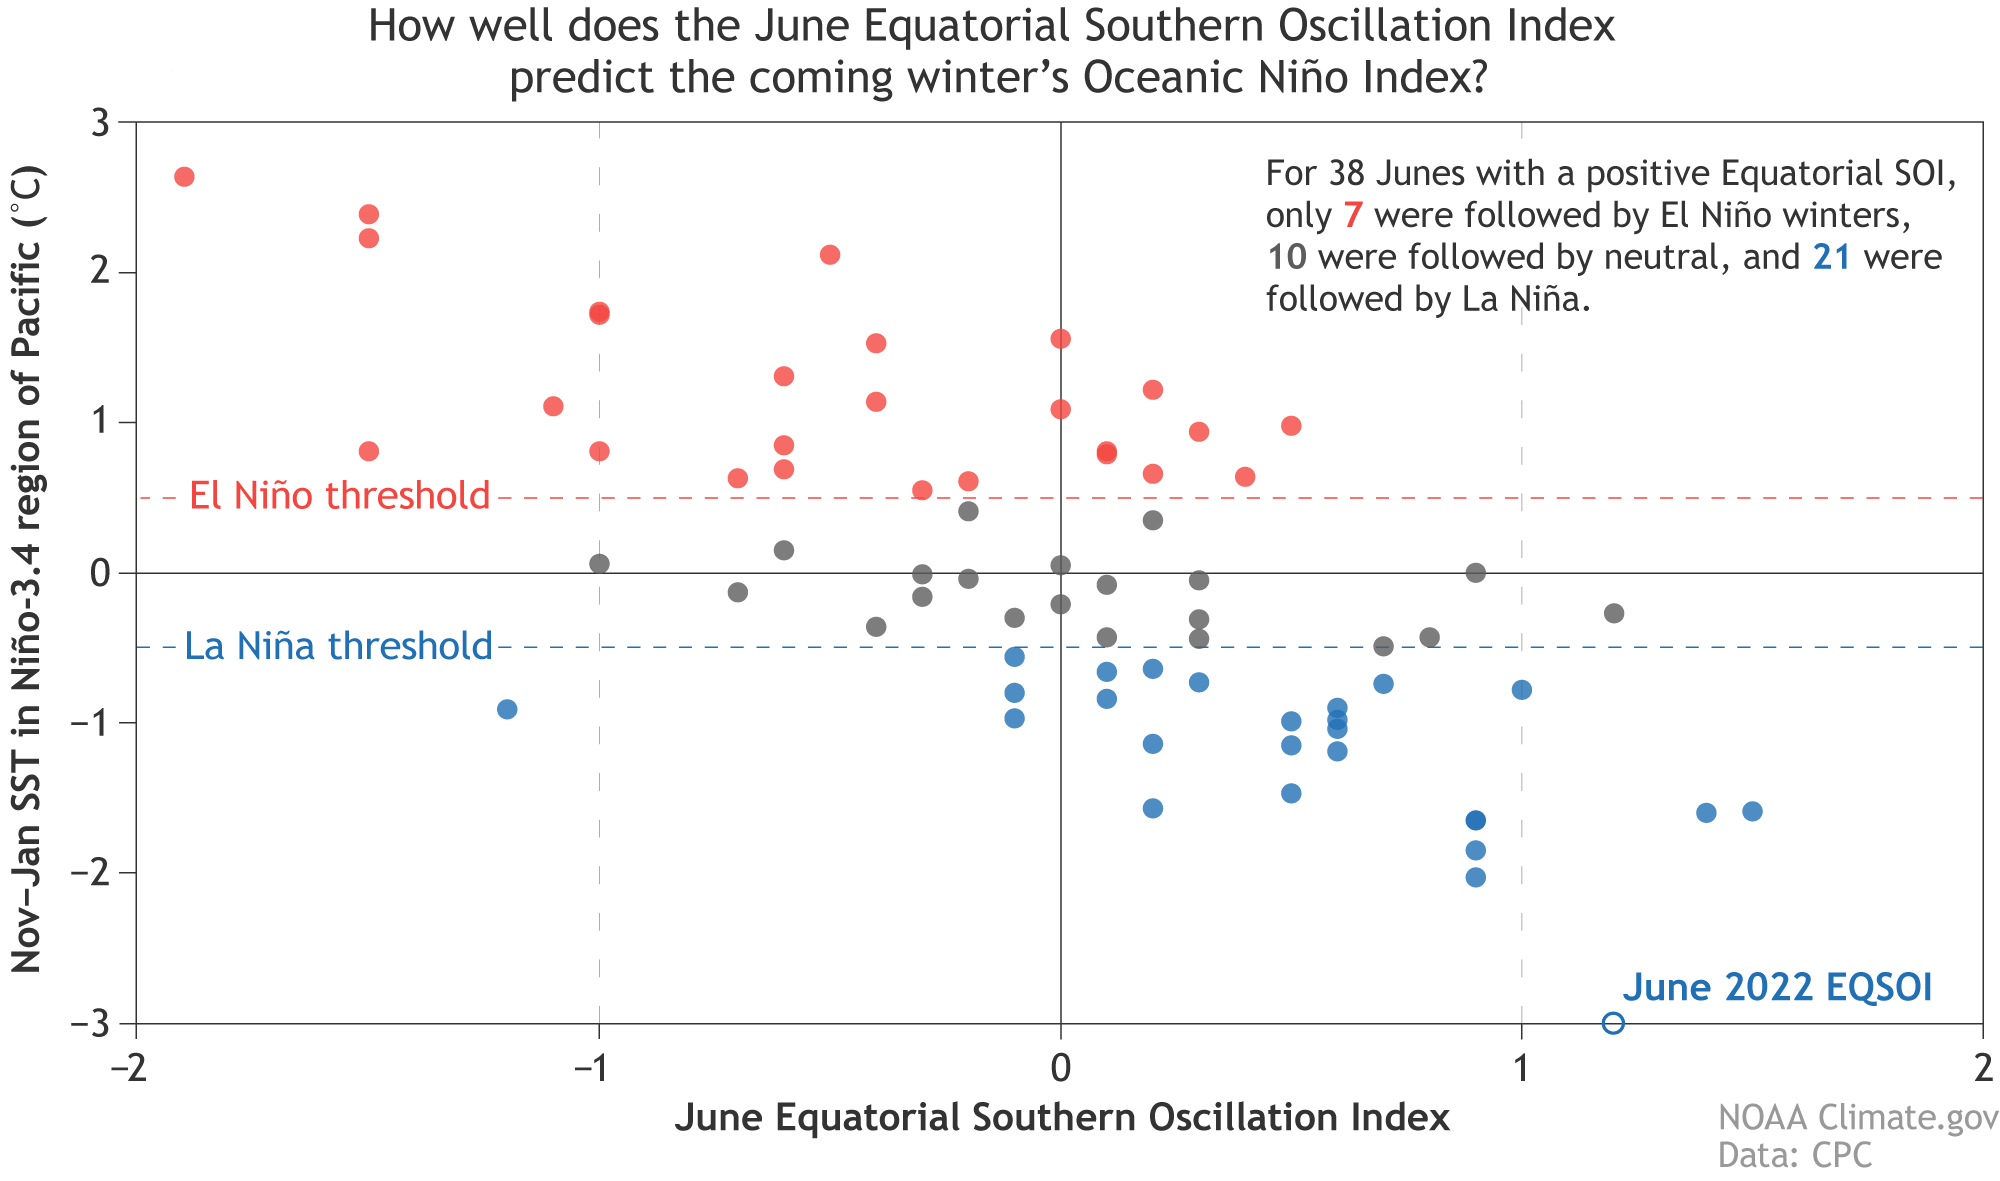 [Each dot on this scatterplot shows the atmospheric ENSO conditions each June (horizontal axis) since 1950 versus the oceanic ENSO conditions the following November–January (vertical axis). When the June Equatorial Southern Oscillation Index (ESOI) is negative, winter Oceanic Niño Index conditions are frequently in the El Niño range (red dots), sometimes neutral (gray dots), but rarely in the La Niña range (blue dots). When June ESOI is positive, the winter is usually in the La Niña range, sometimes in the neutral range, but rarely in the El Niño range. The June 2022 EQSOI—shown as an open circle on the horizontal axis—was the third-highest June SOI on record. Data from CPC, image by NOAA Climate.]
Ka-Pow!
Numbers-wise, there’s about a 60% chance of La Niña through the summer, ticking up a bit to the mid 60%s around 66% by October–December 2022. The second most likely outcome is ENSO-neutral conditions. El Niño is a distant third, with chances only in the low single digits through the early winter. This forecast isn’t much different from the past couple of months.
[The official CPC/IRI ENSO probability forecast. The bars show the seasonal chances for each possible ENSO state—El Niño (red), La Niña (blue), and neutral (gray)—from spring 2022 through winter 2022–23. The forecast is based on a consensus of CPC and IRI forecasters, and it is updated during the first half of the month, in association with the official CPC/IRI ENSO Diagnostic Discussion. It is based on observational and predictive information from early in the month and from the previous month. Image from IRI.]
While we’re doing the numbers, let’s see how La Niña measured up last month. As I mentioned above, the cool sea surface temperature anomaly weakened a bit in June, but remained in La Niña territory. (Anomaly = difference from the long-term average, long-term being 1991–2020 here, and the La Niña threshold is -0.5 °Celsius, which is just shy of 1 degree Fahrenheit.) According to the ERSSTv5, our most consistent sea surface temperature dataset, June’s sea surface temperature anomaly in the Niño-3.4 region was -0.8 °C. This is the 7th-strongest negative June anomaly in our 1950–present record.
[Three-year history of sea surface temperatures in the Niño-3.4 region of the tropical Pacific for 8 previous double-dip La Niña events. The color of the line shows the ENSO state in the third winter (red: El Niño, darker blue: La Niña, lighter blue: neutral). The black line shows the current event. Monthly Niño-3.4 index is from CPC using ERSSTv5. Time series comparison was created by Michelle L’Heureux, and modified by NOAA Climate.]
This recent weakening in the Niño-3.4 anomaly—it was -1.1 °C in May—is partly due to a slight diminishment of the trade winds, the prevailing east-to-west winds near the Equator, in the first half of June. When the trade winds weaken, wind-driven evaporative cooling slows and the surface warms. Also, a fairly weak downwelling Kelvin wave, a region of warmer-than-average water under the surface, has been moving from west to east over the past few months , gradually rising toward the surface.
The trade winds re-strengthened over the second half of June, and remain stronger than average as we go to press. This will likely help to cool the surface, and may contribute to an upwelling Kelvin wave, a region of cooler-than-average subsurface water that moves west to east. Along with being a sign that La Niña’s amped-up Walker circulation—the atmospheric response to La Niña’s cooler sea surface—is still present, the stronger trades are a source of confidence in the forecast for La Niña to continue through the summer.
[Sea surface temperatures the week of July 9, 2022, showing the warm-to-cool gradient in temperatures across the tropical Pacific Ocean from west to east. Temperatures in the West Pacific Warm Pool, around the Maritime Continent, are above 80 degrees Fahrenheit (yellow-orange), while a cooler tongue of water (blue) extends from the coast of South America to the central Pacific. The prevailing east-to-west trade winds near the equator create this temperature contrast by pushing warm water west and allowing deeper, cooler water to well up to the surface. NOAA Climate image from our Data Snapshots collection.]
Zowie!
That said, there may well be short-term fluctuations in the Niño-3.4-region sea surface temperature that flirt with the La Niña threshold. For example, the current weekly Niño-3.4 index is -0.5°C. (This uses a different sea surface temperature monitoring dataset, the OISST.) However, as Michelle detailed a few years ago, ENSO is a seasonal phenomenon, meaning we evaluate it using monthly and seasonal averages, not weekly. Most climate models are predicting that the three-month-average Niño-3.4 index will remain below -0.5°C, another source of confidence in the forecast.Thwack!
As I mentioned above, the June sea surface temperature anomaly was the 7th-most negative June anomaly on record. Where does the atmospheric response rank? Let’s take a look at the Equatorial Southern Oscillation Index (EQSOI), an index that measures the relative atmospheric surface pressure in the equatorial eastern Pacific versus that in the western Pacific.
[The Equatorial Southern Oscillation Index compares pressure anomalies across a broad region of the eastern tropical Pacific (5 degrees North and South latitude, 80–130 degrees West longitude) to pressure anomalies on the other side of the basin (5 degrees North and South latitude, 90–140 degrees East longitude). NOAA Climate image by Fiona Martin.]
When this index is positive, it means the pressure is relatively higher in the east and lower in the west, indicating a stronger Walker circulation. June 2022 tied for third strongest on record (1950–present), which got me wondering about the relationship between the strength of the Walker circulation in the summer to the Niño-3.4 index in the following early winter.
It turns out that the June EQSOI has a correlation of about 0.7 with the Niño-3.4 index in the following November–January period. This is a fairly strong correlation, but by no means does it guarantee any particular November-January outcome. The other tied-for-third June, 2013, was followed by an ENSO-neutral winter. Most other Junes in the range of the 2022 value were followed by La Niña winters, though.
[Each dot on this scatterplot shows the atmospheric ENSO conditions each June (horizontal axis) since 1950 versus the oceanic ENSO conditions the following November–January (vertical axis). When the June Equatorial Southern Oscillation Index (ESOI) is negative, winter Oceanic Niño Index conditions are frequently in the El Niño range (red dots), sometimes neutral (gray dots), but rarely in the La Niña range (blue dots). When June ESOI is positive, the winter is usually in the La Niña range, sometimes in the neutral range, but rarely in the El Niño range. The June 2022 EQSOI—shown as an open circle on the horizontal axis—was the third-highest June SOI on record. Data from CPC, image by NOAA Climate.]
Blammo!
Given all these sources of confidence, why isn’t the probability of La Niña higher? First, while a majority of the climate models do predict continued La Niña, there is still a pretty wide range of potential outcomes. Also, as I mentioned above, the subsurface temperature in the eastern half of the tropical Pacific is a bit warmer than average. If this anomaly is large—much cooler than average, or much warmer—it has a stronger relationship with the eventual Niño-3.4 index. However, when it is pretty small, as it was in June 2022, the outcomes are more varied. Finally, as we’ve covered extensively, a triple-dip (three-peat!) La Niña is a pretty unusual occurrence.All Weather News
More
Fronts Continue To Spark Severe Weather Across the Plains
A cold front that brought record lows to the
18 Jul 2025 10:40 PM

Extreme Heat Impacts for the East Coast & South
Extreme heat continues to impact several area
18 Jul 2025 10:05 PM

Flooding Threat Remains Elevated in the East
A cold front pushing through the Eastern Seab
18 Jul 2025 9:10 PM

EF-2 Firenado from the Deer Creek Fire in Utah
A fire tornado was spotted near La Sal, Utah
18 Jul 2025 7:30 AM

Tropical System Brings Flood Risk to the Central Gulf
Time has run out for notable tropical develop
18 Jul 2025 3:05 AM

Heavy Rain, Flooding Threat Returns to Florida
Keep the rain boots handy in Florida - heavy
13 Jul 2025 12:50 PM

Severe Storm Risk Pushes into the Great Lakes, Ohio Valley
Friday was another busy day with severe weath
12 Jul 2025 8:00 PM