[The water temperature anomaly from 300 meters deep to the surface in the region 180°W–100°W of the tropical Pacific Ocean compared to the October–December Oceanic Niño Index. NOAA Climate image from NOAA CPC data.]
June El Nino Update: Pet Projects
Special Stories
12 Jun 2020 2:00 AM
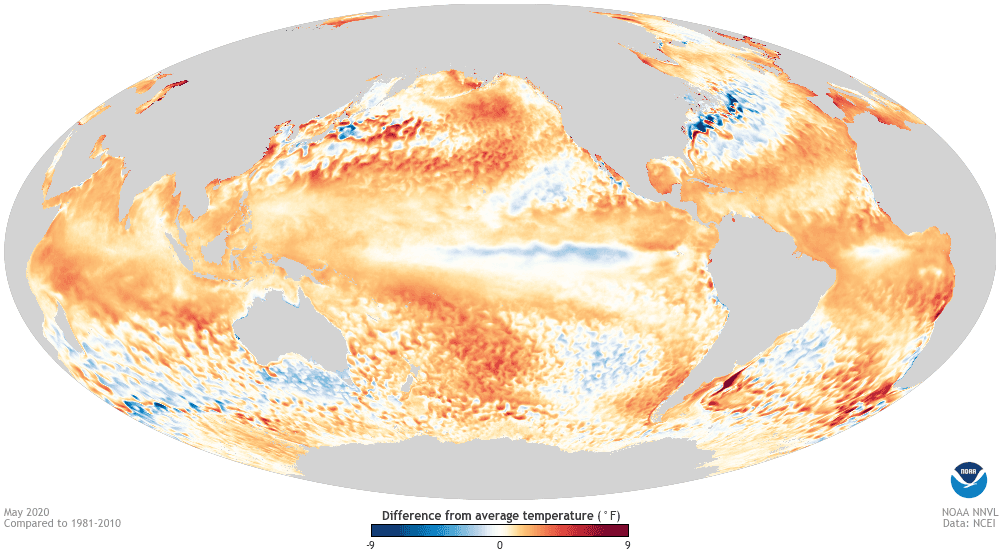
[May 2020 sea surface temperature departure from the 1981-2010 average. Image from Data Snapshots on NOAA Climate.]
[From NOAA written by Emily Becker] After several months of hovering above average, sea surface temperatures in the tropical Pacific have dropped rapidly in recent weeks. The current CPC/IRI ENSO forecast estimates about a 60% chance that ENSO-neutral conditions will remain through the summer. Chances for the fall and winter are about equally split between neutral continuing and La Niña developing, at around 45% each. El Niño isn’t completely ruled out, but it is less likely, with a chance of about 10%.
June finds us starting to emerge from the spring predictability barrier, when computer models are less successful at predicting how ENSO will behave. However, the models and nature aren’t showing strong signs, which is reflected in the approximately even odds between neutral and La Niña.
 Since March, the low-level winds along the equatorial Pacific (the trade winds) have been generally stronger than average. These winds helped cool the surface and support an upwelling Kelvin wave, an area of cooler-than-average water under the surface that moves gradually toward the east (see animation above).
The subsurface heat content has also dropped substantially over the past several weeks, reflecting that upwelling Kelvin wave, and the May departure from average in the central-eastern equatorial Pacific was -0.92°C. Why should you care? I’ll cover that a little bit later!
Since March, the low-level winds along the equatorial Pacific (the trade winds) have been generally stronger than average. These winds helped cool the surface and support an upwelling Kelvin wave, an area of cooler-than-average water under the surface that moves gradually toward the east (see animation above).
The subsurface heat content has also dropped substantially over the past several weeks, reflecting that upwelling Kelvin wave, and the May departure from average in the central-eastern equatorial Pacific was -0.92°C. Why should you care? I’ll cover that a little bit later!
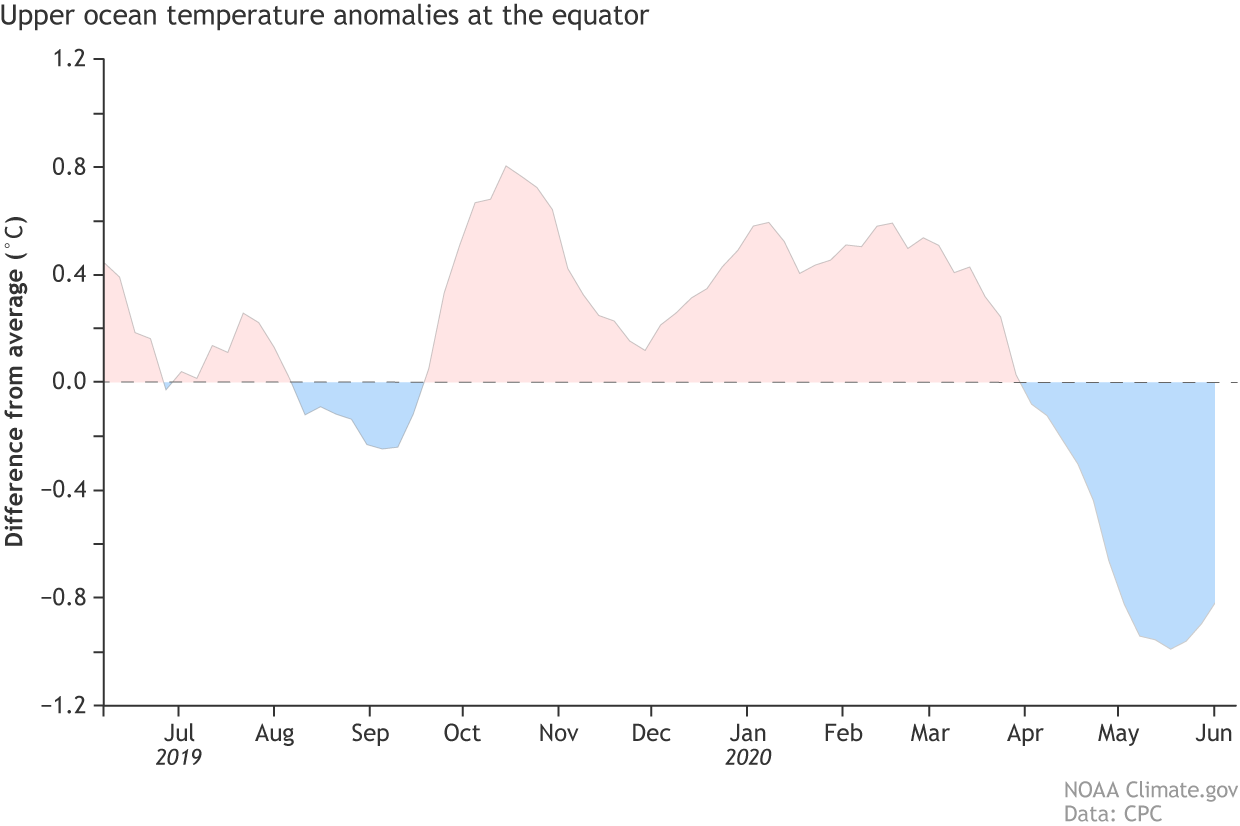 [Area-averaged upper-ocean heat content anomaly (°C) in the equatorial Pacific (5°N-5°S, 180º-100ºW). The heat content anomaly is computed as the departure from the 1981-2010 base period pentad (5-day) means. Heat content increased has recently decreased. NOAA Climate figure from CPC data.]
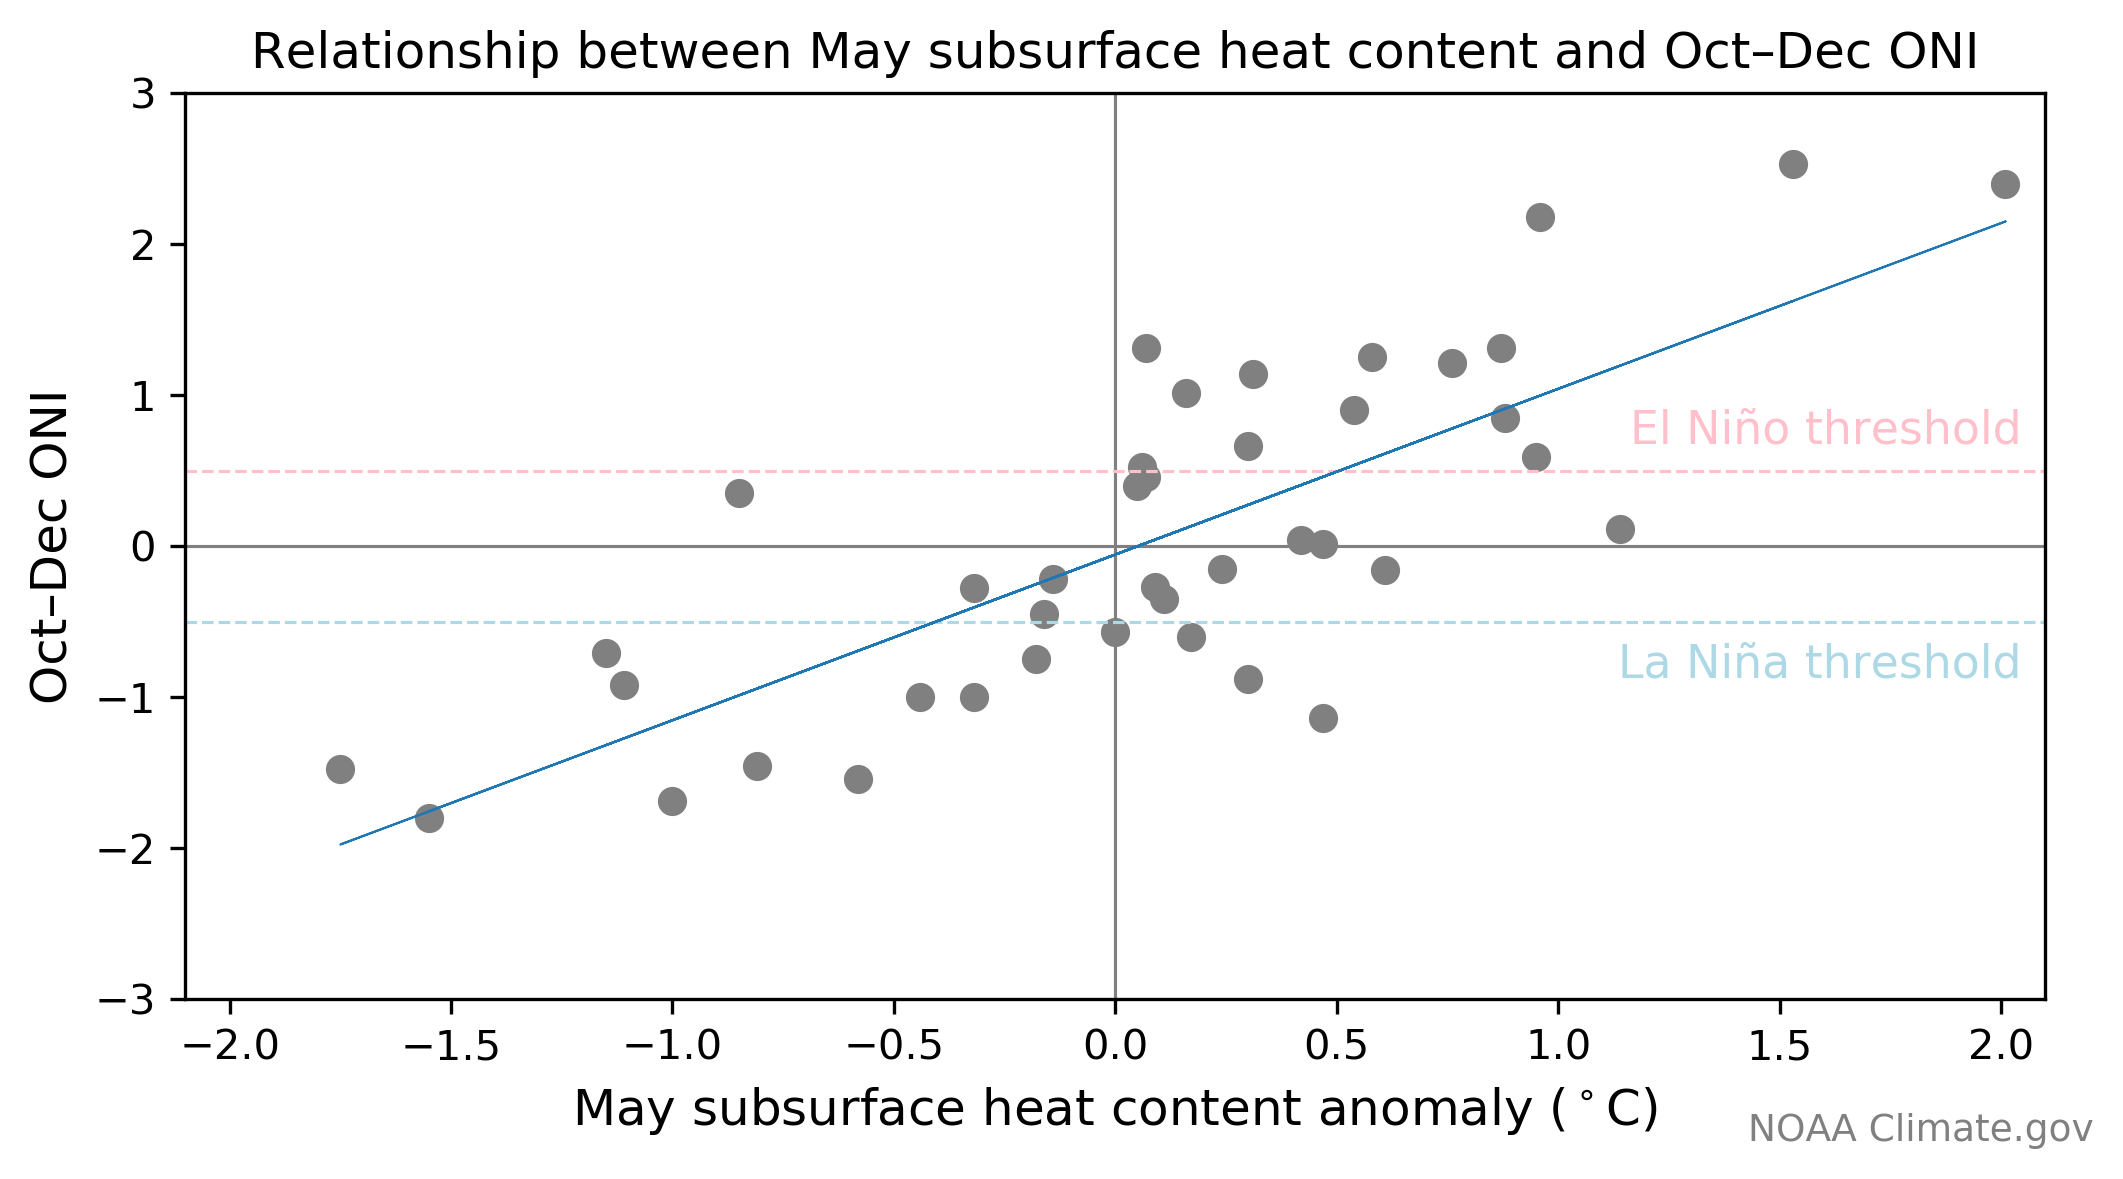 It turns out the statistical relationship between the May subsurface temperature anomaly in the east-central Pacific and the October–December Oceanic Niño Index (the three-month-average temperature anomaly in the Niño3.4 region, using the ERSSTv5 temperature data) is fairly strong. Generally, cooler-than-average May subsurface temperature precedes La Niña in the late fall, and warmer-than-average precedes El Niño.
However (of course! Because nature is immensely complex!) there have been exceptions. For example, one of the last two times the subsurface temperature anomaly was near the current value (-0.92 °C in May 2020), the October–December ONI was warmer than average. Overall, though, this relationship was a bit stronger than I expected, with a correlation coefficient of 0.77. You can find more detail about the relationship between the subsurface anomaly in spring and El Niño and La Niña in the fall here.
As always, we’ll keep you posted on how conditions evolve in the tropical Pacific. See you in July, when perhaps my Python programming skills will also have evolved…
Edited for WeatherNation by Mace Michaels
It turns out the statistical relationship between the May subsurface temperature anomaly in the east-central Pacific and the October–December Oceanic Niño Index (the three-month-average temperature anomaly in the Niño3.4 region, using the ERSSTv5 temperature data) is fairly strong. Generally, cooler-than-average May subsurface temperature precedes La Niña in the late fall, and warmer-than-average precedes El Niño.
However (of course! Because nature is immensely complex!) there have been exceptions. For example, one of the last two times the subsurface temperature anomaly was near the current value (-0.92 °C in May 2020), the October–December ONI was warmer than average. Overall, though, this relationship was a bit stronger than I expected, with a correlation coefficient of 0.77. You can find more detail about the relationship between the subsurface anomaly in spring and El Niño and La Niña in the fall here.
As always, we’ll keep you posted on how conditions evolve in the tropical Pacific. See you in July, when perhaps my Python programming skills will also have evolved…
Edited for WeatherNation by Mace Michaels
Puppies and kittens
Before I get into the forecast, let’s take a look at how conditions have evolved in the tropical Pacific over the past few months. The weekly Niño3.4 index, which measures the sea surface temperature departure from the long-term average in the east-central equatorial Pacific, cooled by a full degree Celsius (1.8°F) since mid-April. Over one week in May, the Niño3.4 index dropped by half a degree Celsius. Water has a high heat capacity, meaning it takes a lot of heat to change the temperature, so rapid changes are uncommon. According to this post by Michelle, a half-degree week-to-week change is quite rare, happening about 1% of the time.
Since March, the low-level winds along the equatorial Pacific (the trade winds) have been generally stronger than average. These winds helped cool the surface and support an upwelling Kelvin wave, an area of cooler-than-average water under the surface that moves gradually toward the east (see animation above).
The subsurface heat content has also dropped substantially over the past several weeks, reflecting that upwelling Kelvin wave, and the May departure from average in the central-eastern equatorial Pacific was -0.92°C. Why should you care? I’ll cover that a little bit later!
[Area-averaged upper-ocean heat content anomaly (°C) in the equatorial Pacific (5°N-5°S, 180º-100ºW). The heat content anomaly is computed as the departure from the 1981-2010 base period pentad (5-day) means. Heat content increased has recently decreased. NOAA Climate figure from CPC data.]
Hamsters and gerbils
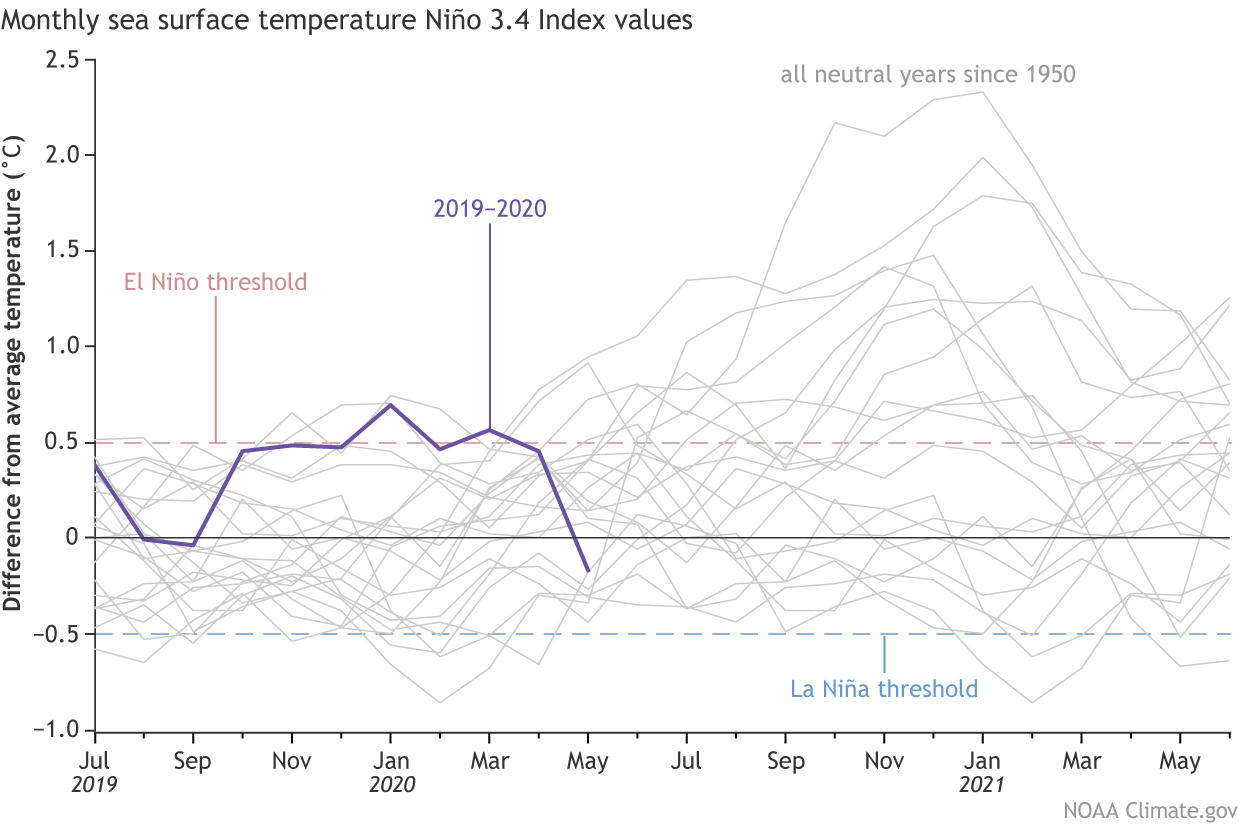
Most of the dynamical computer models are predicting that the Niño3.4 index will remain slightly cooler than average for the next few months, but not strongly into the La Niña range (more than 0.5°C below average). It’s likely that ENSO will remain in neutral through the summer. As for next fall and winter, though, there is less agreement. Some of the models predict a weak La Niña, while some predict otherwise. Statistical computer models, which make predictions based on how historical events have evolved, are mostly predicting that the Niño3.4 index will be a bit warmer than average. This may in part be related to the fact that we have not observed a La Niña developing following a neutral winter (like we just had) in our 1950–present record. Predicting the future based on past cases is very tricky, though, as even small differences can lead to very different outcomes.
[Monthly sea surface temperature in the Niño 3.4 region of the tropical Pacific for 2019-2020 (purple line) and all other years starting from neutral winters since 1950. NOAA Climate graph based on ERSSTv5 temperature data.]
Snakes?
The temperature of the water under the surface of the equatorial Pacific can be an early indicator of a developing El Niño or La Niña. Michelle and I were curious about the relationship between the subsurface temperature anomaly in May and the Niño3.4 index in the fall, so I graphed it! (I’m learning to program in Python, so any chance to practice is welcome, if fraught with setbacks.)All Weather News
More
Wildfire Outbreak in the Pacific Northwest
SPOKANE, WA - On Saturday, August 1st, the Ol
3 Aug 2026 1:55 AM

More Storms for the East Through Monday
A low-pressure system that moved through the
3 Aug 2026 1:50 AM


After Reaching Category 5, Genevieve Weakens in the Pacific
PacificGenevieve formed last Friday south of
3 Aug 2026 12:30 AM

Flooding, Severe Storms Target the Midwest Again
After an active week of storms across the nor
1 Aug 2026 1:40 AM

Flooding Risk Increases as Heavy Rain Targets the Tri-State Area
Tuesday, heavy rainfall moved across the Nort
30 Jul 2026 12:25 AM

Severe Weather: Energy From the Midwest Now in the Southeast
UPPER MIDWEST - Through Monday, dangerous tor
29 Jul 2026 10:30 PM