Looking at Clouds in 3D to Better Understand Formation and Air Flow
Special Stories
4 May 2018 8:00 AM
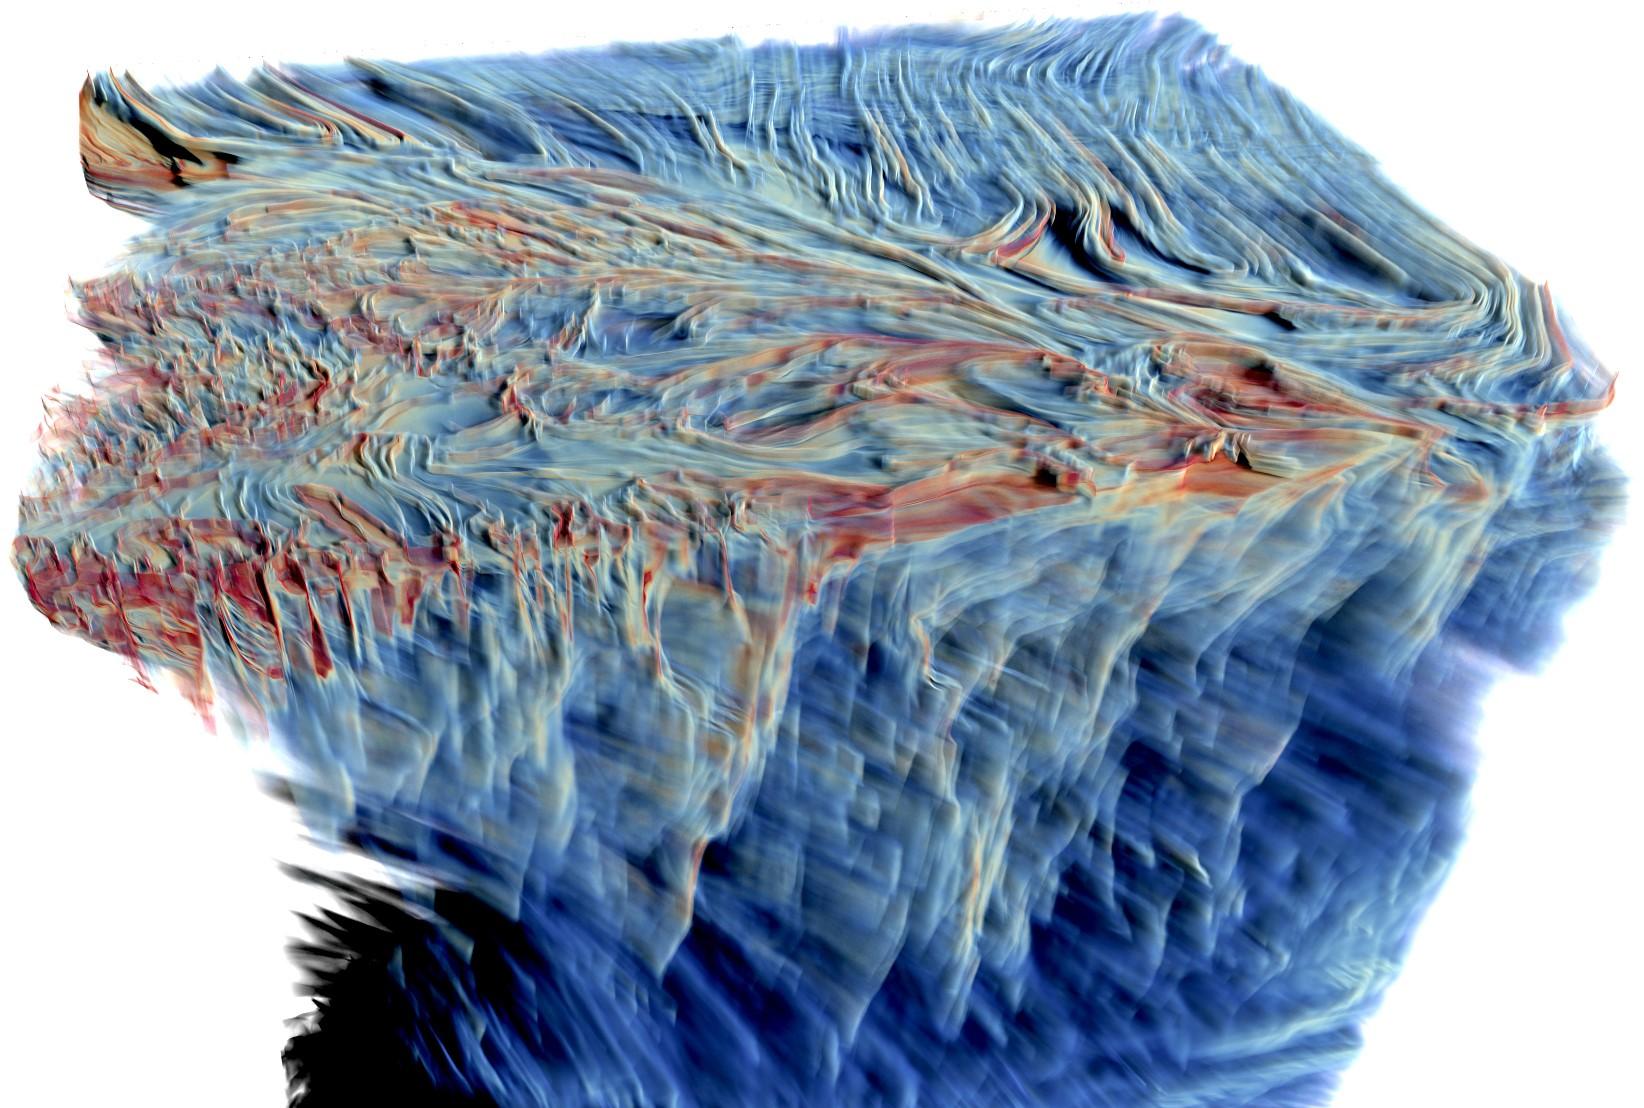
[Visualization of air flows over Germany. The horizontal currents in the tropopause (below, the graph is upside down) are perpendicular to the vertical updrafts in the troposphere. Due to the topography, the air close to the ground is turbulent. The red colour indicates transport barriers that occur, for instance, in the event of strong updrafts. (Graphic: Tobias Günther, Computer Graphics Lab, ETH Zurich)]
From ETH Zurich by Peter Rüegg
ETH computer graphics specialists have analyzed cloud formation and air flow in high resolution weather situations and visualized a high resolution weather situation in 3D. The aviation industry and meteorologists may be able to benefit from this visualization method in the future.
Visualization plays a huge role in the study of weather data, such as temperature, air pressure and the cloud water content of the atmosphere. Displaying this data graphically is quite natural, since it has clear spatial reference points and is very simple to superimpose on maps.
Two-dimensional representations are currently the standard in meteorology, both in research and for the purposes of weather forecasts. These simple visualizations are adequate in most cases. However, some processes, such as the vertical formation of clouds over time, are difficult to study in two dimensions.
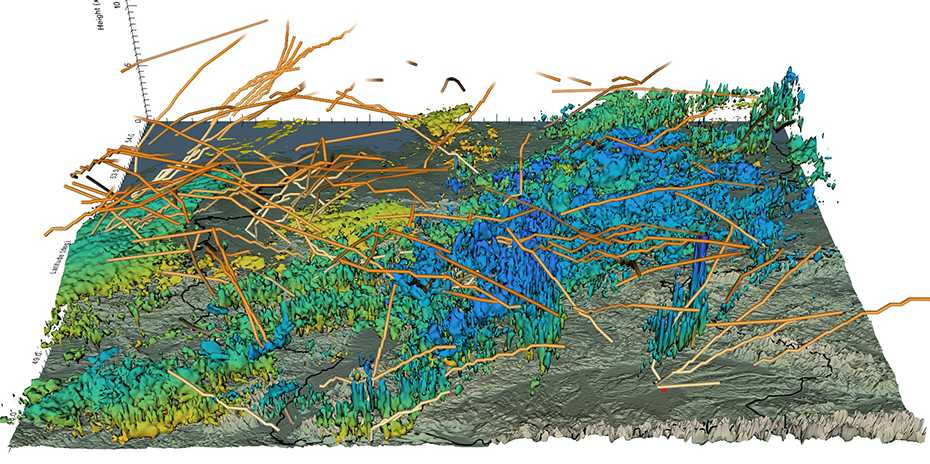 [The figure shows all flight paths of passenger aircraft flying at an altitude of less than 10 kilometres, between 7 p.m. and 7.12 p.m. Aircraft taking off in Frankfurt fly right through thunder clouds (cumulonimbus). Only one plane (arrow) appears to avoid such clouds. (all graphics: after Rimensberger et al, 2017)]
[The figure shows all flight paths of passenger aircraft flying at an altitude of less than 10 kilometres, between 7 p.m. and 7.12 p.m. Aircraft taking off in Frankfurt fly right through thunder clouds (cumulonimbus). Only one plane (arrow) appears to avoid such clouds. (all graphics: after Rimensberger et al, 2017)]
Three-dimensional cloud visualization
This is why computer graphics specialists in a team led by ETH computer science professor Markus Gross have developed approaches based on numerical weather simulations to visualize the formation and dynamics of clouds and air currents three dimensionally at high resolution. The researchers presented their work at two international expert conferences. According to Tobias Günther, a senior scientist in Gross’ team, the new 3D visualization methods were well received by attendees. For his bachelor’s thesis, Noël Rimensberger, supervised by Günther, developed and expanded the methodology and calculated the visualizations on the computer.
Rimensberger’s visualizations were based on wind, cloud and rain data made freely available to the scientific community as part of the international IEEE Scientific Visualization Contest. The underlying simulation recreates the weather conditions on the evening of April 26, 2013 and was developed as part of a large-scale meteorology research project called HD(CP)², in which more than 100 researchers from 19 institutions participated.
The computer science student combined existing algorithms to visualize cloud formation and air currents, applying recent methods used in the research field of scientific visualization.
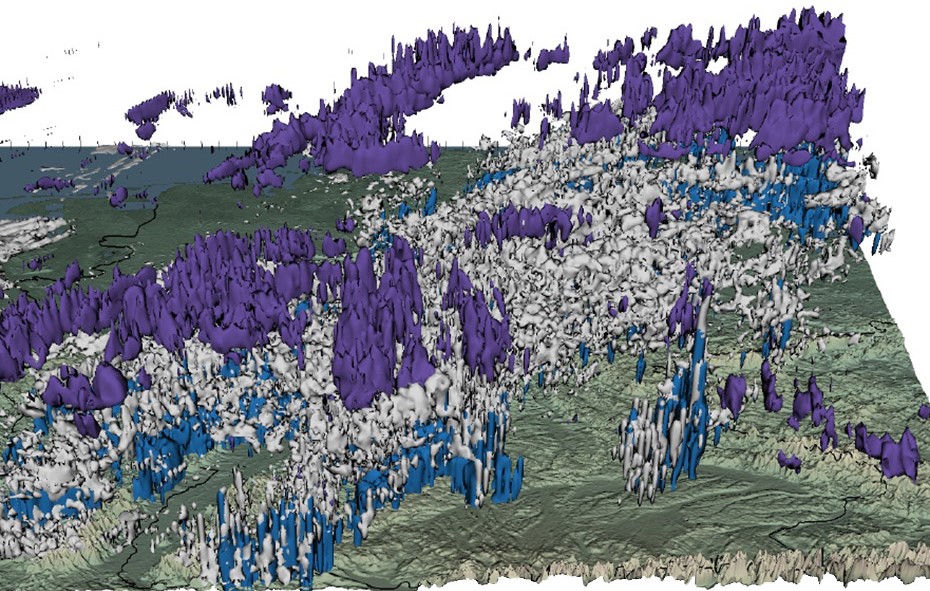 [The colored surfaces represents all points of a cloud with the same water content (white) or ice content (violet) . Blue surfaces the places where a certain amount of rain is falling. From ETH Zurich]
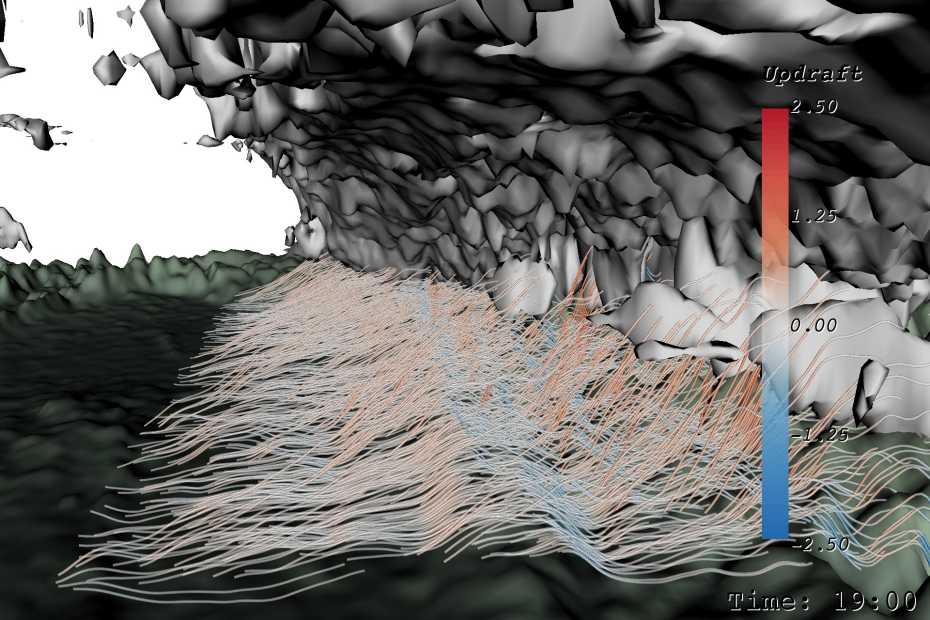 [3D visualization of updrafts and clouds in a hilly terrain of Germany. From ETH Zurich]
[The colored surfaces represents all points of a cloud with the same water content (white) or ice content (violet) . Blue surfaces the places where a certain amount of rain is falling. From ETH Zurich]
Exploring new possibilities
Rimensberger emphasizes that he was less interested in developing viable predictive tools for meteorology than in exploring the possibilities of “representing weather data in a relatively simple, comprehensible way”. The value for science is that the 3D graphics reveal something that is not visible with 2D graphics, and thus provide a better overall picture. For example, Rimensberger’s visualizations show how clouds form over Germany and change over time, how they are carried upwards by updrafts and then transported by winds in the troposphere more than 6 miles above the ground. Cloud zones with an identical water and ice content are shown in different colors. The computer science student also analyzed air currents. The lines represent the paths of air parcels, and their colors indicate how much an air parcel rotates around its own axis. The length of the lines provides information on the distance traveled, and thus visualizes the flow velocity. Ascending clouds create turbulences that cause stronger vorticity or changes in trajectory. Both can be read from the path lines.
[3D visualization of updrafts and clouds in a hilly terrain of Germany. From ETH Zurich]
Rimensberger also superimposed the flight paths of passenger aircraft taking off on the cloud formation simulations. “I wanted to find out if and how storm zones affect air traffic,” he says.
The flight paths of planes taking off from Frankfurt, however, cross right through the simulated thunderstorm cells. Only one plane, taking off from Munich, just avoids a rain cell over Regensburg. Rimensberger concludes that the storms were not strong enough to warrant rerouting air traffic or that too little measurement data was available.
The new visualizations simplify the classification of cloud formations as they can “reveal” clouds that are unobservable from satellites above or from the ground. A comparison with today’s conventional 2D categorization showed that the new algorithms can also reveal stacked cloud structures.
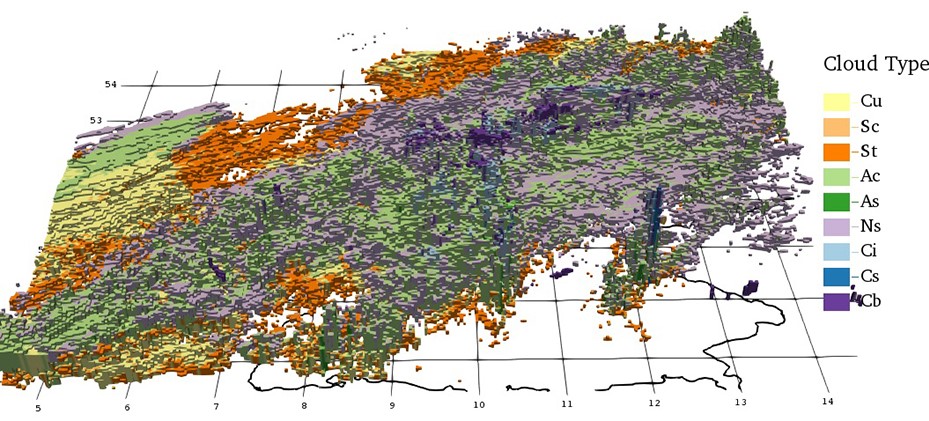 [Classification of clouds using Rimensberger’s simulation.]
[Classification of clouds using Rimensberger’s simulation.]
Revealing hidden structures
“The scientific value of our visualization lies in the fact that we make something visible that was impossible to see with the existing tools,” says Rimensberger. It is not quite ready for real-time simulations, however. Complex graphics like those of the air currents across all Germany, for example, have not yet become conventional practice. “The calculations required for this are still too slow. We are trying to improve this with better algorithms,” adds Günther. “But it would be possible to integrate some of the visualizations or, for instance, cloud classifications into existing tools now.” For air traffic control, the visualization of regions of turbulence or regions with strong updrafts and storm development could also be of interest. Follow-up projects are planned or already in progress, such as the interactive analysis of large meteorological datasets. The computer graphics specialists are also working to make key structures in this data more visible and speeding up the complex visualizations of air currents. And who knows, perhaps one day the TV weather presenter will point at 3D weather maps based on ETH’s algorithms. Edited for WeatherNation by Meteorologist Mace MichaelsAll Weather News
More
Fronts Continue To Spark Severe Weather Across the Plains
A cold front that brought record lows to the
18 Jul 2025 10:40 PM

Extreme Heat Impacts for the East Coast & South
Extreme heat continues to impact several area
18 Jul 2025 10:05 PM

Flooding Threat Remains Elevated in the East
A cold front pushing through the Eastern Seab
18 Jul 2025 9:10 PM

EF-2 Firenado from the Deer Creek Fire in Utah
A fire tornado was spotted near La Sal, Utah
18 Jul 2025 7:30 AM

Tropical System Brings Flood Risk to the Central Gulf
Time has run out for notable tropical develop
18 Jul 2025 3:05 AM

Heavy Rain, Flooding Threat Returns to Florida
Keep the rain boots handy in Florida - heavy
13 Jul 2025 12:50 PM

Severe Storm Risk Pushes into the Great Lakes, Ohio Valley
Friday was another busy day with severe weath
12 Jul 2025 8:00 PM