No Surprise - July is Typically the Hottest Time of the Year

Special Stories
19 Jul 2018 7:59 AM
[A heat wave and smog shown by the shoreline in Chicago. iStock via NOAA]
From NOAA
If this year’s weather is statistically “normal,” most locations in the contiguous United States will experience their hottest day of the year between July 15-31. For another significant chunk of the country—including most of Alaska—the historical window for the hottest day of the year has already passed.
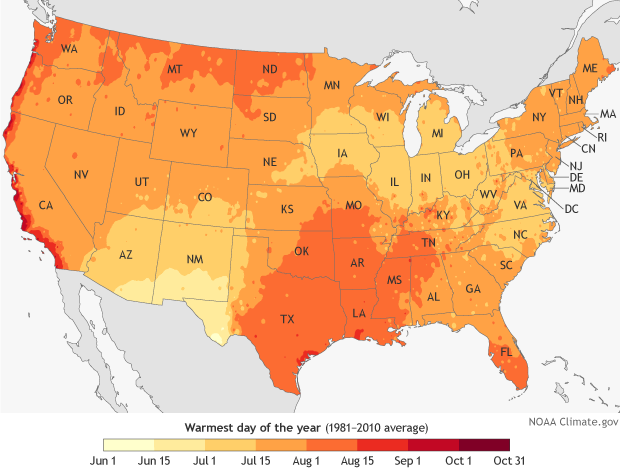 This map shows the average window for the day of the year with the highest maximum temperature based on the 1981-2010 U.S. Climate Normals, the nation’s official record of recent climate. The colors show date ranges progressing from June 1 (lightest yellow) through September 30 (darkest red). The darker the color, the later in the year the hottest day typically arrives.
For most of the country, the warmest day occurs sometime between mid-July and mid-August. The amount of solar radiation reaching Earth (in the northern Hemisphere) peaks at the summer solstice on June 21, but temperatures tend to keep increasing into July. The continued warming occurs because the rate of heat input from the sun during the day continues to be greater than the cooling at night for several weeks past the solstice, until temperatures start to descend in late July and early August.
This map shows the average window for the day of the year with the highest maximum temperature based on the 1981-2010 U.S. Climate Normals, the nation’s official record of recent climate. The colors show date ranges progressing from June 1 (lightest yellow) through September 30 (darkest red). The darker the color, the later in the year the hottest day typically arrives.
For most of the country, the warmest day occurs sometime between mid-July and mid-August. The amount of solar radiation reaching Earth (in the northern Hemisphere) peaks at the summer solstice on June 21, but temperatures tend to keep increasing into July. The continued warming occurs because the rate of heat input from the sun during the day continues to be greater than the cooling at night for several weeks past the solstice, until temperatures start to descend in late July and early August.
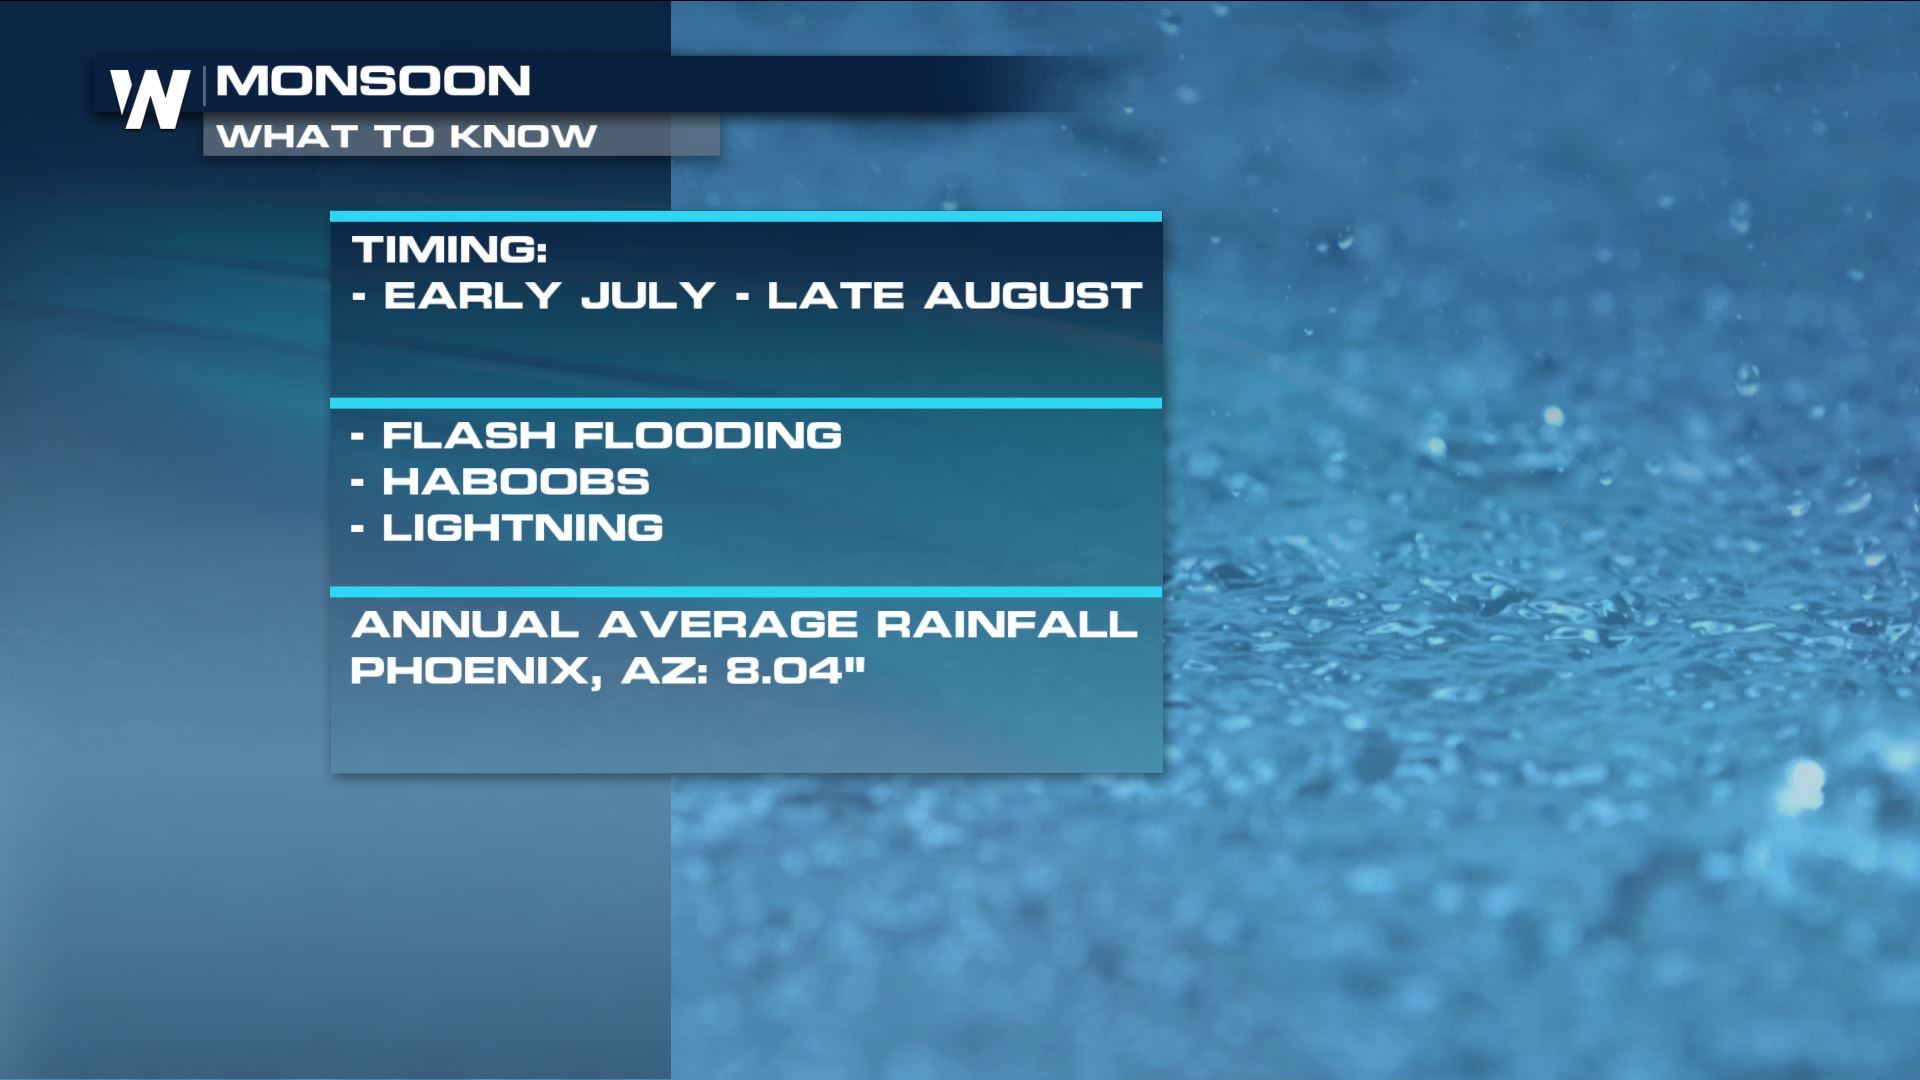 The lightest and darkest areas of the map show just how variable the U.S. climate can be. The lightest colors (earliest warmest day) occur in New Mexico and Arizona. This early arrival reflects the influence of the North American Monsoon, a period of increased rainfall affecting the U.S. Southwest in mid-to-late summer. The region’s highest temperatures tend to occur in June, before the monsoon’s clouds and rain set in. The darkest colors occur along the Pacific coastline, where the persistence of the marine layer—a persistent layer of clouds that forms above the chilly coastal waters—maintains cool temperatures in early summer. In many locations, the warmest days on average do not occur until September when the fog lifts.
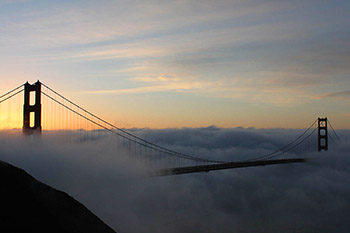 [Golden Gate bridge towers sticking up above the marine layer. From NOAA]
The National Centers for Environmental Information (NCEI) Warmest Day of the Year” maps are derived from the 1981–2010 U.S. Climate Normals, 30-year averages of climatological variables including the average high temperature for every day. Temperature normals are important indicators that are used in forecasting and monitoring by many U.S. economic sectors. Knowing the probability of high temperatures can help energy companies prepare for rising electricity demand and help farmers monitor heat-sensitive crops. They are also useful planning tools for the healthcare, construction, and tourism industries. You may even want to check the normals at your destination as part of any advance planning your next event or vacation.
Edited for WeatherNation by Meteorologist Mace Michaels
[Golden Gate bridge towers sticking up above the marine layer. From NOAA]
The National Centers for Environmental Information (NCEI) Warmest Day of the Year” maps are derived from the 1981–2010 U.S. Climate Normals, 30-year averages of climatological variables including the average high temperature for every day. Temperature normals are important indicators that are used in forecasting and monitoring by many U.S. economic sectors. Knowing the probability of high temperatures can help energy companies prepare for rising electricity demand and help farmers monitor heat-sensitive crops. They are also useful planning tools for the healthcare, construction, and tourism industries. You may even want to check the normals at your destination as part of any advance planning your next event or vacation.
Edited for WeatherNation by Meteorologist Mace Michaels
This map shows the average window for the day of the year with the highest maximum temperature based on the 1981-2010 U.S. Climate Normals, the nation’s official record of recent climate. The colors show date ranges progressing from June 1 (lightest yellow) through September 30 (darkest red). The darker the color, the later in the year the hottest day typically arrives.
For most of the country, the warmest day occurs sometime between mid-July and mid-August. The amount of solar radiation reaching Earth (in the northern Hemisphere) peaks at the summer solstice on June 21, but temperatures tend to keep increasing into July. The continued warming occurs because the rate of heat input from the sun during the day continues to be greater than the cooling at night for several weeks past the solstice, until temperatures start to descend in late July and early August.
The lightest and darkest areas of the map show just how variable the U.S. climate can be. The lightest colors (earliest warmest day) occur in New Mexico and Arizona. This early arrival reflects the influence of the North American Monsoon, a period of increased rainfall affecting the U.S. Southwest in mid-to-late summer. The region’s highest temperatures tend to occur in June, before the monsoon’s clouds and rain set in. The darkest colors occur along the Pacific coastline, where the persistence of the marine layer—a persistent layer of clouds that forms above the chilly coastal waters—maintains cool temperatures in early summer. In many locations, the warmest days on average do not occur until September when the fog lifts.
[Golden Gate bridge towers sticking up above the marine layer. From NOAA]
The National Centers for Environmental Information (NCEI) Warmest Day of the Year” maps are derived from the 1981–2010 U.S. Climate Normals, 30-year averages of climatological variables including the average high temperature for every day. Temperature normals are important indicators that are used in forecasting and monitoring by many U.S. economic sectors. Knowing the probability of high temperatures can help energy companies prepare for rising electricity demand and help farmers monitor heat-sensitive crops. They are also useful planning tools for the healthcare, construction, and tourism industries. You may even want to check the normals at your destination as part of any advance planning your next event or vacation.
Edited for WeatherNation by Meteorologist Mace MichaelsAll Weather News
More
Fronts Continue To Spark Severe Weather Across the Plains
A cold front that brought record lows to the
18 Jul 2025 10:40 PM

Extreme Heat Impacts for the East Coast & South
Extreme heat continues to impact several area
18 Jul 2025 10:05 PM

Flooding Threat Remains Elevated in the East
A cold front pushing through the Eastern Seab
18 Jul 2025 9:10 PM

EF-2 Firenado from the Deer Creek Fire in Utah
A fire tornado was spotted near La Sal, Utah
18 Jul 2025 7:30 AM

Tropical System Brings Flood Risk to the Central Gulf
Time has run out for notable tropical develop
18 Jul 2025 3:05 AM

Heavy Rain, Flooding Threat Returns to Florida
Keep the rain boots handy in Florida - heavy
13 Jul 2025 12:50 PM

Severe Storm Risk Pushes into the Great Lakes, Ohio Valley
Friday was another busy day with severe weath
12 Jul 2025 8:00 PM