NOAA Satellites are Ready for Severe Weather
Special Stories
26 Mar 2020 2:00 AM
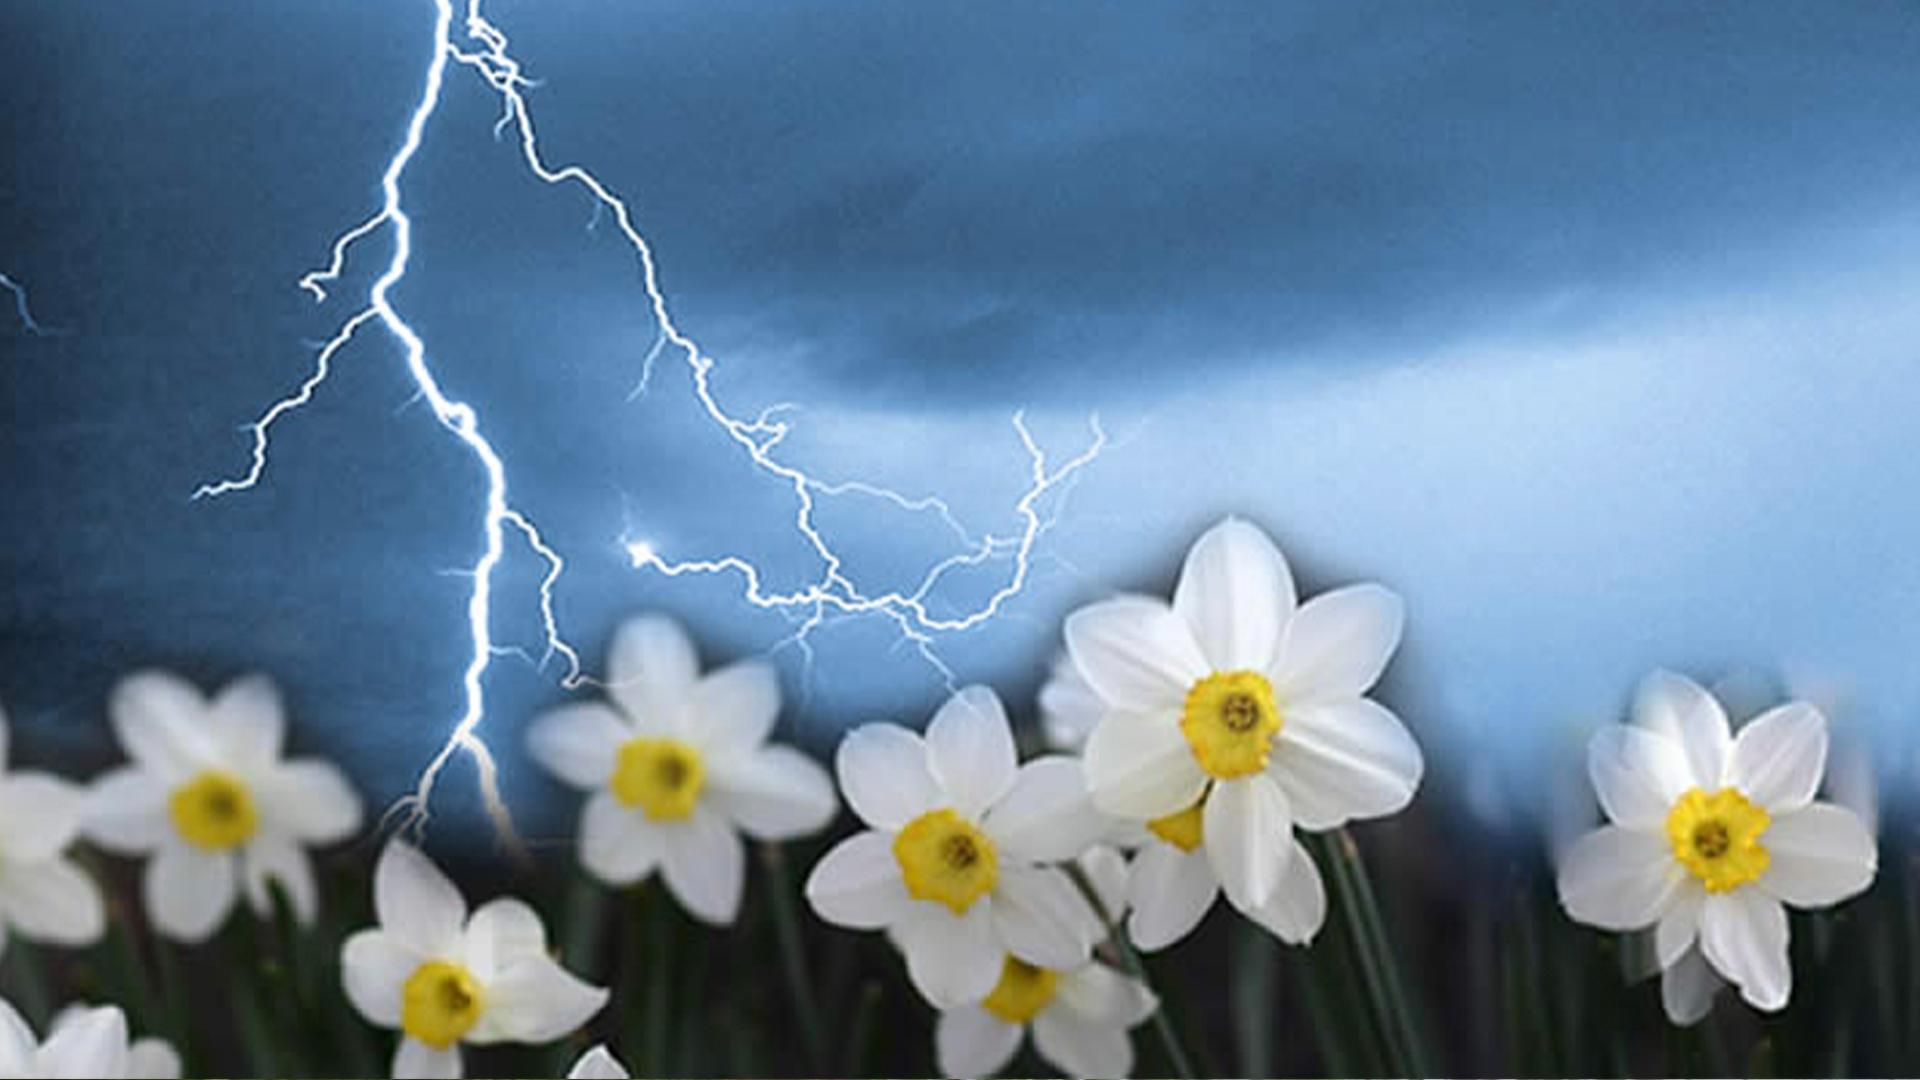
Spring brings the promise of warmer temperatures, blooming flowers, and more people getting outside after being cooped up all winter. Thanks to NOAA satellites, we can see how Earth sheds its winter coat from space this time of year. From melting snow to greening vegetation, satellites monitor the change of seasons and changing weather patterns as Earth makes its yearly trip around the sun.
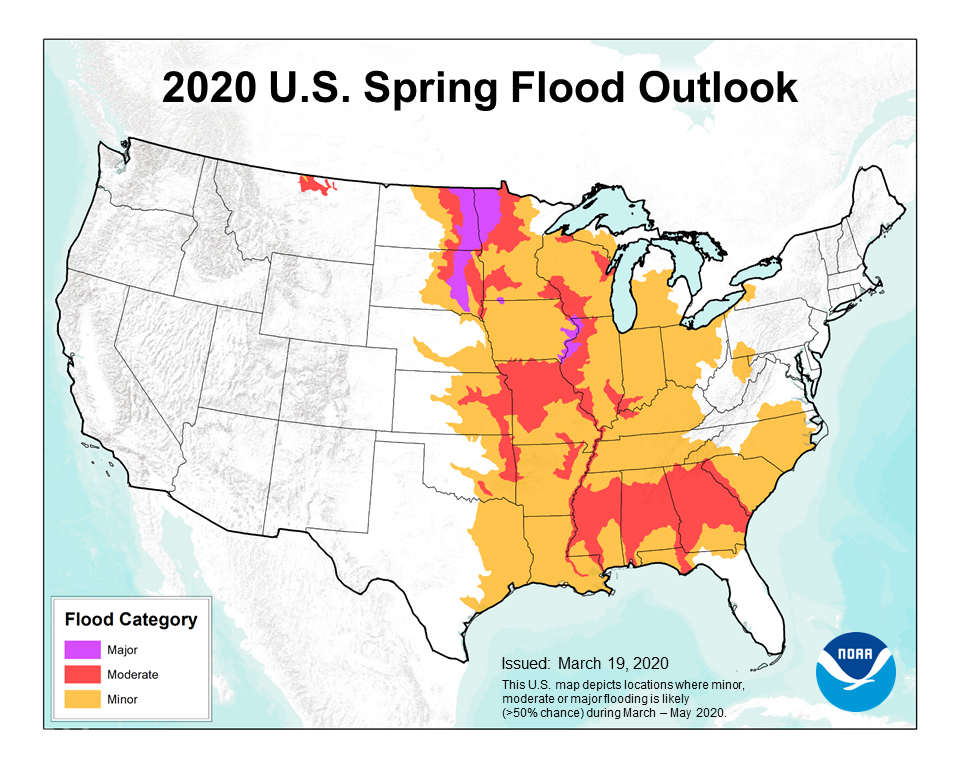
The potential for severe thunderstorms, hail, tornadoes, dangerous lightning, and flooding increases in the spring months. According to NOAA’s 2020 Spring Flood and Climate Outlook, released on March 19, much of the country is looking at above-normal precipitation and an enhanced risk of flooding this spring. GOES-16 (GOES-East) and GOES-17 (GOES-West) are equipped to provide detailed information about the atmosphere and clouds in near real-time to help forecasters provide early warnings of hazardous weather.
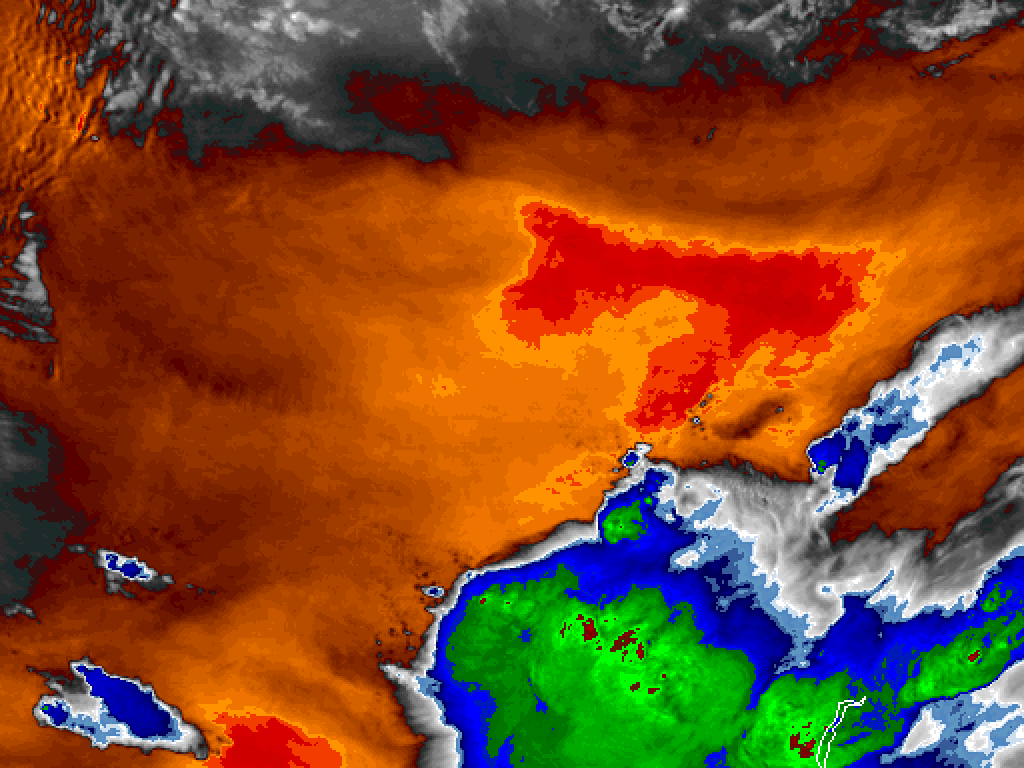 [GOES-16 captured gravity waves induced by convection in Argentina on April 23, 2018. This animation shows colorized infrared imagery from the mid-level tropospheric water vapor ABI channel. This channel is used for mid and upper-level tropospheric water vapor tracking, jet stream identification, hurricane track forecasting, mid-latitude storm forecasting, severe weather analysis, and mid-level moisture estimation. Credit: NOAA/CIRA]
The presence of an above anvil cirrus plume (AACP) is a strong indicator that a storm may produce a tornado, large hail, or powerful winds. Researchers have identified hundreds of plumed storms over the U.S. using high-resolution imagery from GOES-16. Identifying the presence of an AACP can add 10-30 minutes of lead-time for storm warnings.
“Analysis of significant historical severe storm outbreaks reveals that AACPs are routinely present atop the most intense storms,” said Kris Bedka, an atmospheric scientist at NASA's Langley Research Center in Hampton, Virginia. “The improved resolution and rapidly-updating imagery from GOES-16 compared to previous-generation GOES allows forecasters to quickly recognize AACP signatures. AACP recognition, in combination with radar-observed severe storm indicators, can increase forecaster confidence that a storm is likely to produce severe weather and can aid warning where radar data is unavailable.”
[GOES-16 captured gravity waves induced by convection in Argentina on April 23, 2018. This animation shows colorized infrared imagery from the mid-level tropospheric water vapor ABI channel. This channel is used for mid and upper-level tropospheric water vapor tracking, jet stream identification, hurricane track forecasting, mid-latitude storm forecasting, severe weather analysis, and mid-level moisture estimation. Credit: NOAA/CIRA]
The presence of an above anvil cirrus plume (AACP) is a strong indicator that a storm may produce a tornado, large hail, or powerful winds. Researchers have identified hundreds of plumed storms over the U.S. using high-resolution imagery from GOES-16. Identifying the presence of an AACP can add 10-30 minutes of lead-time for storm warnings.
“Analysis of significant historical severe storm outbreaks reveals that AACPs are routinely present atop the most intense storms,” said Kris Bedka, an atmospheric scientist at NASA's Langley Research Center in Hampton, Virginia. “The improved resolution and rapidly-updating imagery from GOES-16 compared to previous-generation GOES allows forecasters to quickly recognize AACP signatures. AACP recognition, in combination with radar-observed severe storm indicators, can increase forecaster confidence that a storm is likely to produce severe weather and can aid warning where radar data is unavailable.”
 [This GOES-16 “sandwich” imagery shows a supercell storm with AACP over Texas on May 5, 2019. Sandwich imagery combines ABI visible and infrared imagery to create multi-dimensional imagery that offers views of storm attributes in rich detail. The mix of visible data and temperature from infrared imagery helps identify key formations in a storm. The green, yellow, and red areas in this animation show the temperatures of cloud tops within the storm. Red represents colder cloud tops, which indicate areas of greater storm updraft intensity. Green areas downwind of the updraft indicate anomalously warm temperatures associated with the AACP. Credit: NOAA/CIRA]
On June 27, 2019, the National Weather Service (NWS) Weather Forecast Office (WFO) in Juneau, Alaska, issued its first-ever severe thunderstorm warning – based on GOES-17 imagery. There are many challenges to issuing weather forecasts in southeast Alaska, including sparse surface observations, large forecast area, poor/no radar coverage, complex terrain, and until GOES-17 arrived, poor geostationary satellite imagery. On this day, they had one-minute ABI imagery that showed the development of thunderstorms over the far southern end of the Alaska Panhandle. Visible imagery showed the presence of overshooting tops, and infrared imagery indicated very cold cloud tops. The colder the cloud top, the more likely the storm is producing rain and severe weather.
[This GOES-16 “sandwich” imagery shows a supercell storm with AACP over Texas on May 5, 2019. Sandwich imagery combines ABI visible and infrared imagery to create multi-dimensional imagery that offers views of storm attributes in rich detail. The mix of visible data and temperature from infrared imagery helps identify key formations in a storm. The green, yellow, and red areas in this animation show the temperatures of cloud tops within the storm. Red represents colder cloud tops, which indicate areas of greater storm updraft intensity. Green areas downwind of the updraft indicate anomalously warm temperatures associated with the AACP. Credit: NOAA/CIRA]
On June 27, 2019, the National Weather Service (NWS) Weather Forecast Office (WFO) in Juneau, Alaska, issued its first-ever severe thunderstorm warning – based on GOES-17 imagery. There are many challenges to issuing weather forecasts in southeast Alaska, including sparse surface observations, large forecast area, poor/no radar coverage, complex terrain, and until GOES-17 arrived, poor geostationary satellite imagery. On this day, they had one-minute ABI imagery that showed the development of thunderstorms over the far southern end of the Alaska Panhandle. Visible imagery showed the presence of overshooting tops, and infrared imagery indicated very cold cloud tops. The colder the cloud top, the more likely the storm is producing rain and severe weather.
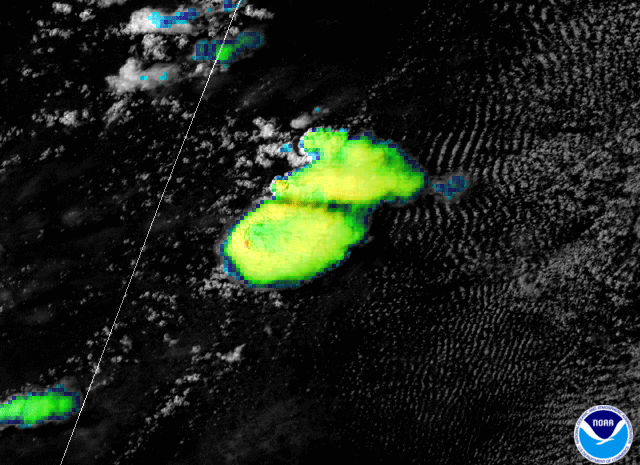
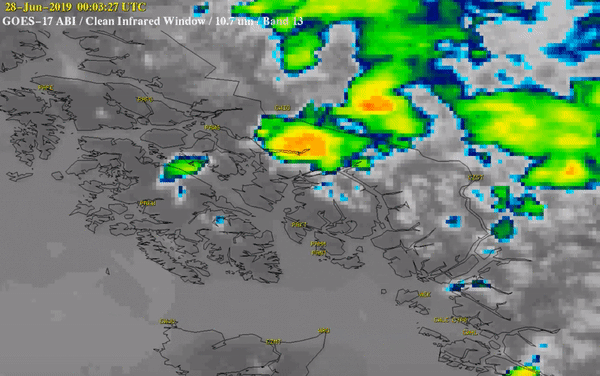 [GOES-17 infrared imagery of the June 27, 2019 storm in Alaska revealed very cold cloud tops. Credit: NOAA/CIMSS]
Rapid increases in lightning (in-cloud and cloud-to-ground) activity often precede severe and tornadic thunderstorms. GOES-16 and GOES-17 are equipped with a Geostationary Lightning Mapper (GLM), the first instrument of its kind. GLM data provide critical information to forecasters, allowing them to identify initial thunderstorm development and focus on potentially severe storms before these storms produce damaging winds, hail or even tornadoes.
https://www.youtube.com/watch?v=5IMjFhJrBfQ&feature=emb_logo
[GOES-17 infrared imagery of the June 27, 2019 storm in Alaska revealed very cold cloud tops. Credit: NOAA/CIMSS]
Rapid increases in lightning (in-cloud and cloud-to-ground) activity often precede severe and tornadic thunderstorms. GOES-16 and GOES-17 are equipped with a Geostationary Lightning Mapper (GLM), the first instrument of its kind. GLM data provide critical information to forecasters, allowing them to identify initial thunderstorm development and focus on potentially severe storms before these storms produce damaging winds, hail or even tornadoes.
https://www.youtube.com/watch?v=5IMjFhJrBfQ&feature=emb_logo
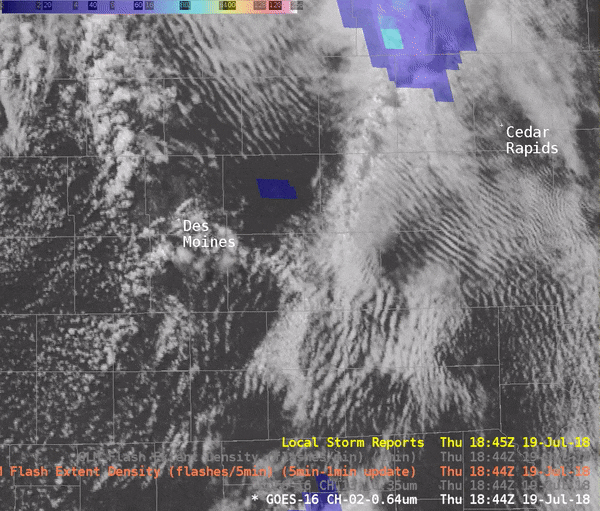 [GOES-16 one-minute visible imagery with GLM data overlaid for a tornadic storm in Iowa on July 19, 2018. Credit: Satellite Liason Blog/NOAA]
GOES-16 GLM data was critical for the Huntsville, Alabama NWS WFO warning decision-making process during a period of severe weather on January 11, 2020, when radar data were limited. GLM data helped forecasters decide to extend the location of a tornado warning after observing an increase in lightning activity. The first warning including Union Grove, Alabama, was issued 17 minutes before an EF-2 tornado hit Brindlee Mountain Primary School. GLM data also helped the forecasters communicate the urgency of the situation to Marshall County first responders as the Union Grove event unfolded.
[GOES-16 one-minute visible imagery with GLM data overlaid for a tornadic storm in Iowa on July 19, 2018. Credit: Satellite Liason Blog/NOAA]
GOES-16 GLM data was critical for the Huntsville, Alabama NWS WFO warning decision-making process during a period of severe weather on January 11, 2020, when radar data were limited. GLM data helped forecasters decide to extend the location of a tornado warning after observing an increase in lightning activity. The first warning including Union Grove, Alabama, was issued 17 minutes before an EF-2 tornado hit Brindlee Mountain Primary School. GLM data also helped the forecasters communicate the urgency of the situation to Marshall County first responders as the Union Grove event unfolded.
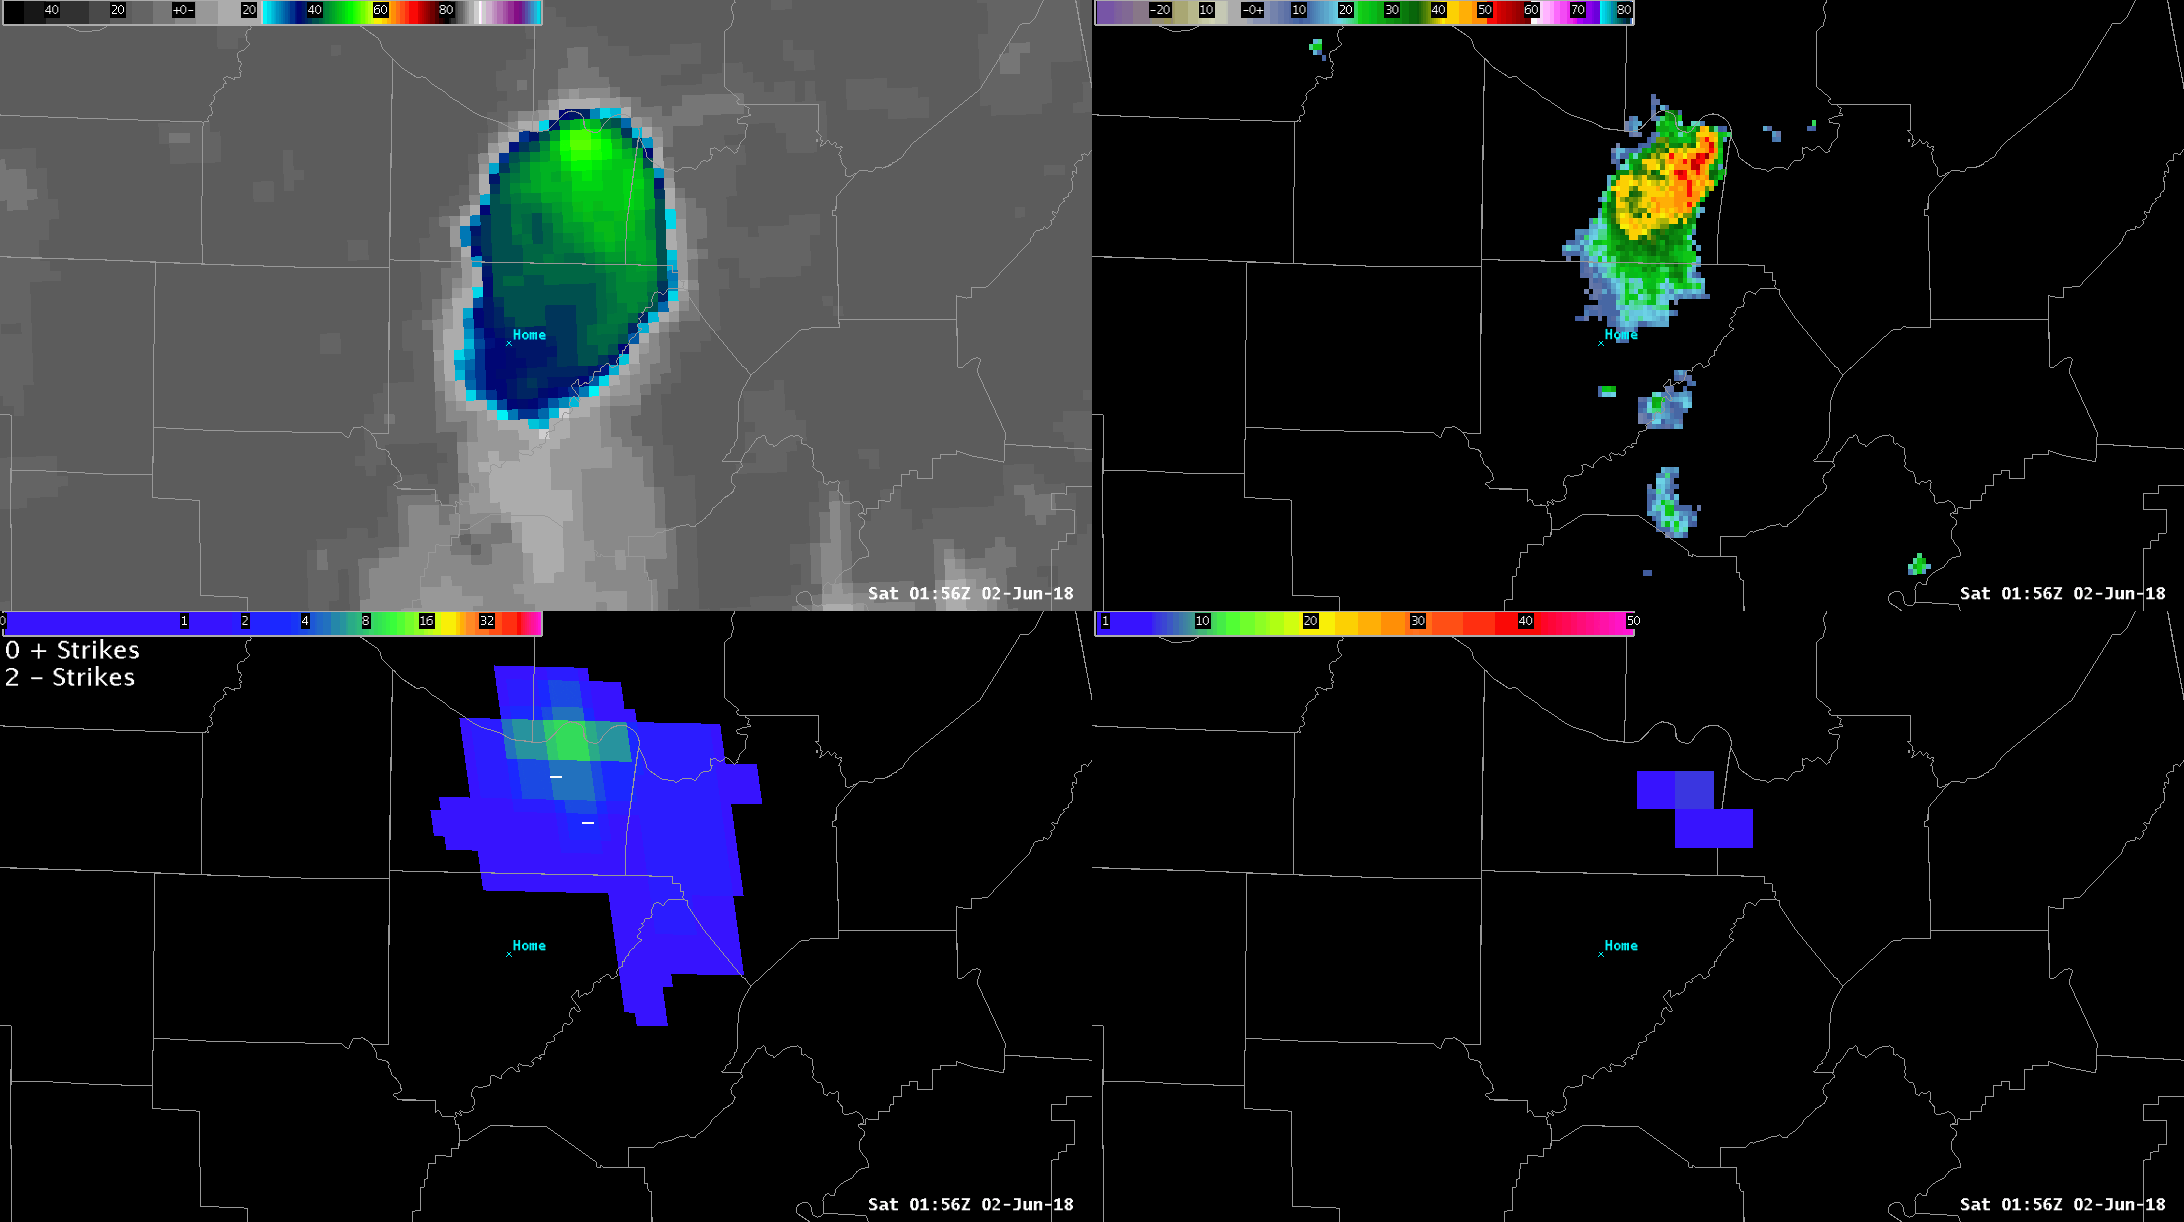 [June 1, 2018 Alabama storms. Animation GOES-16 Clean IR 1-minute imagery (top-left), MRMS radar reflectivity (top-right), Earth Networks 8-km Total Flash Density (bottom-right), GLM FED and NLDN plot (bottom-left). From NASASport]
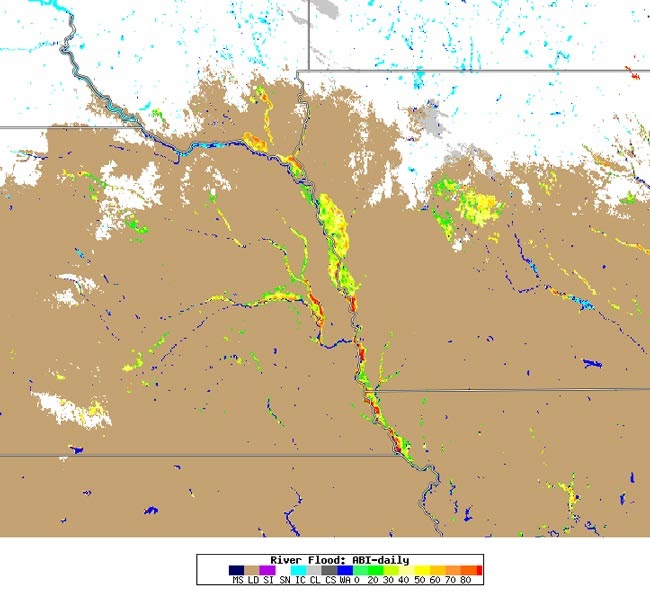 [Severe weather in the Midwest March 12-14, 2019 caused severe flooding in southeastern South Dakota, eastern Nebraska, and western/central Iowa, as seen in the flood map from March 16. Flooding is seen in yellow, green, orange and red. Brown represents land, and dark blue is normal water levels within bodies of water. White is snow cover, with ice shown in cyan. Credit: Sanmei Li and Donglian Sun, George Mason University and SSEC/RealEarth]
Severe thunderstorms
In the U.S., thunderstorms are most likely to occur in the spring and summer months and during the afternoon and evening hours, but they can occur year-round and at all hours. A thunderstorm is classified as “severe” when it contains one or more of the following: hail one inch or greater in diameter, winds gusting in excess of 58 miles per hour, or a tornado. The GOES-16 and GOES-17 Advanced Baseline Imager (ABI) provides three times more information about cloud properties and atmospheric conditions that lead to severe weather than the imager on previous GOES. ABI can also see clouds in much finer detail, revealing the presence of overshooting tops, gravity waves, and above anvil cirrus plumes, which indicate a storm may be severe. ABI also provides frequent updates, scanning a targeted area of severe weather as often as every 30 seconds. This rapid imaging allows forecasters to track meteorological phenomena that change very quickly with time.
[GOES-16 captured gravity waves induced by convection in Argentina on April 23, 2018. This animation shows colorized infrared imagery from the mid-level tropospheric water vapor ABI channel. This channel is used for mid and upper-level tropospheric water vapor tracking, jet stream identification, hurricane track forecasting, mid-latitude storm forecasting, severe weather analysis, and mid-level moisture estimation. Credit: NOAA/CIRA]
The presence of an above anvil cirrus plume (AACP) is a strong indicator that a storm may produce a tornado, large hail, or powerful winds. Researchers have identified hundreds of plumed storms over the U.S. using high-resolution imagery from GOES-16. Identifying the presence of an AACP can add 10-30 minutes of lead-time for storm warnings.
“Analysis of significant historical severe storm outbreaks reveals that AACPs are routinely present atop the most intense storms,” said Kris Bedka, an atmospheric scientist at NASA's Langley Research Center in Hampton, Virginia. “The improved resolution and rapidly-updating imagery from GOES-16 compared to previous-generation GOES allows forecasters to quickly recognize AACP signatures. AACP recognition, in combination with radar-observed severe storm indicators, can increase forecaster confidence that a storm is likely to produce severe weather and can aid warning where radar data is unavailable.”
[This GOES-16 “sandwich” imagery shows a supercell storm with AACP over Texas on May 5, 2019. Sandwich imagery combines ABI visible and infrared imagery to create multi-dimensional imagery that offers views of storm attributes in rich detail. The mix of visible data and temperature from infrared imagery helps identify key formations in a storm. The green, yellow, and red areas in this animation show the temperatures of cloud tops within the storm. Red represents colder cloud tops, which indicate areas of greater storm updraft intensity. Green areas downwind of the updraft indicate anomalously warm temperatures associated with the AACP. Credit: NOAA/CIRA]
On June 27, 2019, the National Weather Service (NWS) Weather Forecast Office (WFO) in Juneau, Alaska, issued its first-ever severe thunderstorm warning – based on GOES-17 imagery. There are many challenges to issuing weather forecasts in southeast Alaska, including sparse surface observations, large forecast area, poor/no radar coverage, complex terrain, and until GOES-17 arrived, poor geostationary satellite imagery. On this day, they had one-minute ABI imagery that showed the development of thunderstorms over the far southern end of the Alaska Panhandle. Visible imagery showed the presence of overshooting tops, and infrared imagery indicated very cold cloud tops. The colder the cloud top, the more likely the storm is producing rain and severe weather.
[GOES-17 infrared imagery of the June 27, 2019 storm in Alaska revealed very cold cloud tops. Credit: NOAA/CIMSS]
Rapid increases in lightning (in-cloud and cloud-to-ground) activity often precede severe and tornadic thunderstorms. GOES-16 and GOES-17 are equipped with a Geostationary Lightning Mapper (GLM), the first instrument of its kind. GLM data provide critical information to forecasters, allowing them to identify initial thunderstorm development and focus on potentially severe storms before these storms produce damaging winds, hail or even tornadoes.
https://www.youtube.com/watch?v=5IMjFhJrBfQ&feature=emb_logo
Tornados
Most tornadoes in the United States occur in two regions--Florida and the Great Plains. Located in the central United States, the Great Plains often has ideal conditions for the formation of severe thunderstorms. In this area, known as Tornado Alley, storms can develop when dry cold air moving southward from Canada meets warm moist air traveling northward from the Gulf of Mexico. Tornadoes can form at any time of year, but most occur in the spring and summer months along with thunderstorms. May and June are usually the peak months for tornadoes. Severe thunderstorms developed across central Iowa during the afternoon of July 19, 2018, producing multiple tornadoes. Fortunately, one-minute imagery from GOES-16 was available over the region to aid forecasters during the event. GOES-16 winds data indicated favorable conditions for a supercell to develop. Supercells are storms that contain rotating updrafts and generate the vast majority of long-lived strong and violent tornadoes, as well as wind damage and large hail. The first tornado was reported around 2:50 p.m. EDT, just as GLM data showed lightning activity rapidly increasing. GOES-16 one-minute imagery from the July 19 storm showed overshooting tops and an above anvil cirrus plume.
[GOES-16 one-minute visible imagery with GLM data overlaid for a tornadic storm in Iowa on July 19, 2018. Credit: Satellite Liason Blog/NOAA]
GOES-16 GLM data was critical for the Huntsville, Alabama NWS WFO warning decision-making process during a period of severe weather on January 11, 2020, when radar data were limited. GLM data helped forecasters decide to extend the location of a tornado warning after observing an increase in lightning activity. The first warning including Union Grove, Alabama, was issued 17 minutes before an EF-2 tornado hit Brindlee Mountain Primary School. GLM data also helped the forecasters communicate the urgency of the situation to Marshall County first responders as the Union Grove event unfolded.
Lightning strike hazards
GLM provides new insights on the duration and extent of individual lightning strikes. Lightning can travel hundreds of miles before striking the ground. GLM can show forecasters areas far from the main line of storms where the risk of lightning strikes to the ground presents a public safety hazard. In 2018, GLM captured a lightning flash over the southern United States that sprawled some 44,000 square miles—nearly the area of Ohio. Lightning is a significant threat to life and property, and particularly hazardous for those working outdoors and participating in outdoor recreational activities and events. Knowing the extent of lightning flashes within a storm can help forecasters and emergency managers determine the public safety threat. In June 2018, forecasters used GOES-16 GLM data to evaluate the threat to 33,000 people attending an outdoor music concert in Cullman, Alabama. A cluster of storms formed on the evening of the concert, but thanks to GLM flash extent data, forecasters were able to determine that lightning would not be a threat to the concert.
[June 1, 2018 Alabama storms. Animation GOES-16 Clean IR 1-minute imagery (top-left), MRMS radar reflectivity (top-right), Earth Networks 8-km Total Flash Density (bottom-right), GLM FED and NLDN plot (bottom-left). From NASASport]
Flooding
Accurate, timely, and reliable information on rainfall is vital for predicting flash floods and responding to flood events. NOAA flood maps use data from the polar-orbiting NOAA-NASA Suomi NPP and NOAA-20 satellites, as well as from the geostationary GOES-16 and GOES-17 satellites. These maps, along with aircraft, unmanned drones, and ground assets help determine the impact of a storm – where flooding is happening, what the extent is, as well as how long it will last and what damage has occurred. The flood maps are provided to FEMA, local emergency managers, and first responders to help them quickly determine where to employ limited resources, where to issue evacuations, when it’s safe for people to return to their homes, and where to focus recovery efforts.
[Severe weather in the Midwest March 12-14, 2019 caused severe flooding in southeastern South Dakota, eastern Nebraska, and western/central Iowa, as seen in the flood map from March 16. Flooding is seen in yellow, green, orange and red. Brown represents land, and dark blue is normal water levels within bodies of water. White is snow cover, with ice shown in cyan. Credit: Sanmei Li and Donglian Sun, George Mason University and SSEC/RealEarth]
Protecting lives and property
Spring brings milder temperatures but also an increased chance of hazardous weather. Severe weather and flooding can strike anywhere, whether or not you are in a high-risk area. GOES-16 and GOES-17 continuously monitor Earth and identify potentially severe weather faster than ever before. New capabilities allow the satellites to see cloud features in much finer detail and monitor lightning activity to identify storms that are likely to become dangerous. The ability to monitor storms in near real-time allows forecasters to track rapidly changing weather conditions and give advance warning of severe thunderstorms, tornadoes, and flooding. Better forecasts and earlier warning of severe weather help keep us safe from spring weather hazards and enable officials to make better decisions about evacuations and other critical public safety matters. https://www.youtube.com/watch?v=4OC8FAugjGo&feature=emb_logo [Kevin Fryar, meteorologist and GOES-R program chief of staff, explains how NOAA satellites see Earth shed its winter coat and transition to spring. With spring, comes increased potential for severe weather, and NOAA satellites are here to keep us safe.]Characteristics of a severe storm
Anvil cloud: flat cloud formation at the top of a storm, often shaped like an anvil. An anvil forms when warm, rising air has reached a point where the surrounding air is about the same temperature or even warmer. Above anvil cirrus plume (AACP): complex cloud phenomenon that looks a bit like a plume of smoke emanating out from the top of a storm. Convection: vertical transport of heat and moisture in the atmosphere, especially by updrafts and downdrafts in an unstable atmosphere. Gravity waves: similar to waves on the surface of the ocean, but they roll through the air and cloud tops instead of water; they are typically initiated by overshooting tops atop thunderstorm anvils. Overshooting top: dome-like protrusion above a thunderstorm cloud, indicative of a higher potential for severe weather from that storm. Updraft: rising column of warm air.All Weather News
More


Western Heat Wave Pushes into Work Week
Another ridge of high pressure is parked over
16 Jun 2026 4:50 PM

First Forecast Cone of the Atlantic Basin Issued Tuesday Morning
AtlanticThe first area of investigation of th
16 Jun 2026 2:10 PM

Welcome To Monsoon Season - Here's What to Expect
WELCOME TO THE NORTH AMERICAN MONSOON SEASON.
15 Jun 2026 8:00 PM

El Niño Forms, Very Strong El Niño Likely Late 2026
El Niño has arrived! It didn't take long for
15 Jun 2026 8:00 AM

Confirmed Tornadoes in Ohio and Pennsylvania on Sunday
A cold front on Sunday brought severe weather
15 Jun 2026 1:50 AM