Satellite Imagery RGBs: Adding Value, Saving Time
Special Stories
21 Oct 2019 1:05 AM
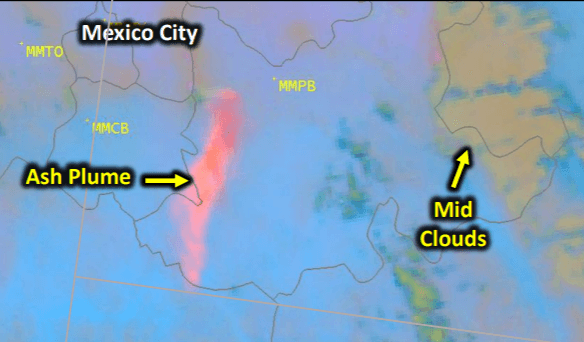
[Volcanic ash RGB from GOES-16 satellite center on southern Mexico]
[NOAA] With the advent of the GOES-R Series, forecasters now have an overwhelming amount of information to sift through. The Advanced Baseline Imager (ABI) instrument has 16 channels that image Earth’s weather, oceans and environment as often as every 30 seconds. How can meteorologists quickly discern the information they need to issue timely forecasts and warnings? Scientists are working on new ways to combine information from multiple ABI channels to enhance meteorological features of interest. The result is a variety of red-green-blue or “RGB” composite imagery. The stunning, colorful imagery you see from GOES-16 and GOES-17 isn’t just beautiful to look at, it also provides critical information to forecasters for situational awareness and nowcasting rapidly changing weather.
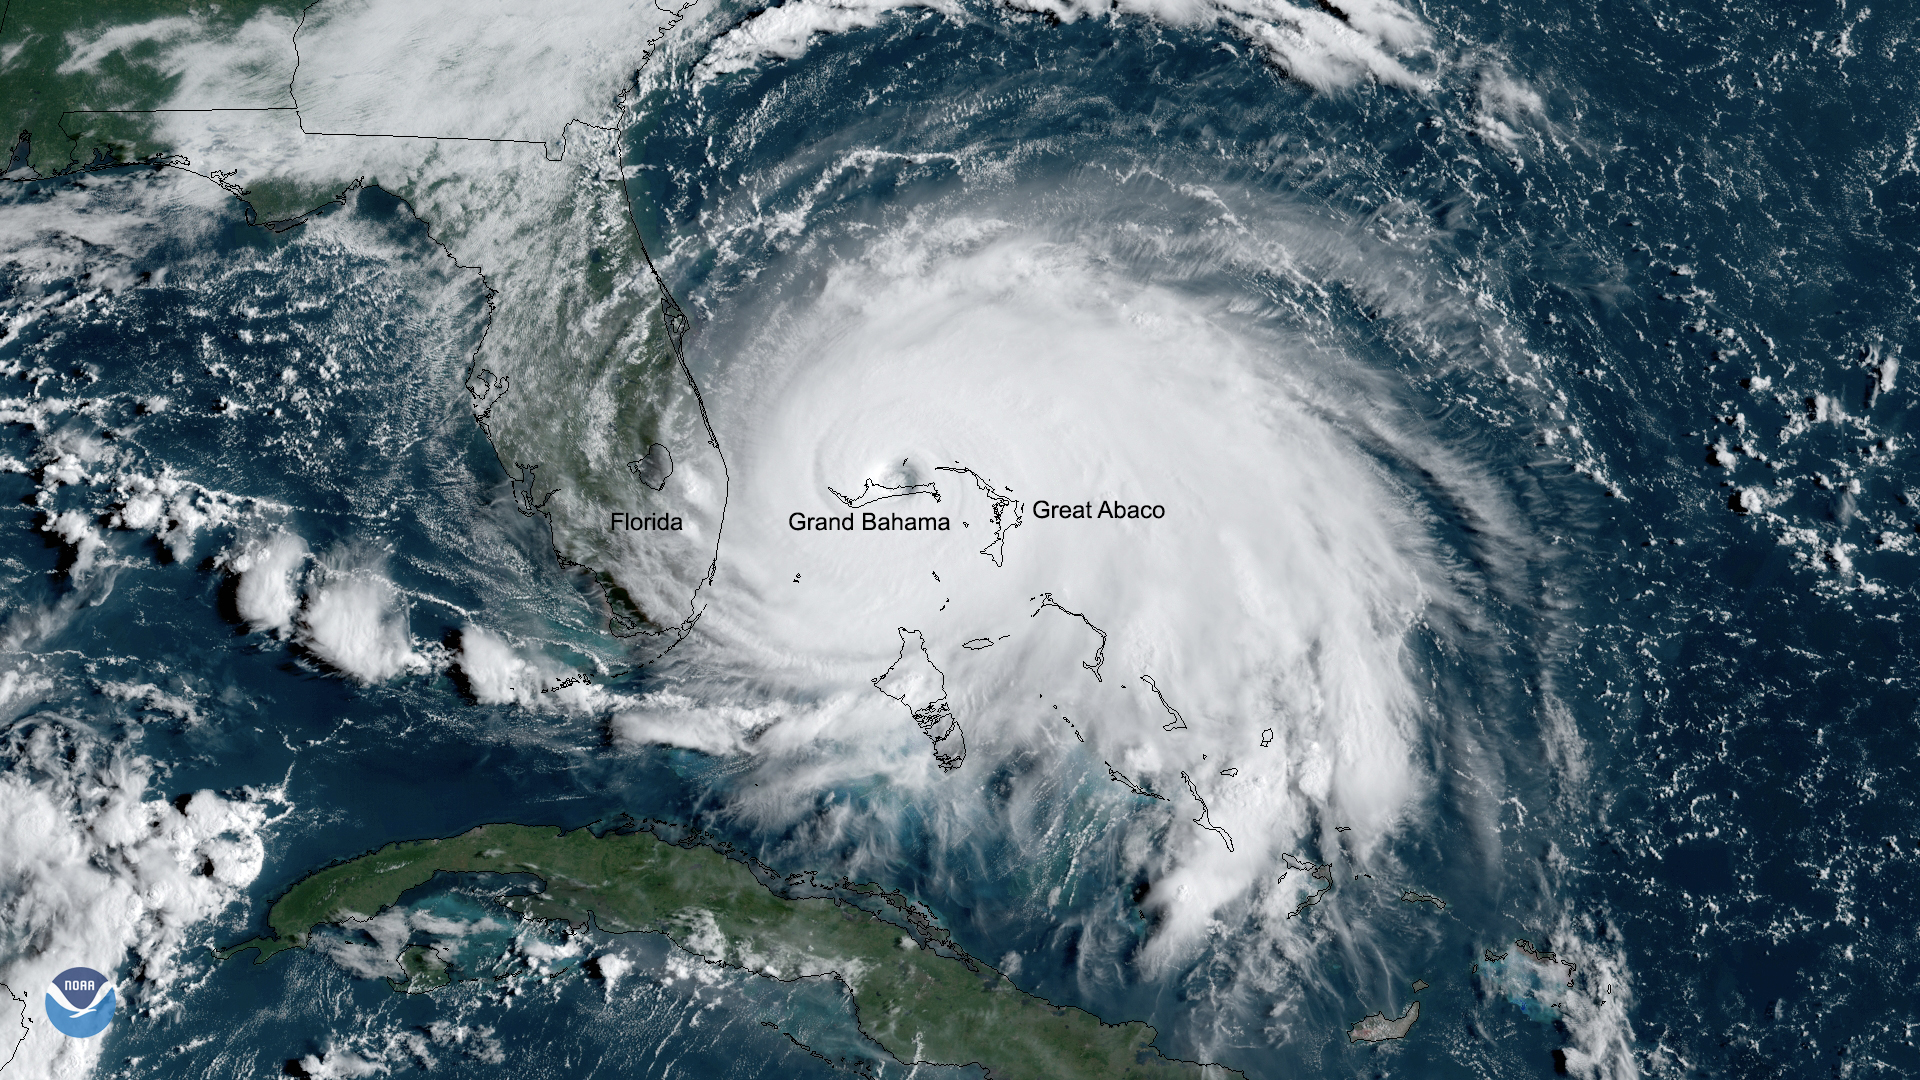 [Category 5 Hurricane Dorian stalled over Grand Bahama on September 2, 2019. Credit: NOAA/CIRA]
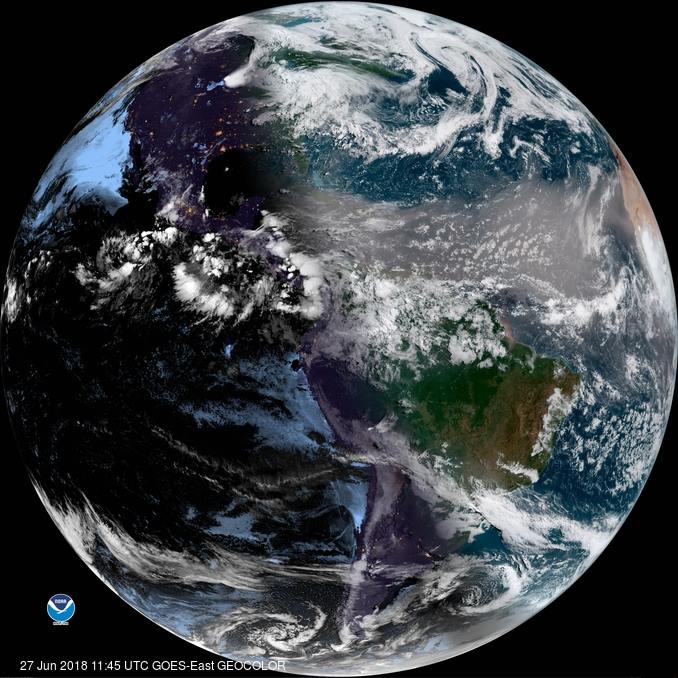 [GOES-16 (GOES East) full disk GeoColor image from June 27, 2019, shows Saharan dust blowing across the Atlantic. Credit: NOAA/CIRA]
Science meets art
“I think of RGBs as a place where science meets art,” says Steven Miller, senior research scientist at the Cooperative Institute for Research in the Atmosphere (CIRA) in Fort Collins, Colo., and developer of GeoColor. “Effective RGBs must strike a careful balance between the two; maximizing information content while minimizing interpretation time. Scientifically, it’s necessary to develop algorithms capable of distilling the complex scene into a targeted set of features. The design and construction of visually intuitive displays bring artistry into the fold. For the RGB to be most useful, it must clearly communicate multiple features unambiguously within a single display. With ABI, the canvass, brushes and paints available to developers in this regard have expanded dramatically.”
[GOES-16 (GOES East) full disk GeoColor image from June 27, 2019, shows Saharan dust blowing across the Atlantic. Credit: NOAA/CIRA]
Science meets art
“I think of RGBs as a place where science meets art,” says Steven Miller, senior research scientist at the Cooperative Institute for Research in the Atmosphere (CIRA) in Fort Collins, Colo., and developer of GeoColor. “Effective RGBs must strike a careful balance between the two; maximizing information content while minimizing interpretation time. Scientifically, it’s necessary to develop algorithms capable of distilling the complex scene into a targeted set of features. The design and construction of visually intuitive displays bring artistry into the fold. For the RGB to be most useful, it must clearly communicate multiple features unambiguously within a single display. With ABI, the canvass, brushes and paints available to developers in this regard have expanded dramatically.”
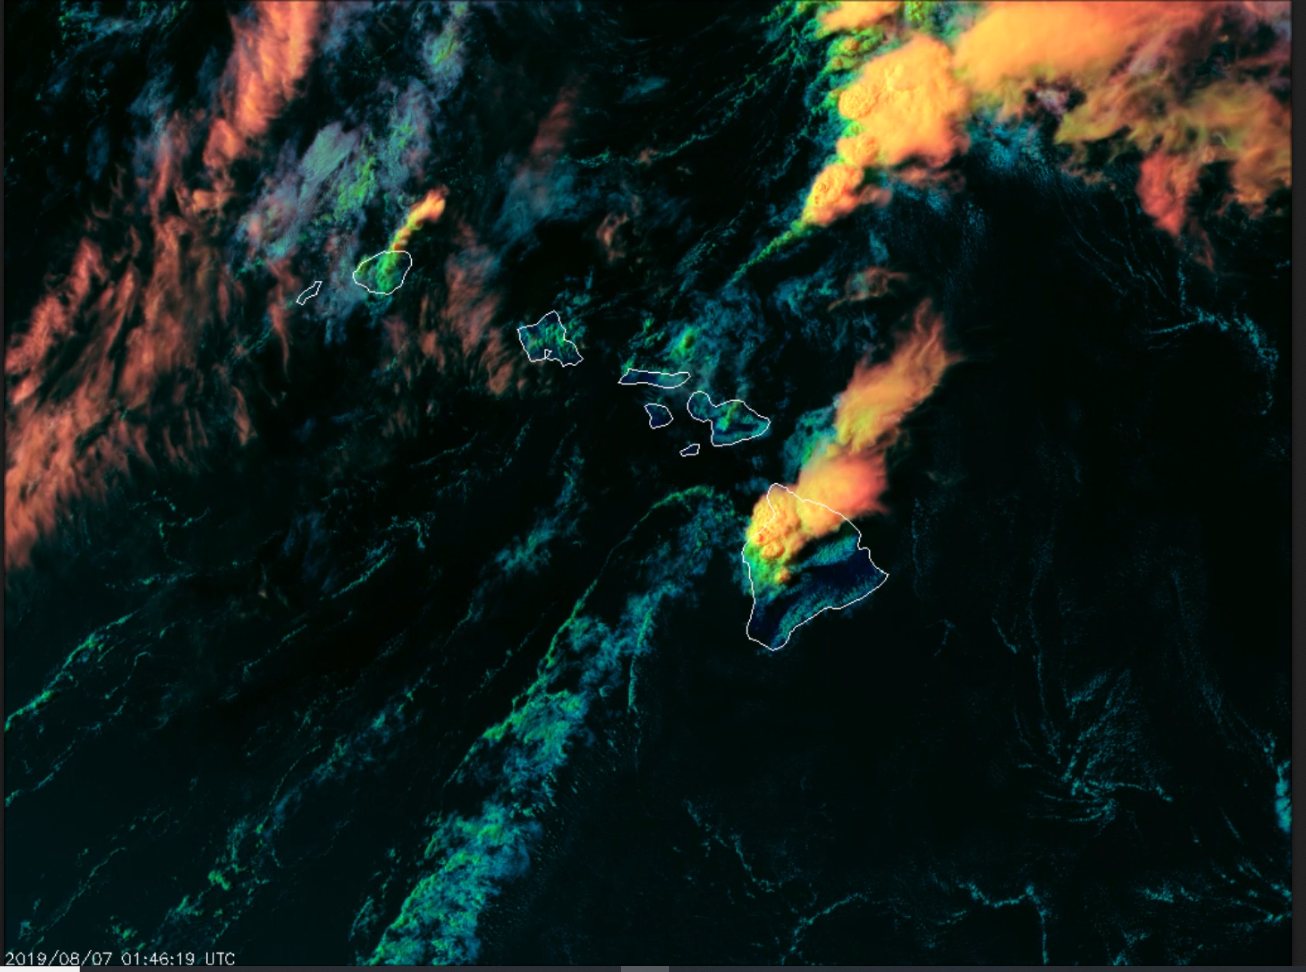 [This day cloud phase distinction RGB imagery over Hawaii on Aug. 7, 2019, captured by GOES-17 (GOES West), shows rare thunderstorms on the very arid, leeward side of Hawaii’s “Big Island.” This type of imagery is used to evaluate the phase (liquid, ice, or mixed) of cloud tops to monitor convective initiation, storm growth, and decay. Thin, high-level clouds with ice particles appear red/orange; thick, high-level clouds with ice particles are yellow; cloud particles that are transforming from water droplets to ice crystals appear green; and low-level clouds with water droplets are cyan and lavender. Forecasters can use this RGB to quickly identify the various stages of convective cloud development as they progress from cyan to green to yellow. Credit: NOAA/CIRA]
This article highlights just a few examples of RGBs that utilize GOES-R data. Other examples include day snow fog, sulfur dioxide, volcanic ash, day cloud convection, nighttime microphysics, day land cloud fire, and air mass. This “value added” imagery is proving successful in conveying complex environmental information from large satellite datasets to forecasters, analysts, researchers, and the public alike.
[This day cloud phase distinction RGB imagery over Hawaii on Aug. 7, 2019, captured by GOES-17 (GOES West), shows rare thunderstorms on the very arid, leeward side of Hawaii’s “Big Island.” This type of imagery is used to evaluate the phase (liquid, ice, or mixed) of cloud tops to monitor convective initiation, storm growth, and decay. Thin, high-level clouds with ice particles appear red/orange; thick, high-level clouds with ice particles are yellow; cloud particles that are transforming from water droplets to ice crystals appear green; and low-level clouds with water droplets are cyan and lavender. Forecasters can use this RGB to quickly identify the various stages of convective cloud development as they progress from cyan to green to yellow. Credit: NOAA/CIRA]
This article highlights just a few examples of RGBs that utilize GOES-R data. Other examples include day snow fog, sulfur dioxide, volcanic ash, day cloud convection, nighttime microphysics, day land cloud fire, and air mass. This “value added” imagery is proving successful in conveying complex environmental information from large satellite datasets to forecasters, analysts, researchers, and the public alike.
[Category 5 Hurricane Dorian stalled over Grand Bahama on September 2, 2019. Credit: NOAA/CIRA]
RGBs explained
RGB composite imagery combines multispectral information (data from multiple channels) from ABI to highlight the presence and evolution of important meteorological phenomena like fog, dust, fire hot spots and smoke, snow/ice, volcanic ash plumes, cloud properties, air mass temperature and moisture characteristics, and more. RGB imagery is created by combining two or more ABI channels, channel differences, or more complex operations into red, green, and blue color “components.” These are sometimes referred to as “color guns,” terminology inherited from the electron guns at the rear of old fashioned cathode-ray tube televisions, which combine these three primary colors at different intensities to form all the possible colors. When combined in a specific “recipe,” a single image results, with the colors combining to form all the possible colors perceivable by human vision. The final product highlights atmospheric and surface features (depending on the recipe enlisted) that are difficult or more time-consuming to distinguish with single-channel images alone. https://www.youtube.com/watch?v=JhBuHiXzsH0 [GOES-16 (GOES East) fire temperature RGB imagery of the “Camp Fire” in northern California on November 8, 2018. The wildfire developed in the early morning hours and spread quickly within very windy and dry weather conditions. Hot spots and a large plume of smoke are seen in this imagery, which is created using fire temperature RGB imagery and making it partially transparent then placing it over a GeoColor enhancement, so both the fire's hot spots and smoke plume are visible. Credit: NOAA/CIRA]Assisting forecasters on the fly
Meteorologists operate in a time-critical environment and often aren’t able to examine every ABI channel to analyze and understand a particular scene of interest. Also, certain features are not always readily apparent from single-channel imagery, but instead require taking the difference between two bands and scaling the output appropriately. These types of advanced data manipulations can be difficult for a forecaster working under tight deadlines. RGBs are an excellent way to display multispectral information in a single, easy-to-interpret image. RGBs can also be overlaid with quantitative information such as model data or other observational data, enabling more sophisticated analysis. https://www.youtube.com/watch?v=puWMYlrYyHw [This dust RGB imagery from GOES-16 (GOES East) shows a large plume of dust from the desert southwest being dragged eastward, across northwestern Texas and east Oklahoma, by a front moving over the high plains in the early morning hours of March 24, 2017. The dust appears as magenta or pink. Also seen in this imagery is moist air (blue), thick mid-level clouds (brown), mid-level, thin clouds (green), and high, thin ice clouds (black). Credit: NOAA/CIRA]GeoColor
Many of the GOES-16 and GOES-17 images we see on TV and online are displayed in an RGB called “GeoColor.” This RGB uses five ABI channels and appears differently during daytime than at night. During the day, wavelengths from the red and blue portions of the visible light spectrum are merged with a simulated green channel (the ABI lacks a channel in the “green” portion of the spectrum) to approximate how the human eye observes the world via color vision. At night, infrared imagery is incorporated that shows high clouds as white and low clouds and fog as light blue (referred to as a “false color” enhancement). Also in the nighttime GeoColor imagery, a static “city lights” background map derived from clear-sky Suomi-NPP satellite Visible Infrared Imaging Radiometer Suite (VIIRS) Day/Night Band data is used to help orient weather phenomena to major population centers. The Day/Night Band is sensitive to extremely low signals of visible light as produced by cities and moonlight reflectance at night. GeoColor can be used to differentiate clouds from other features, such as smoke or blowing dust during the daytime, and for nighttime cloud detection.
[GOES-16 (GOES East) full disk GeoColor image from June 27, 2019, shows Saharan dust blowing across the Atlantic. Credit: NOAA/CIRA]
Science meets art
“I think of RGBs as a place where science meets art,” says Steven Miller, senior research scientist at the Cooperative Institute for Research in the Atmosphere (CIRA) in Fort Collins, Colo., and developer of GeoColor. “Effective RGBs must strike a careful balance between the two; maximizing information content while minimizing interpretation time. Scientifically, it’s necessary to develop algorithms capable of distilling the complex scene into a targeted set of features. The design and construction of visually intuitive displays bring artistry into the fold. For the RGB to be most useful, it must clearly communicate multiple features unambiguously within a single display. With ABI, the canvass, brushes and paints available to developers in this regard have expanded dramatically.”
[This day cloud phase distinction RGB imagery over Hawaii on Aug. 7, 2019, captured by GOES-17 (GOES West), shows rare thunderstorms on the very arid, leeward side of Hawaii’s “Big Island.” This type of imagery is used to evaluate the phase (liquid, ice, or mixed) of cloud tops to monitor convective initiation, storm growth, and decay. Thin, high-level clouds with ice particles appear red/orange; thick, high-level clouds with ice particles are yellow; cloud particles that are transforming from water droplets to ice crystals appear green; and low-level clouds with water droplets are cyan and lavender. Forecasters can use this RGB to quickly identify the various stages of convective cloud development as they progress from cyan to green to yellow. Credit: NOAA/CIRA]
This article highlights just a few examples of RGBs that utilize GOES-R data. Other examples include day snow fog, sulfur dioxide, volcanic ash, day cloud convection, nighttime microphysics, day land cloud fire, and air mass. This “value added” imagery is proving successful in conveying complex environmental information from large satellite datasets to forecasters, analysts, researchers, and the public alike.All Weather News
More
Fronts Continue To Spark Severe Weather Across the Plains
A cold front that brought record lows to the
18 Jul 2025 10:40 PM

Extreme Heat Impacts for the East Coast & South
Extreme heat continues to impact several area
18 Jul 2025 10:05 PM

Flooding Threat Remains Elevated in the East
A cold front pushing through the Eastern Seab
18 Jul 2025 9:10 PM

EF-2 Firenado from the Deer Creek Fire in Utah
A fire tornado was spotted near La Sal, Utah
18 Jul 2025 7:30 AM

Tropical System Brings Flood Risk to the Central Gulf
Time has run out for notable tropical develop
18 Jul 2025 3:05 AM

Heavy Rain, Flooding Threat Returns to Florida
Keep the rain boots handy in Florida - heavy
13 Jul 2025 12:50 PM

Severe Storm Risk Pushes into the Great Lakes, Ohio Valley
Friday was another busy day with severe weath
12 Jul 2025 8:00 PM