September El Nino Update: Feeling Neutral
Special Stories
12 Sep 2019 10:57 PM
[NOAA by Emily Becker] El Niño 2019 is a thing of the past, and neutral conditions reign, as we discussed last month. So where do we go from here? Forecasters estimate a 75% probability that we’ll hang out in neutral through the fall, with a 55-60% chance of continued neutral conditions through the spring of 2020. Most of the climate models estimate that the surface temperature of the tropical Pacific Ocean will remain slightly above average, but below the El Niño threshold of 0.5°C (0.9°F) above the long-term average.
 [Animation showing sea surface temperature departure from the long-term average from July through early September 2019. Graphic by NOAA Climate; data from NOAA’s Environmental Visualization Lab.]
The territory between the El Niño threshold and La Niña (0.5°C below the long-term average) is designated ENSO-neutral. (ENSO = El Niño/Southern Oscillation—the whole El Niño/La Niña atmosphere-ocean system). In August, the Niño3.4 index in the east-central tropical Pacific was very close to the long-term average. The Oceanic Niño Index, the 3-month average and our official ENSO measurement, was 0.3°C warmer than average for June–August, marking the first ENSO-neutral season since last year.
[Animation showing sea surface temperature departure from the long-term average from July through early September 2019. Graphic by NOAA Climate; data from NOAA’s Environmental Visualization Lab.]
The territory between the El Niño threshold and La Niña (0.5°C below the long-term average) is designated ENSO-neutral. (ENSO = El Niño/Southern Oscillation—the whole El Niño/La Niña atmosphere-ocean system). In August, the Niño3.4 index in the east-central tropical Pacific was very close to the long-term average. The Oceanic Niño Index, the 3-month average and our official ENSO measurement, was 0.3°C warmer than average for June–August, marking the first ENSO-neutral season since last year.
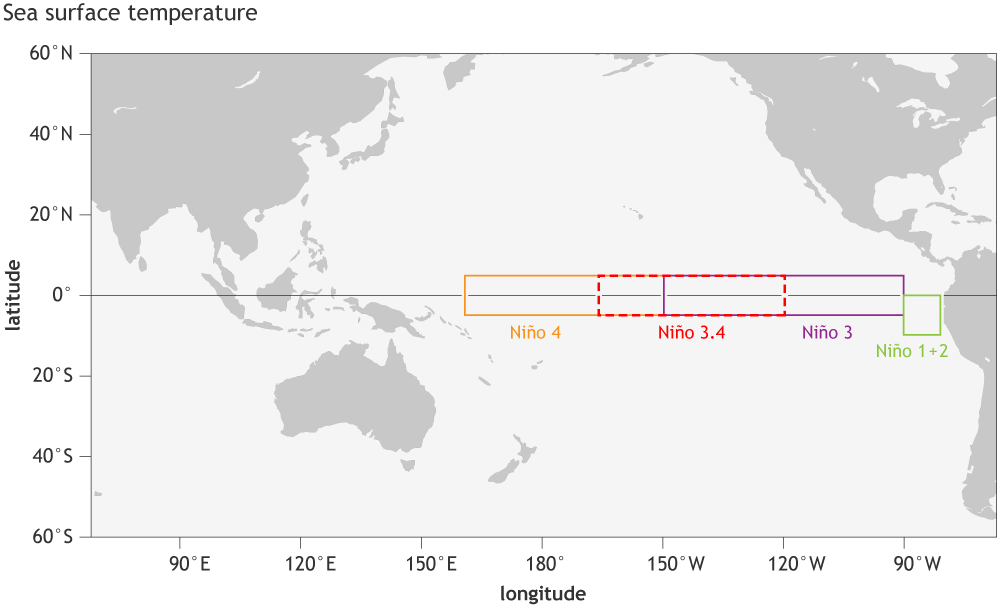 [Location of the Niño regions for measuring sea surface temperature in the eastern and central tropical Pacific Ocean. The sea surface temperature in the Niño3.4 region, spanning from 120˚W to 170˚W longitude, when averaged over a 3-month period, forms NOAA’s official Oceanic Niño Index (the ONI). NOAA Climate image by Fiona Martin.]
The other Niño region indexes were defined when scientists were first studying ENSO. In fact, the Niño3, Niño4, and Niño1+2 indexes were named based on the ship track numbers that once were used to measure sea surface temperatures in the tropical Pacific Ocean.
While we still monitor these regions regularly, Niño3.4 (which is an overlap of the Niño3 and Niño4 regions) was identified by colleagues, led by Tony Barnston (a retired ENSO Blogger!), as the region most representative of ENSO. It’s the main sea surface temperature index U.S. scientists currently use to determine if El Niño or La Niña is present. Other countries use the indexes they find most relevant to their interests—for example, Japan uses Niño3 as the primary sea surface temperature index, while Peru closely monitors Niño1+2, in addition to Niño-3.4.
[Location of the Niño regions for measuring sea surface temperature in the eastern and central tropical Pacific Ocean. The sea surface temperature in the Niño3.4 region, spanning from 120˚W to 170˚W longitude, when averaged over a 3-month period, forms NOAA’s official Oceanic Niño Index (the ONI). NOAA Climate image by Fiona Martin.]
The other Niño region indexes were defined when scientists were first studying ENSO. In fact, the Niño3, Niño4, and Niño1+2 indexes were named based on the ship track numbers that once were used to measure sea surface temperatures in the tropical Pacific Ocean.
While we still monitor these regions regularly, Niño3.4 (which is an overlap of the Niño3 and Niño4 regions) was identified by colleagues, led by Tony Barnston (a retired ENSO Blogger!), as the region most representative of ENSO. It’s the main sea surface temperature index U.S. scientists currently use to determine if El Niño or La Niña is present. Other countries use the indexes they find most relevant to their interests—for example, Japan uses Niño3 as the primary sea surface temperature index, while Peru closely monitors Niño1+2, in addition to Niño-3.4.
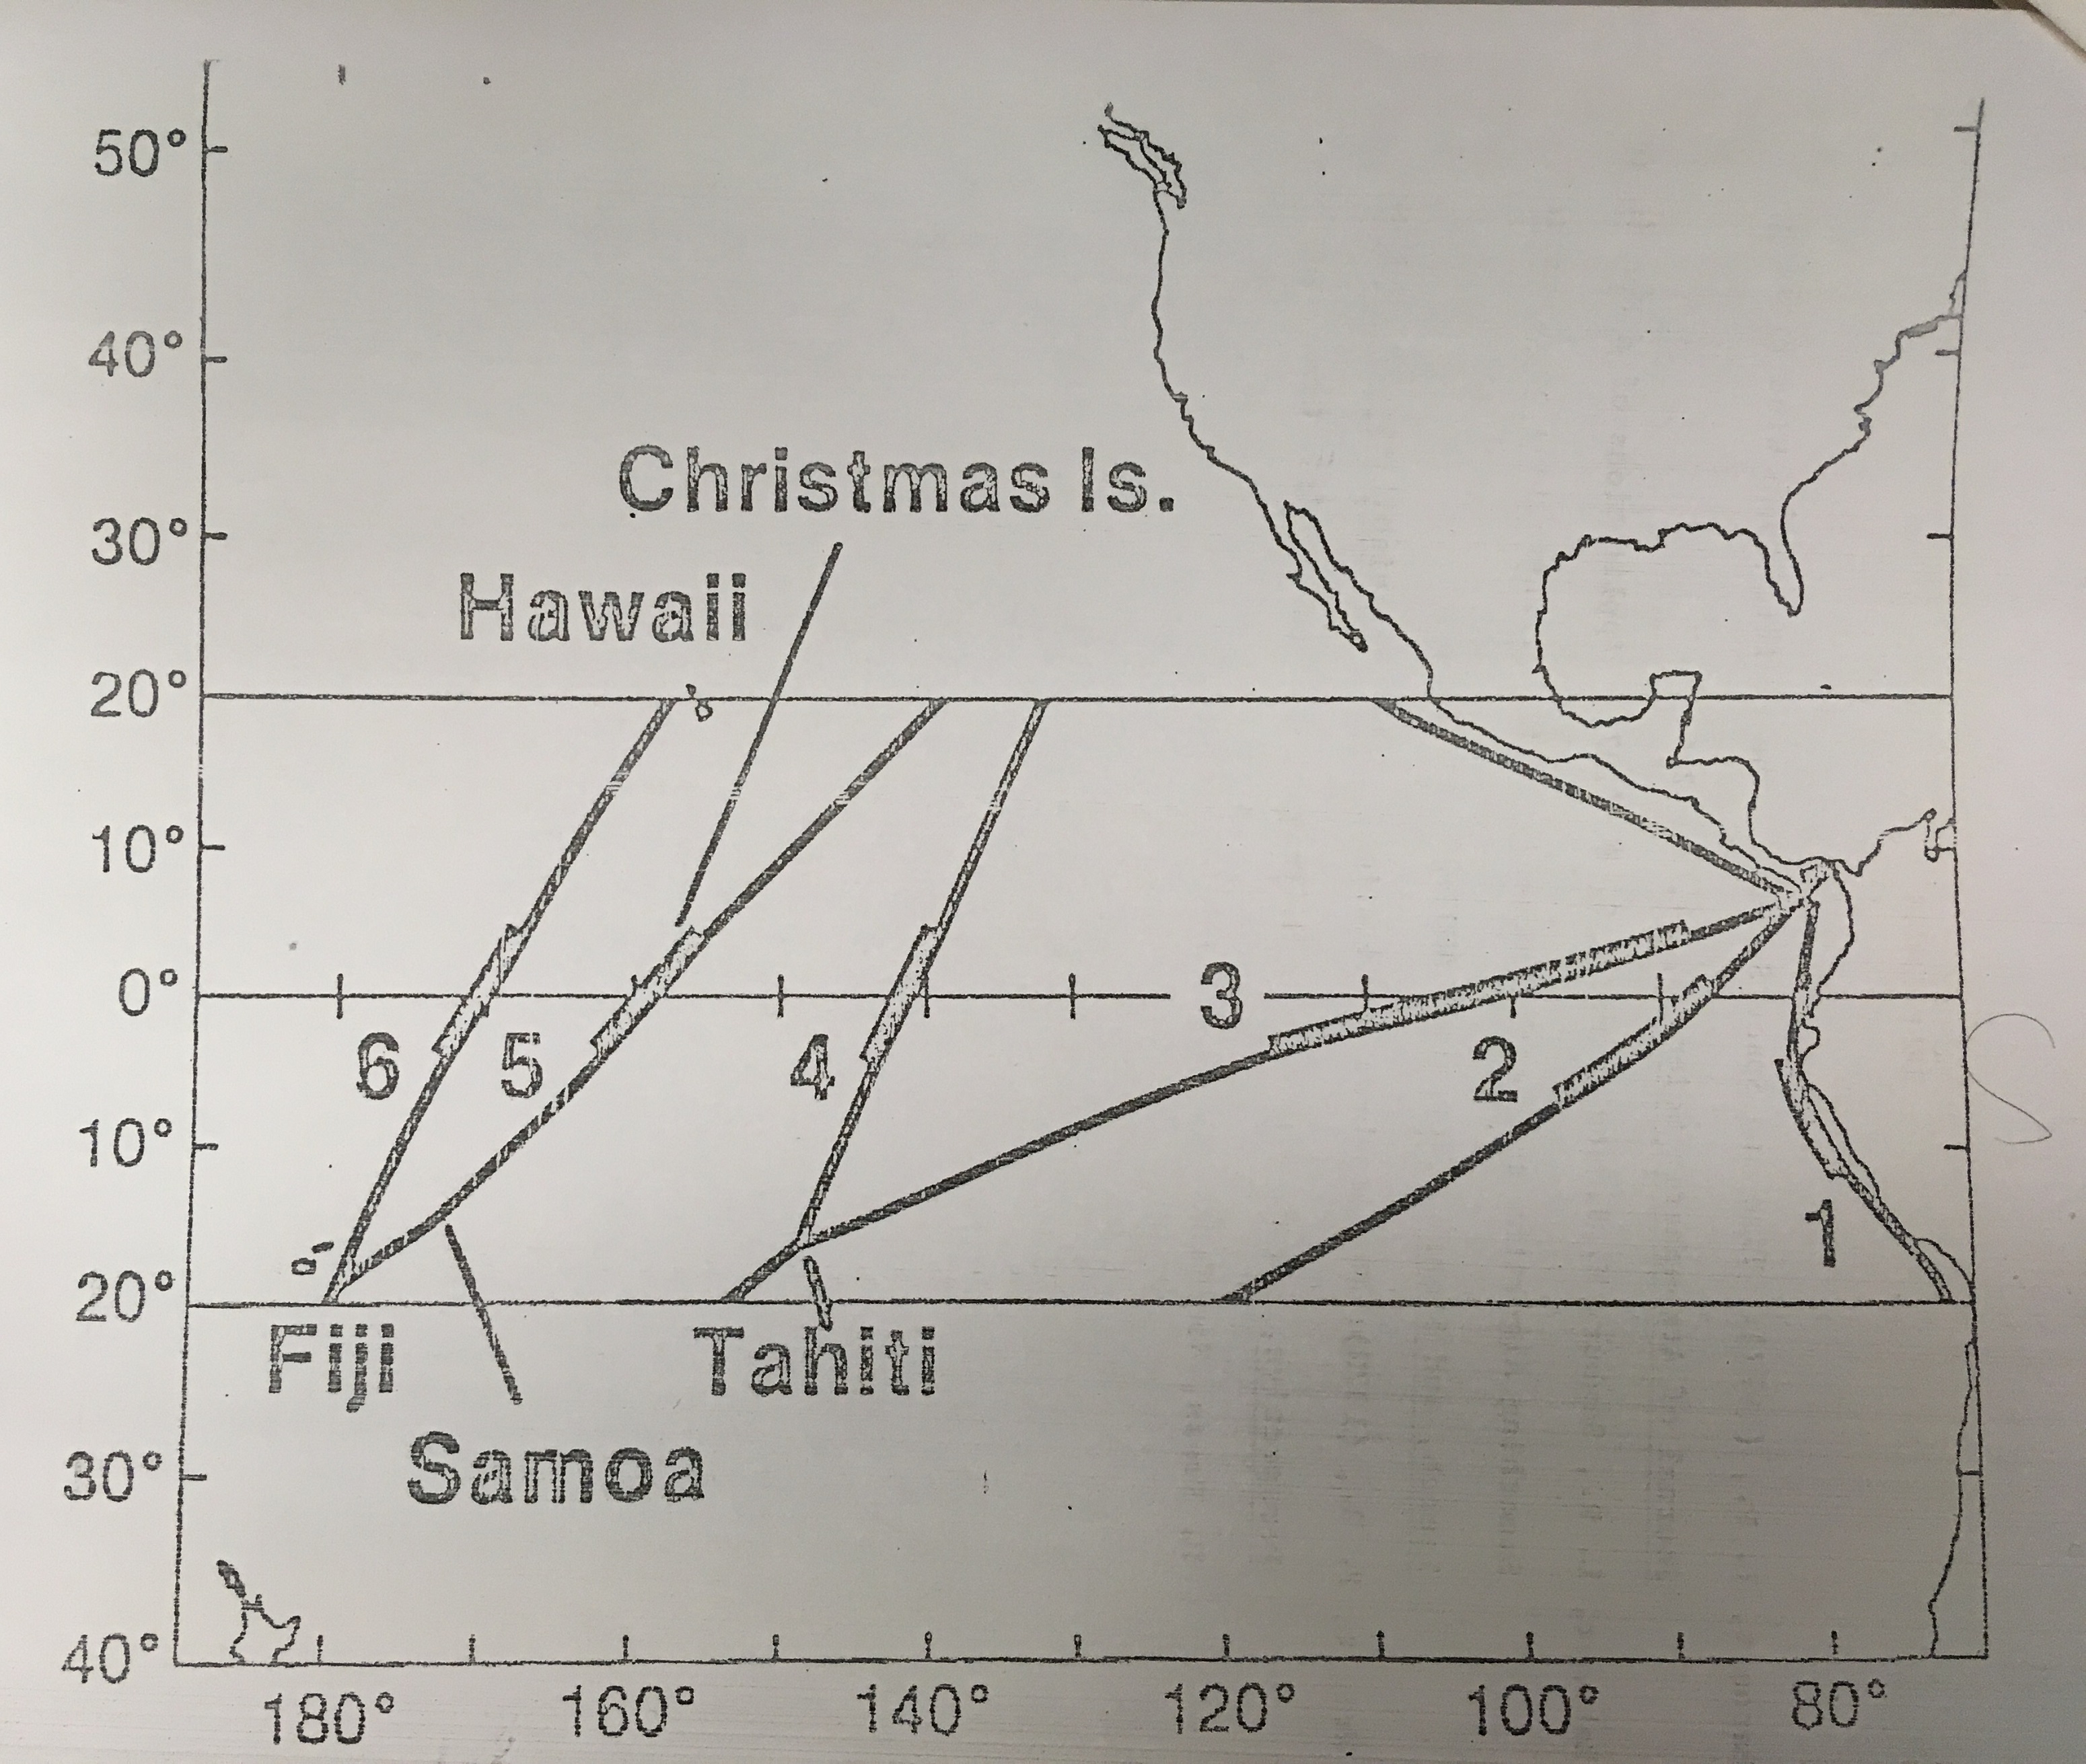 [Six ship tracks used in the study “"Eastern Pacific Sea Surface Temperature Lag Relationships" by Eugene Rasmusson and Thomas Carpenter, circa 1980, from NOAA Climate Prediction Center archives. The wider part of each track indicates the 8-degree latitude strip used in constructing the time series of sea surface temperature departures. These track numbers gave rise to the names used today for the ENSO-monitoring regions.]
 ENSO may be inactive, but we here at the ENSO Blog never are. As we go into what may be a protracted ENSO-neutral period, please let us know what topics you’d like us to explore in the endlessly interesting world of climate & weather science!
Edited for WeatherNation by Meteorologist Mace Michaels
ENSO may be inactive, but we here at the ENSO Blog never are. As we go into what may be a protracted ENSO-neutral period, please let us know what topics you’d like us to explore in the endlessly interesting world of climate & weather science!
Edited for WeatherNation by Meteorologist Mace Michaels
[Animation showing sea surface temperature departure from the long-term average from July through early September 2019. Graphic by NOAA Climate; data from NOAA’s Environmental Visualization Lab.]
The territory between the El Niño threshold and La Niña (0.5°C below the long-term average) is designated ENSO-neutral. (ENSO = El Niño/Southern Oscillation—the whole El Niño/La Niña atmosphere-ocean system). In August, the Niño3.4 index in the east-central tropical Pacific was very close to the long-term average. The Oceanic Niño Index, the 3-month average and our official ENSO measurement, was 0.3°C warmer than average for June–August, marking the first ENSO-neutral season since last year.
Ecru and beige
While ENSO is inactive right now, there are a few other things of note in the recent sea surface temperature map. (If you would like to page through the recent maps yourself, head over to the NOAA View page.) As you’ll notice, some warmer-than-average water remains in the western Pacific, and the Niño4 index was 0.5°C above average in the last weekly measurement. On the other hand, the Niño1+2 index, just off the coast of South America, was -0.6°C below average.
[Location of the Niño regions for measuring sea surface temperature in the eastern and central tropical Pacific Ocean. The sea surface temperature in the Niño3.4 region, spanning from 120˚W to 170˚W longitude, when averaged over a 3-month period, forms NOAA’s official Oceanic Niño Index (the ONI). NOAA Climate image by Fiona Martin.]
The other Niño region indexes were defined when scientists were first studying ENSO. In fact, the Niño3, Niño4, and Niño1+2 indexes were named based on the ship track numbers that once were used to measure sea surface temperatures in the tropical Pacific Ocean.
While we still monitor these regions regularly, Niño3.4 (which is an overlap of the Niño3 and Niño4 regions) was identified by colleagues, led by Tony Barnston (a retired ENSO Blogger!), as the region most representative of ENSO. It’s the main sea surface temperature index U.S. scientists currently use to determine if El Niño or La Niña is present. Other countries use the indexes they find most relevant to their interests—for example, Japan uses Niño3 as the primary sea surface temperature index, while Peru closely monitors Niño1+2, in addition to Niño-3.4.
[Six ship tracks used in the study “"Eastern Pacific Sea Surface Temperature Lag Relationships" by Eugene Rasmusson and Thomas Carpenter, circa 1980, from NOAA Climate Prediction Center archives. The wider part of each track indicates the 8-degree latitude strip used in constructing the time series of sea surface temperature departures. These track numbers gave rise to the names used today for the ENSO-monitoring regions.]
Canola and safflower
I’m not yet done with the interesting things we can find in the current sea surface temperature anomaly map! (Anomaly = departure from long-term average.) Some of the cooler water near the South American coast has been transported from the far eastern Pacific into the east-central Pacific by tropical instability waves, which show up here as a wavy/blobby pattern along the equator. (Also check out the nice animation of them from last month in Nat’s post.) Another important pattern, the Indian Ocean Dipole (IOD), is also illustrated in the recent sea surface temperature anomaly map. The IOD is characterized by the difference in temperature anomalies between the eastern and western Indian Ocean. It has been in a positive phase for the last couple of months, with the western Indian Ocean warmer than average and the eastern region cooler than average, showing up as a large blue area near Indonesia. A negative IOD is the opposite. The IOD can change the atmospheric circulation over the Indian Ocean in much the same way ENSO changes the circulation over the Pacific Ocean (the Walker circulation). The IOD doesn’t have an effect on North American weather and climate, but it’s very important for Australia, and also another great example of a seasonal climate pattern. Check out the Bureau of Meteorology’s resources for more on the IOD. Finally, in the most recent map, covering the week of September 2–8, off the southeast coast of the U.S., you’ll see the cooler water left in the wake of Hurricane Dorian. Hurricanes can temporarily cool the surface of the ocean as much as 6-9°F as strong winds churn the water, mixing cooler water up from deeper layers. Additionally, evaporation of warm water, cold rain falling, and the thick cloud cover contribute to cooling the surface.Switzerland and Ireland
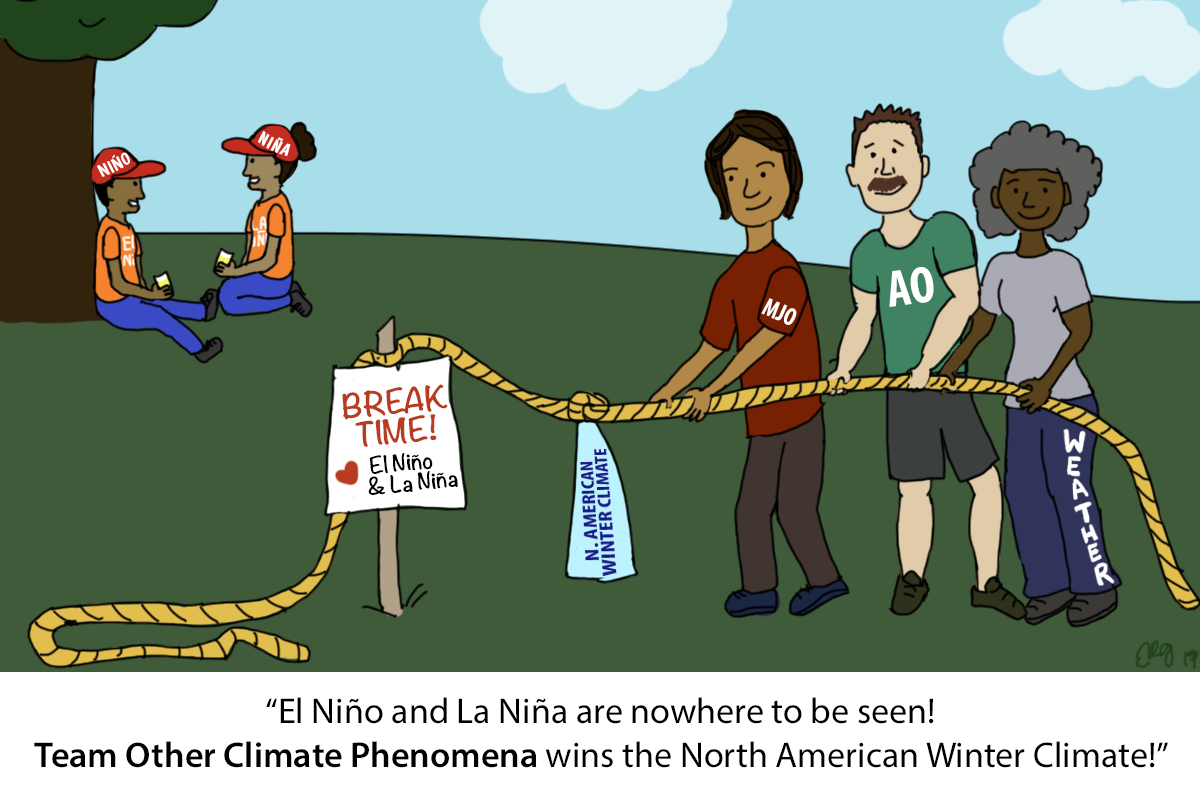
It’s been a while since we’ve had an ENSO-neutral winter. ENSO-neutral does not mean the weather will be average—it just means that other, non-ENSO forces will govern the weather without ENSO’s relatively predictable impact. Some of these other forces include the Arctic Oscillation and the Madden-Julian Oscillation. These patterns change faster than ENSO, and therefore are harder to predict weeks in advance. This gives me the opportunity to re-run this excellent cartoon from a 2017 post:
[Concept by Tom Di Liberto and illustration by Emily Greenhalgh, NOAA Climate]
All Weather News
More
Tropical Storm Bertha Makes Landfall Along Gulf Coast
Wednesday afternoon: Bertha made landfall wit
23 Jul 2026 3:20 AM

Flash Flooding for the Carolinas This Week
Another stalled front in the Carolinas is for
23 Jul 2026 1:20 AM

Another Round of Storms Targets the Northeast
Tuesday brought severe weather again across p
23 Jul 2026 1:15 AM

Pacific Northwest Fires Bringing Down the Air Quality
Conditions have been really dry out west. We'
23 Jul 2026 1:00 AM

Another Round of Severe Weather for the Upper Midwest and Great Lakes
The upper-level low train continues to keep t
21 Jul 2026 1:45 AM

Air Quality Improvements in the Forecast
Wildfires burning in Northwestern Ontario, Ca
20 Jul 2026 7:20 PM

Monsoon Moisture Brings Weekend Flood Threat
The monsoon has returned to the southwestern
19 Jul 2026 1:30 AM