September La Nina Update: Feeling Groovy
Special Stories
15 Sep 2021 1:00 AM
[From NOAA Climate written by Emily Becker] It’s likely that the tropical Pacific is on the verge of getting into the La Niña groove, and forecasters estimate a 70-80% chance of La Niña this winter. NOAA’s forecast discussion says “the ocean-atmosphere system reflected ENSO-neutral [in August], but is edging toward La Niña.” Let’s dig into that!
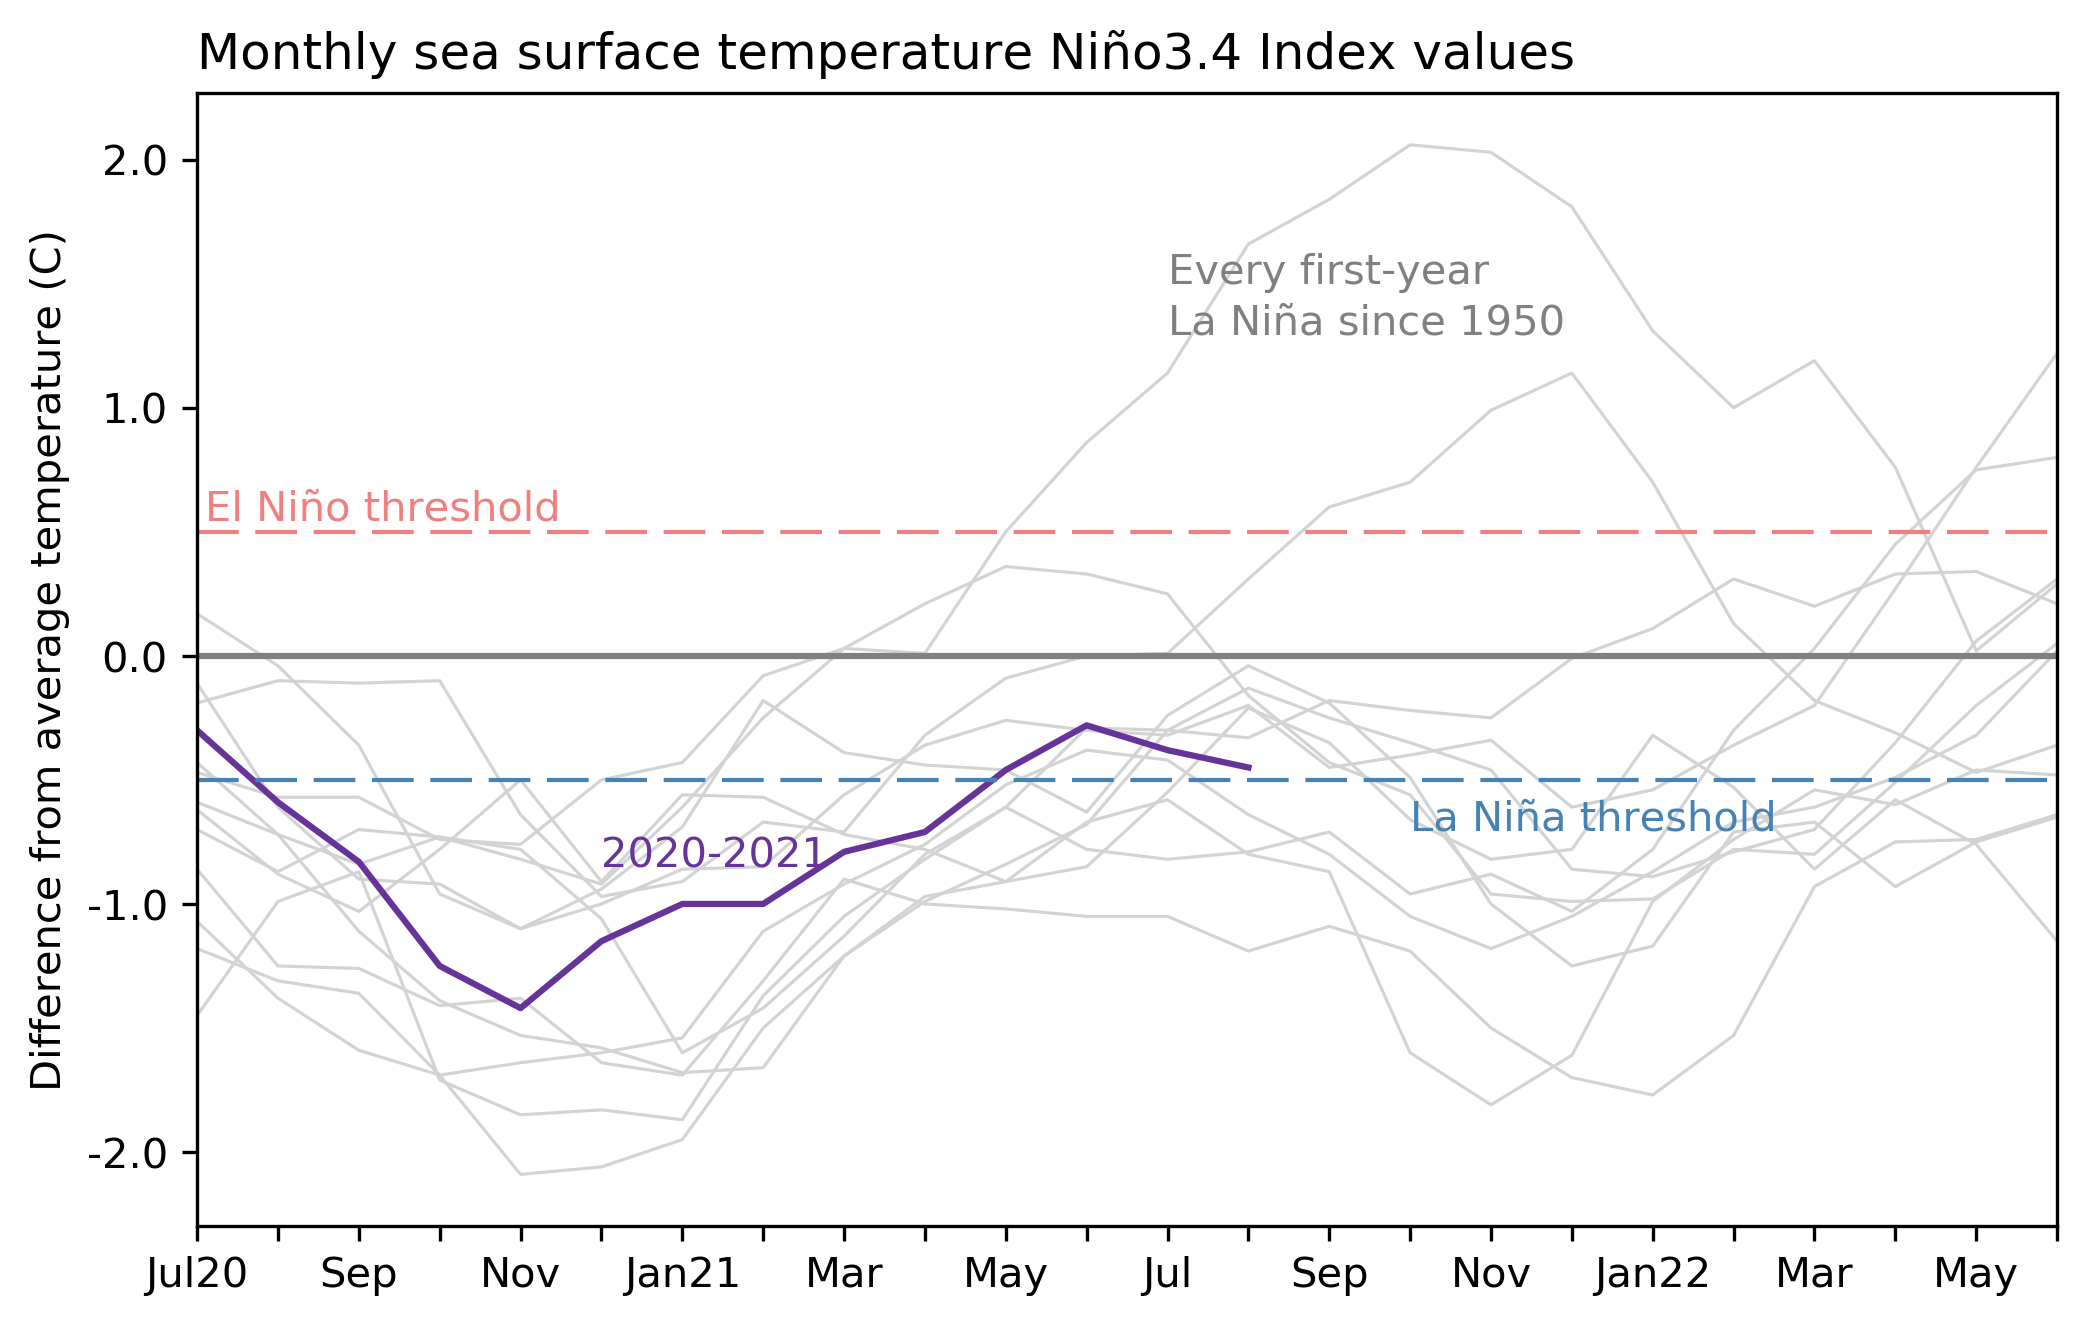 [Monthly sea surface temperature anomalies (difference from average) in the Niño 3.4 region of the tropical Pacific for 2020-21 (purple line) and all other years starting from first-year La Niña winters since 1950. NOAA Climate graph based on ERSSTv5 temperature data.]
The first step on our “Is it La Niña?” flowchart is a one-month average sea surface temperature anomaly in the Niño-3.4 region that is 0.5° C below the long-term average. A couple of definitions: here long-term means 1991–2020, and I’ll use anomaly to describe the difference from the long-term temperature average. The La Niña threshold is an anomaly of -0.5° C.
[Monthly sea surface temperature anomalies (difference from average) in the Niño 3.4 region of the tropical Pacific for 2020-21 (purple line) and all other years starting from first-year La Niña winters since 1950. NOAA Climate graph based on ERSSTv5 temperature data.]
The first step on our “Is it La Niña?” flowchart is a one-month average sea surface temperature anomaly in the Niño-3.4 region that is 0.5° C below the long-term average. A couple of definitions: here long-term means 1991–2020, and I’ll use anomaly to describe the difference from the long-term temperature average. The La Niña threshold is an anomaly of -0.5° C.
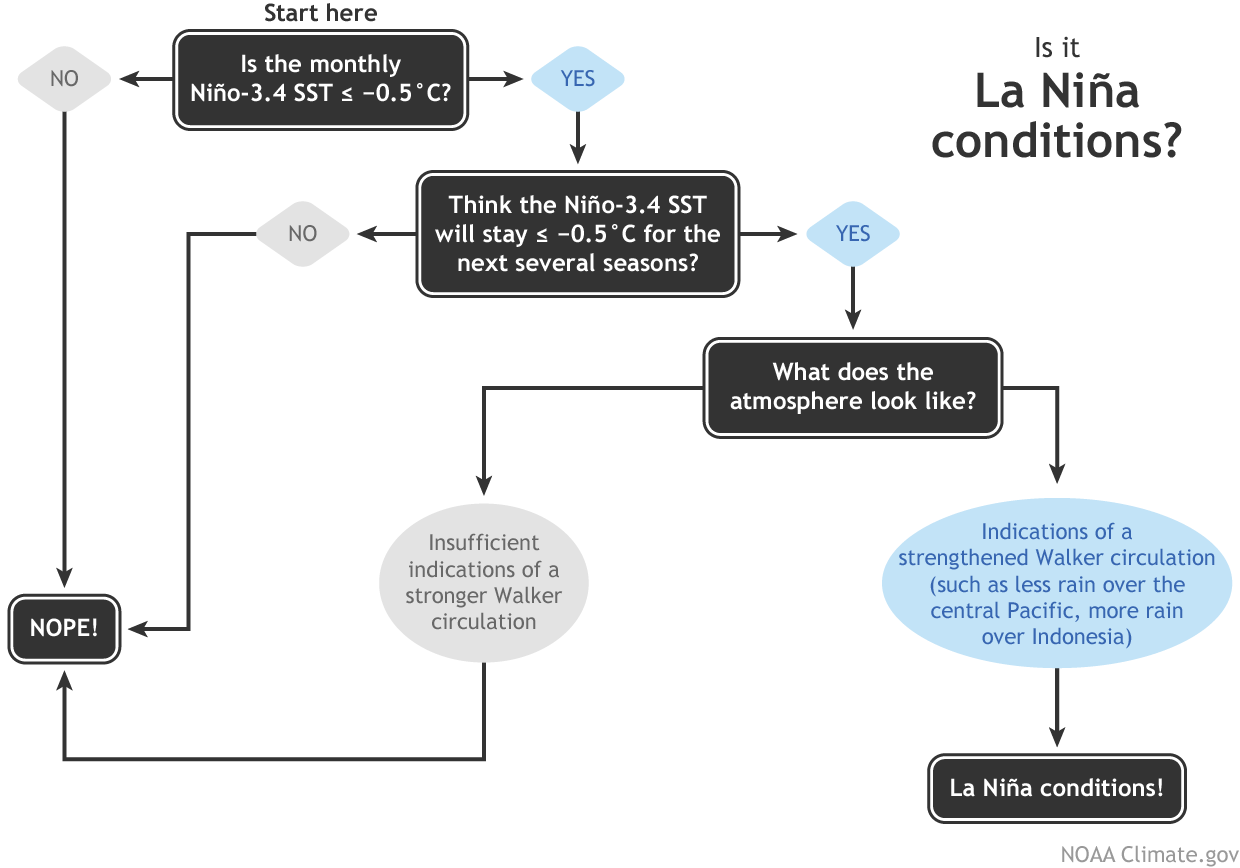 [Flowchart showing decision process for determining La Niña conditions. Figure by Fiona Martin, adapted by NOAA Climate.]
The decision tree doesn’t specify which ocean temperature dataset, and some months—like this one—the various datasets will have different values. While ERSSTv5 says the August anomaly was -0.45° C, which rounds to -0.5° C (at the La Niña threshold), the OISST says the August anomaly was -0.44° C, which rounds to -0.4° C! And there are additional SST datasets too! So have we checked off the first box of the flowchart, or not? Such is the dilemma of the ENSO forecaster.
Fortunately, we don’t have to make decisions based solely on one month of the Niño-3.4 Index. (And yes, of course there’s the atmosphere, but I’ll get to that in a minute.) We also have weekly monitoring of the sea surface temperature. While we definitely do not make decisions based solely on the weekly value, it can provide a clue about the next step on the flowchart—do we expect that monthly anomaly to stay more than 0.5° C below average for the next several seasons? A season here is any three-month period, e.g., September–November.
ENSO is a seasonal pattern, meaning the sea surface temperature anomaly needs to stay in La Niña territory for an extended period, indicating that the ENSO feedback between the ocean and the atmosphere is present. The weekly Niño-3.4 index as of September 1st was about -0.3°C. This suggests that, while we are close to La Niña, we’re still seeing enough wobble in sea surface temperatures that we can’t be sure that La Niña conditions have locked in.
[Flowchart showing decision process for determining La Niña conditions. Figure by Fiona Martin, adapted by NOAA Climate.]
The decision tree doesn’t specify which ocean temperature dataset, and some months—like this one—the various datasets will have different values. While ERSSTv5 says the August anomaly was -0.45° C, which rounds to -0.5° C (at the La Niña threshold), the OISST says the August anomaly was -0.44° C, which rounds to -0.4° C! And there are additional SST datasets too! So have we checked off the first box of the flowchart, or not? Such is the dilemma of the ENSO forecaster.
Fortunately, we don’t have to make decisions based solely on one month of the Niño-3.4 Index. (And yes, of course there’s the atmosphere, but I’ll get to that in a minute.) We also have weekly monitoring of the sea surface temperature. While we definitely do not make decisions based solely on the weekly value, it can provide a clue about the next step on the flowchart—do we expect that monthly anomaly to stay more than 0.5° C below average for the next several seasons? A season here is any three-month period, e.g., September–November.
ENSO is a seasonal pattern, meaning the sea surface temperature anomaly needs to stay in La Niña territory for an extended period, indicating that the ENSO feedback between the ocean and the atmosphere is present. The weekly Niño-3.4 index as of September 1st was about -0.3°C. This suggests that, while we are close to La Niña, we’re still seeing enough wobble in sea surface temperatures that we can’t be sure that La Niña conditions have locked in.
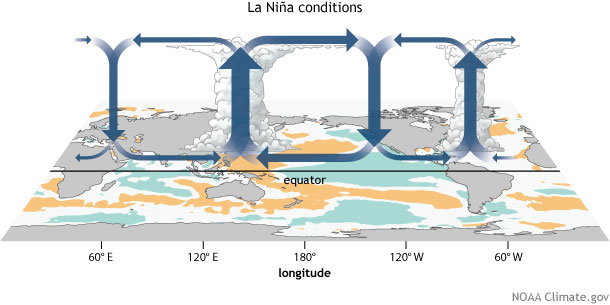 [Generalized Walker Circulation (December-February) anomaly during La Niña events, overlaid on map of average sea surface temperature anomalies. Anomalous ocean cooling (blue-green) in the central and eastern Pacific Ocean and warming over the western Pacific Ocean enhance the rising branch of the Walker circulation over the Maritime Continent and the sinking branch over the eastern Pacific Ocean. Enhanced rising motion is also observed over northern South America, while anomalous sinking motion is found over eastern Africa. NOAA Climate drawing by Fiona Martin.]
In August, there were some indications that the Walker circulation was strengthening, including regions of stronger-than-average winds, both low-level and upper-level, over the western tropical Pacific, more clouds and rain than average over Indonesia, and drier conditions near the Date Line. This supports the forecasters’ consensus that the tropical Pacific is edging towards La Niña.
[Generalized Walker Circulation (December-February) anomaly during La Niña events, overlaid on map of average sea surface temperature anomalies. Anomalous ocean cooling (blue-green) in the central and eastern Pacific Ocean and warming over the western Pacific Ocean enhance the rising branch of the Walker circulation over the Maritime Continent and the sinking branch over the eastern Pacific Ocean. Enhanced rising motion is also observed over northern South America, while anomalous sinking motion is found over eastern Africa. NOAA Climate drawing by Fiona Martin.]
In August, there were some indications that the Walker circulation was strengthening, including regions of stronger-than-average winds, both low-level and upper-level, over the western tropical Pacific, more clouds and rain than average over Indonesia, and drier conditions near the Date Line. This supports the forecasters’ consensus that the tropical Pacific is edging towards La Niña.
The age of Aquarius
First things first: a reminder of why we’re here every month, rain or shine, talking about ENSO (El Niño-Southern Oscillation, the entire El Niño/La Niña system of the tropical Pacific). We do it because when it comes to the global climate, the tropical Pacific has all the influence of Jimi Hendrix playing guitar in the middle of a concert crowd. Sure, those closest by are experiencing the main effects, but the flow of people all around the field gets shifted, too, as people move toward or away from the performance—depending on their individual feelings about electric guitar. ENSO does the same to the global climate. So, let’s tune in to the sea surface temperatures in the Niño-3.4 region, our primary monitoring index for ENSO.
[Monthly sea surface temperature anomalies (difference from average) in the Niño 3.4 region of the tropical Pacific for 2020-21 (purple line) and all other years starting from first-year La Niña winters since 1950. NOAA Climate graph based on ERSSTv5 temperature data.]
The first step on our “Is it La Niña?” flowchart is a one-month average sea surface temperature anomaly in the Niño-3.4 region that is 0.5° C below the long-term average. A couple of definitions: here long-term means 1991–2020, and I’ll use anomaly to describe the difference from the long-term temperature average. The La Niña threshold is an anomaly of -0.5° C.
[Flowchart showing decision process for determining La Niña conditions. Figure by Fiona Martin, adapted by NOAA Climate.]
The decision tree doesn’t specify which ocean temperature dataset, and some months—like this one—the various datasets will have different values. While ERSSTv5 says the August anomaly was -0.45° C, which rounds to -0.5° C (at the La Niña threshold), the OISST says the August anomaly was -0.44° C, which rounds to -0.4° C! And there are additional SST datasets too! So have we checked off the first box of the flowchart, or not? Such is the dilemma of the ENSO forecaster.
Fortunately, we don’t have to make decisions based solely on one month of the Niño-3.4 Index. (And yes, of course there’s the atmosphere, but I’ll get to that in a minute.) We also have weekly monitoring of the sea surface temperature. While we definitely do not make decisions based solely on the weekly value, it can provide a clue about the next step on the flowchart—do we expect that monthly anomaly to stay more than 0.5° C below average for the next several seasons? A season here is any three-month period, e.g., September–November.
ENSO is a seasonal pattern, meaning the sea surface temperature anomaly needs to stay in La Niña territory for an extended period, indicating that the ENSO feedback between the ocean and the atmosphere is present. The weekly Niño-3.4 index as of September 1st was about -0.3°C. This suggests that, while we are close to La Niña, we’re still seeing enough wobble in sea surface temperatures that we can’t be sure that La Niña conditions have locked in.
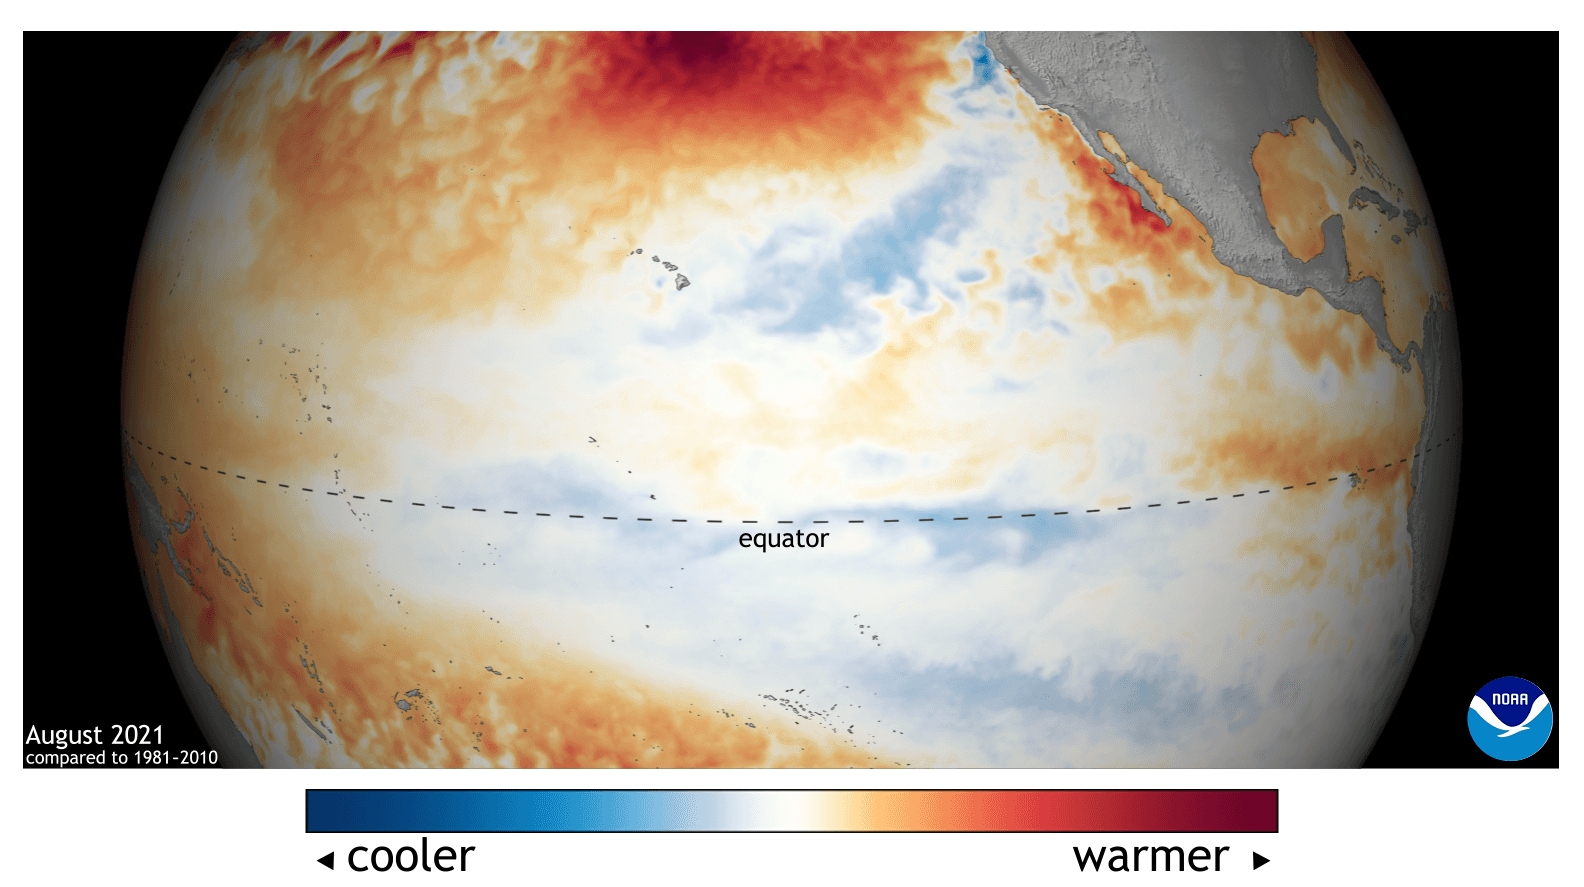
[Animation showing sea surface temperature departure from the long-term average from mid-July 2021 to early September. Graphic by NOAA Climate; data from NOAA’s Environmental Visualization Lab. Description of historical baseline period here.]
Good vibes
Speaking of the atmospheric response, let’s take a look at what’s happening above the tropical Pacific. The La Niña atmospheric pattern is a stronger Walker circulation. The Walker circulation is driven by the difference between warm ocean surface in the far western Pacific and Indonesia, which causes warm rising air and storm. When this air gets high up in the atmosphere, it travels eastward across the Pacific (and westward across the Indian Ocean, but that’s not our focus right now). This current of air descends over the cooler water of the central/eastern Pacific and travels back westward near the surface, completing the circulation. La Niña, with its cooler-than-average central/eastern Pacific surface temperature, amps up the Walker circulation.
[Generalized Walker Circulation (December-February) anomaly during La Niña events, overlaid on map of average sea surface temperature anomalies. Anomalous ocean cooling (blue-green) in the central and eastern Pacific Ocean and warming over the western Pacific Ocean enhance the rising branch of the Walker circulation over the Maritime Continent and the sinking branch over the eastern Pacific Ocean. Enhanced rising motion is also observed over northern South America, while anomalous sinking motion is found over eastern Africa. NOAA Climate drawing by Fiona Martin.]
In August, there were some indications that the Walker circulation was strengthening, including regions of stronger-than-average winds, both low-level and upper-level, over the western tropical Pacific, more clouds and rain than average over Indonesia, and drier conditions near the Date Line. This supports the forecasters’ consensus that the tropical Pacific is edging towards La Niña.
Far out
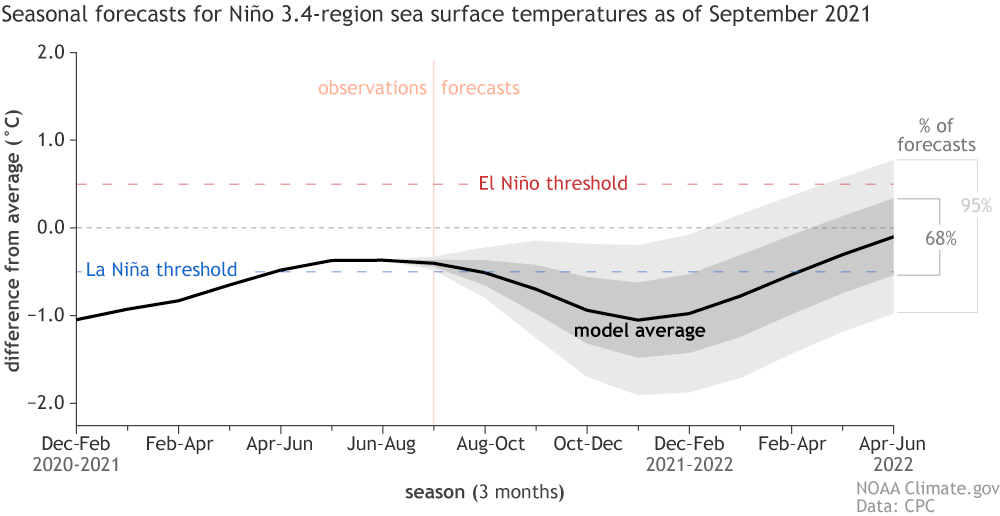
Because we are so close to La Niña right now, it’s looking more probable that La Niña will lock in by this winter. Besides the historical tendency for second-year La Niñas, many climate models are predicting La Niña conditions to develop shortly, though they somewhat differ on whether an event will begin this coming month or in October.[Climate model forecasts for the Niño3.4 Index. Dynamical model data (black line) from the North American Multi-Model Ensemble (NMME): darker gray envelope shows the range of 68% of all model forecasts; lighter gray shows the range of 95% of all model forecasts. NOAA Climate image from University of Miami data.]
As far as strength goes, the most likely scenario is a weak La Niña, with the peak Niño-3.4 anomaly between -0.5° C and -0.9° C, though there is a roughly 1 in 3 chance it will be stronger. Along with the climate model predictions, most of which are around this range, physical indicators of a strong La Niña (peak Niño-3.4 Index cooler than -1.5° C) like a very large amount of cooler-than-average water under the surface of the tropical Pacific, are lacking, so there’s a less than 10% chance of that happening.
Hang loose
La Niña tends to strengthen the Atlantic hurricane season and diminish the eastern Pacific hurricane season, both of which impacts have been very much in evidence so far this year. And, of course, La Niña affects U.S. winter weather, although a weaker La Niña means it may not dominate the winter. We’ll have to wait and see what the forecasters at NOAA’s Climate Prediction Center think when they issue their winter weather outlook next month.All Weather News
More
Severe Storms Target the Midwest to the Northeast
UPPER MIDWEST - Dangerous tornadoes have alre
28 Jul 2026 1:45 AM

Tropics: Fausto Heads towards Hawaii; Genevieve Cat 4 Hurricane
PacificHurricane Fausto continues to track we
28 Jul 2026 1:45 AM


Southeast Flood Risk Lingers Near Stalled Front
A stalled boundary over the Southeast will ke
25 Jul 2026 10:55 AM

Another Round of Storms Targets the Northeast
Tuesday brought severe weather again across p
23 Jul 2026 1:15 AM

Another Round of Severe Weather for the Upper Midwest and Great Lakes
The upper-level low train continues to keep t
21 Jul 2026 1:45 AM