The Great Appalachian Storm of 1950 in Historical Context

Special Stories
2 Dec 2020 2:00 AM
[Photo credit from Cleveland News, Richard J. Misch via NOAA]
[Written by NOAA] A slow-moving, powerful storm system dumped heavy snow across much of the central Appalachians from November 22 to 30, 1950. Known as “The Great Appalachian Storm of 1950,” the system blanketed areas from western Pennsylvania southward deep into West Virginia with over 30 inches of snow. Several locations received more than 50 inches of snow, and Coburn Creek, West Virginia, reported the greatest snowfall total—a staggering 62 inches.
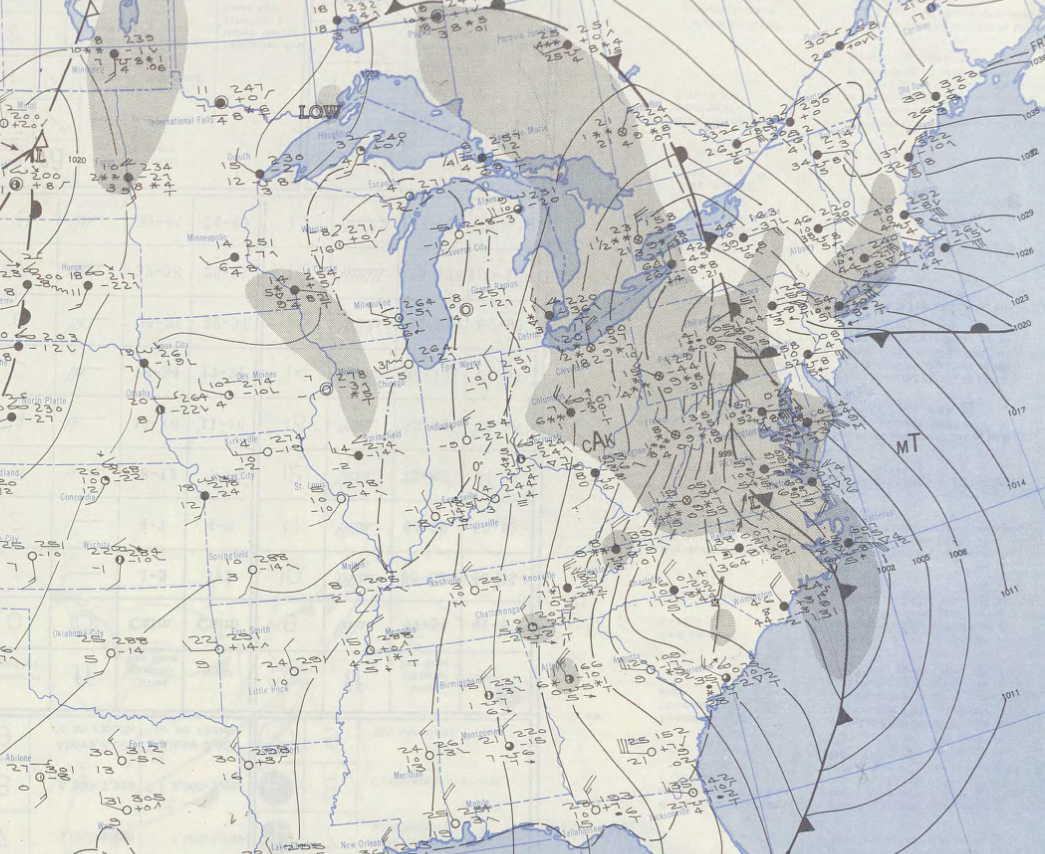 [Surface weather map from November 25, 1950. From NOAA]
After the storm, the eastern half of the country saw above-normal temperatures during the first week of December. This led to a fast snowmelt, which flooded several tributaries and major rivers. In Pittsburgh the Ohio River reached 28.5 feet, 4 feet above flood stage. In Cincinnati it reached 56 feet, 4 feet above flood stage.
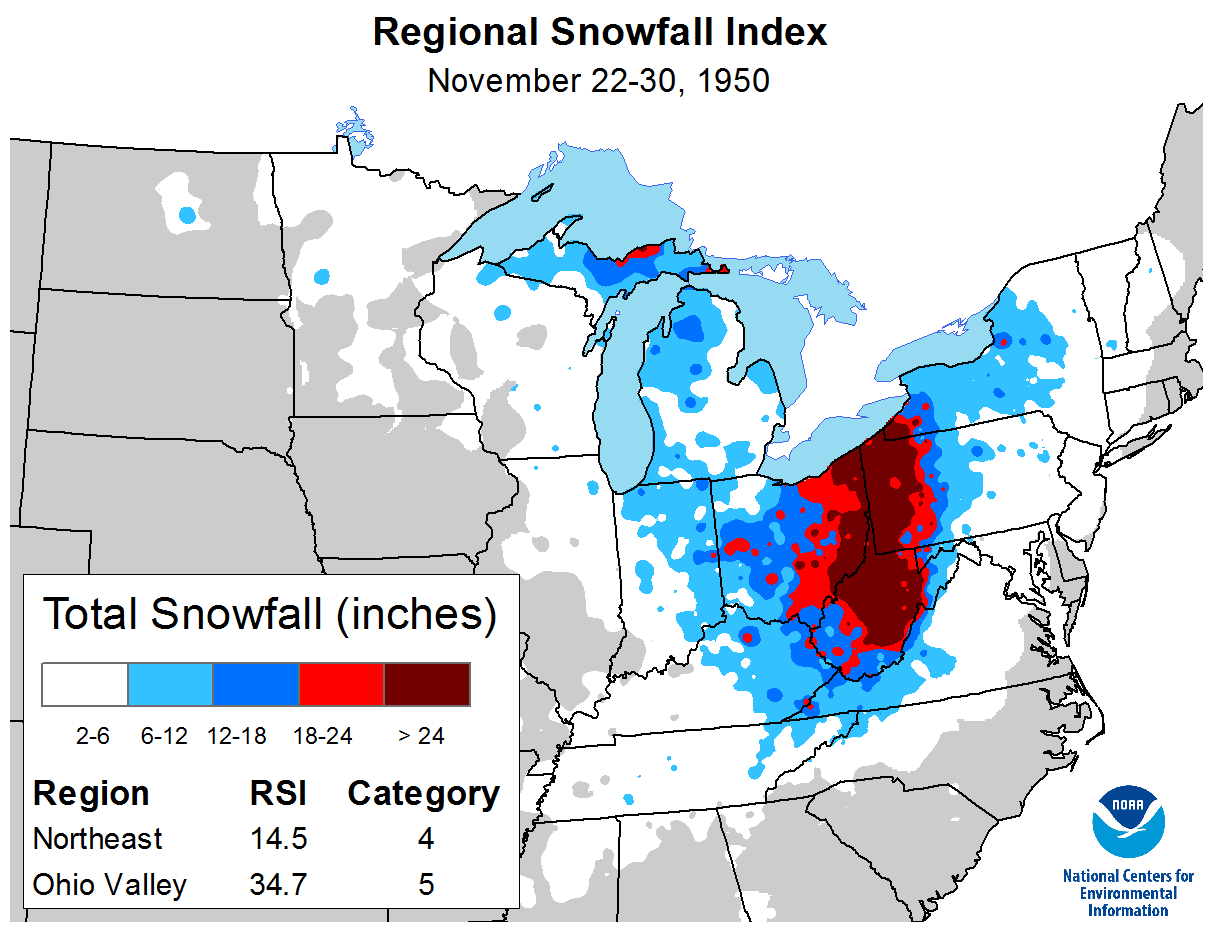
At the time, the Great Appalachian Storm of 1950 was one of the costliest storms on record, and it contributed to at least 160 deaths. Overall, on NCEI’s Regional Snowfall Index, 0r RSI,this powerful storm ranked as a Category 5—the worst category—for the Ohio Valley and a Category 4 for the Northeast.
[Surface weather map from November 25, 1950. From NOAA]
After the storm, the eastern half of the country saw above-normal temperatures during the first week of December. This led to a fast snowmelt, which flooded several tributaries and major rivers. In Pittsburgh the Ohio River reached 28.5 feet, 4 feet above flood stage. In Cincinnati it reached 56 feet, 4 feet above flood stage.
At the time, the Great Appalachian Storm of 1950 was one of the costliest storms on record, and it contributed to at least 160 deaths. Overall, on NCEI’s Regional Snowfall Index, 0r RSI,this powerful storm ranked as a Category 5—the worst category—for the Ohio Valley and a Category 4 for the Northeast.
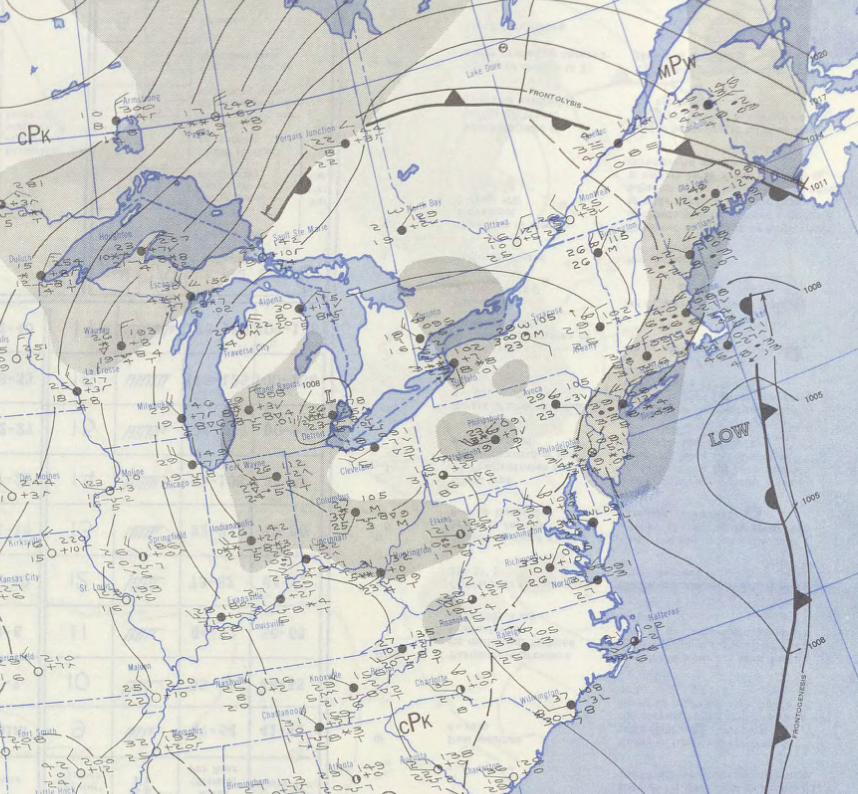 [Surface weather map from November 28, 1950. From NOAA]
The late February snowstorm of 1969 remains the strongest storm to hit the Northeast, with an RSI value of 34.0, making it a Category 5 or “Extreme” event. The March 1993 “Storm of the Century” remains the second-strongest snowstorm to hit the Northeast, with an RSI value of 22.1, making it a Category 5 event.
[Surface weather map from November 28, 1950. From NOAA]
The late February snowstorm of 1969 remains the strongest storm to hit the Northeast, with an RSI value of 34.0, making it a Category 5 or “Extreme” event. The March 1993 “Storm of the Century” remains the second-strongest snowstorm to hit the Northeast, with an RSI value of 22.1, making it a Category 5 event.
 Because NCEI scientists produce separate indices for six climate regions in the eastern two-thirds of the United States, they can account for both regional variations in snowfall patterns and how the amount of snow disrupts areas of the country differently. For example, 10 inches of snow would have much less of an impact in the Northeast than it would in the Southeast. Such factors are reflected in the RSI values and rankings for each storm.
NCEI scientists have calculated RSI values for more than 625 snowstorms dating as far back as 1900, and they add new storms each year as they occur. The RSI not only helps local officials better understand the impacts of each major snowstorm, but it also provides a historical perspective that allows them to better prepare for future storms.
Because NCEI scientists produce separate indices for six climate regions in the eastern two-thirds of the United States, they can account for both regional variations in snowfall patterns and how the amount of snow disrupts areas of the country differently. For example, 10 inches of snow would have much less of an impact in the Northeast than it would in the Southeast. Such factors are reflected in the RSI values and rankings for each storm.
NCEI scientists have calculated RSI values for more than 625 snowstorms dating as far back as 1900, and they add new storms each year as they occur. The RSI not only helps local officials better understand the impacts of each major snowstorm, but it also provides a historical perspective that allows them to better prepare for future storms.
Frigid Cold, Fierce Winds, and Far-Reaching Floods
Frigid cold also stretched from the Northeast into the Ohio Valley and all the way down into the far Southeast. Temperatures fell to 22°F in Pensacola, Florida, 5°F in Birmingham, Alabama, 3°F in Atlanta, Georgia, and 1°F in Asheville, North Carolina. And this record cold led to widespread crop damage, particularly in Georgia and South Carolina. Farther north, intense winds associated with the storm caused extensive tree damage, power outages, and coastal flooding in New England. In New Hampshire, Mount Washington observed gusts as high as 160 mph. And onshore winds along the coast caused extreme high tides and flooding in New Jersey and Connecticut.
[Surface weather map from November 25, 1950. From NOAA]
After the storm, the eastern half of the country saw above-normal temperatures during the first week of December. This led to a fast snowmelt, which flooded several tributaries and major rivers. In Pittsburgh the Ohio River reached 28.5 feet, 4 feet above flood stage. In Cincinnati it reached 56 feet, 4 feet above flood stage.
At the time, the Great Appalachian Storm of 1950 was one of the costliest storms on record, and it contributed to at least 160 deaths. Overall, on NCEI’s Regional Snowfall Index, 0r RSI,this powerful storm ranked as a Category 5—the worst category—for the Ohio Valley and a Category 4 for the Northeast.
Comparing this Storm to Others in the Ohio Valley
The Great Appalachian Storm snowstorm currently ranks as the worst of the 217 Ohio Valley storms NCEI scientists have analyzed. The RSI value of 34.7 securely cements its first-place rank above the second-worst storm, which happened in March 1993 and has an RSI value of 24.6. Only four Category 5 storms have impacted the Ohio Valley since 1900. During the storm, Pittsburgh, Pennsylvania, received 30.2 inches of snow, and both Erie, Pennsylvania, and Youngstown, Ohio, received more than 28 inches. Across the region, more than 6.1 million people lived in areas that received at least 18 inches of snow. Such high snowfall totals affecting so many people largely contributed to the storm’s high ranking on the RSI scale.Comparing this Storm to Others in the Northeast
In the Northeast, the Great Appalachian Storm ranks as the ninth-worst storm among the 211 analyzed. Over 30 inches of snow affecting 1.3 million people in the region largely contributed to the storm’s RSI value of 14.5. With that value, it ranks just behind the more recent February 2003, February 2010, and January 2016 storms.\
[Surface weather map from November 28, 1950. From NOAA]
The late February snowstorm of 1969 remains the strongest storm to hit the Northeast, with an RSI value of 34.0, making it a Category 5 or “Extreme” event. The March 1993 “Storm of the Century” remains the second-strongest snowstorm to hit the Northeast, with an RSI value of 22.1, making it a Category 5 event.
The Science Behind the Regional Snowfall Index
To calculate these RSI values, NCEI scientists use a formula that takes into account the snowfall amount within the region’s borders, the spatial extent of the storm, and the relationship of these elements to the area’s population. Then they categorize the snowstorm’s impacts on a scale from 1 to 5, similar to the Enhanced Fujita scale for tornadoes or the Saffir–Simpson scale for hurricanes.
Because NCEI scientists produce separate indices for six climate regions in the eastern two-thirds of the United States, they can account for both regional variations in snowfall patterns and how the amount of snow disrupts areas of the country differently. For example, 10 inches of snow would have much less of an impact in the Northeast than it would in the Southeast. Such factors are reflected in the RSI values and rankings for each storm.
NCEI scientists have calculated RSI values for more than 625 snowstorms dating as far back as 1900, and they add new storms each year as they occur. The RSI not only helps local officials better understand the impacts of each major snowstorm, but it also provides a historical perspective that allows them to better prepare for future storms.All Weather News
More
Wildfire Outbreak in the Pacific Northwest
SPOKANE, WA - On Saturday, August 1st, the Ol
3 Aug 2026 1:55 AM

More Storms for the East Through Monday
A low-pressure system that moved through the
3 Aug 2026 1:50 AM


After Reaching Category 5, Genevieve Weakens in the Pacific
PacificGenevieve formed last Friday south of
3 Aug 2026 12:30 AM

Flooding, Severe Storms Target the Midwest Again
After an active week of storms across the nor
1 Aug 2026 1:40 AM

Flooding Risk Increases as Heavy Rain Targets the Tri-State Area
Tuesday, heavy rainfall moved across the Nort
30 Jul 2026 12:25 AM

Severe Weather: Energy From the Midwest Now in the Southeast
UPPER MIDWEST - Through Monday, dangerous tor
29 Jul 2026 10:30 PM