Where Did the Water Go? New Study Tracks Hurricane Harvey Stormwater
Special Stories
24 Sep 2018 8:36 AM
[NASA] Hurricane Harvey dumped more than 5 feet (1.5 meters) of water on southeast Texas in late August 2017, making it the wettest recorded hurricane in U.S. history. But after the storm passed, where did all that water go?
In a new, NASA-led study, scientists used Global Positioning System (GPS) data to answer that question and to track not just where Harvey's stormwater ended up on land, but also how long it took to dissipate. The study, titled "Tracking the Weight of Hurricane Harvey's Stormwater Using GPS Data," was recently published by the journal Science Advances.
"We determined that in the first eight days post-landfall, 30 percent of Harvey's stormwater was captured or stored on land -- most as standing water that sits on the surface. Around 60 percent was lost or drained into the ocean and Galveston Bay over the first few days after the storm, and the remaining 10 percent was lost via evapotranspiration, or a combination of evaporation and plant transpiration," said first author Chris Milliner of NASA's Jet Propulsion Laboratory in Pasadena, California.
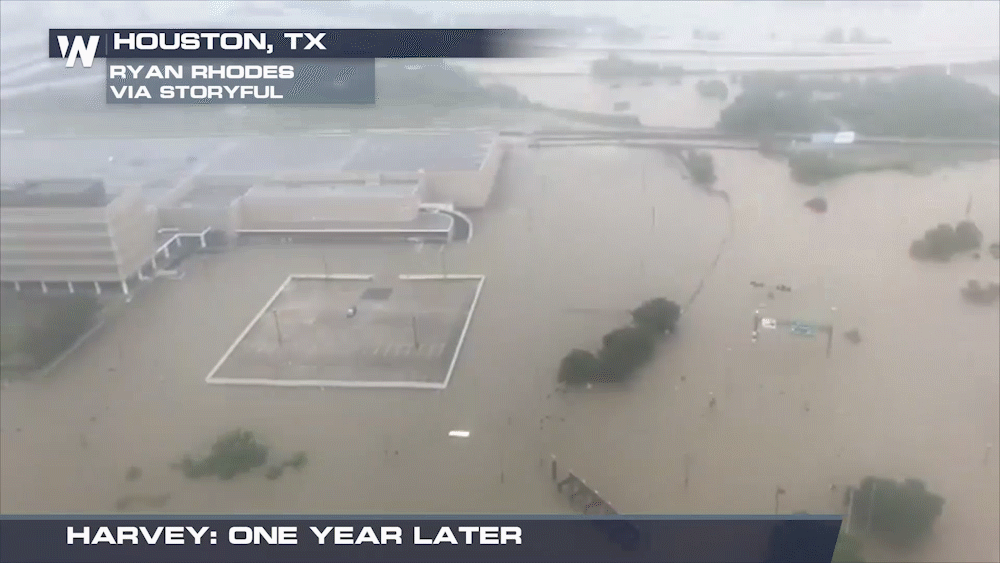
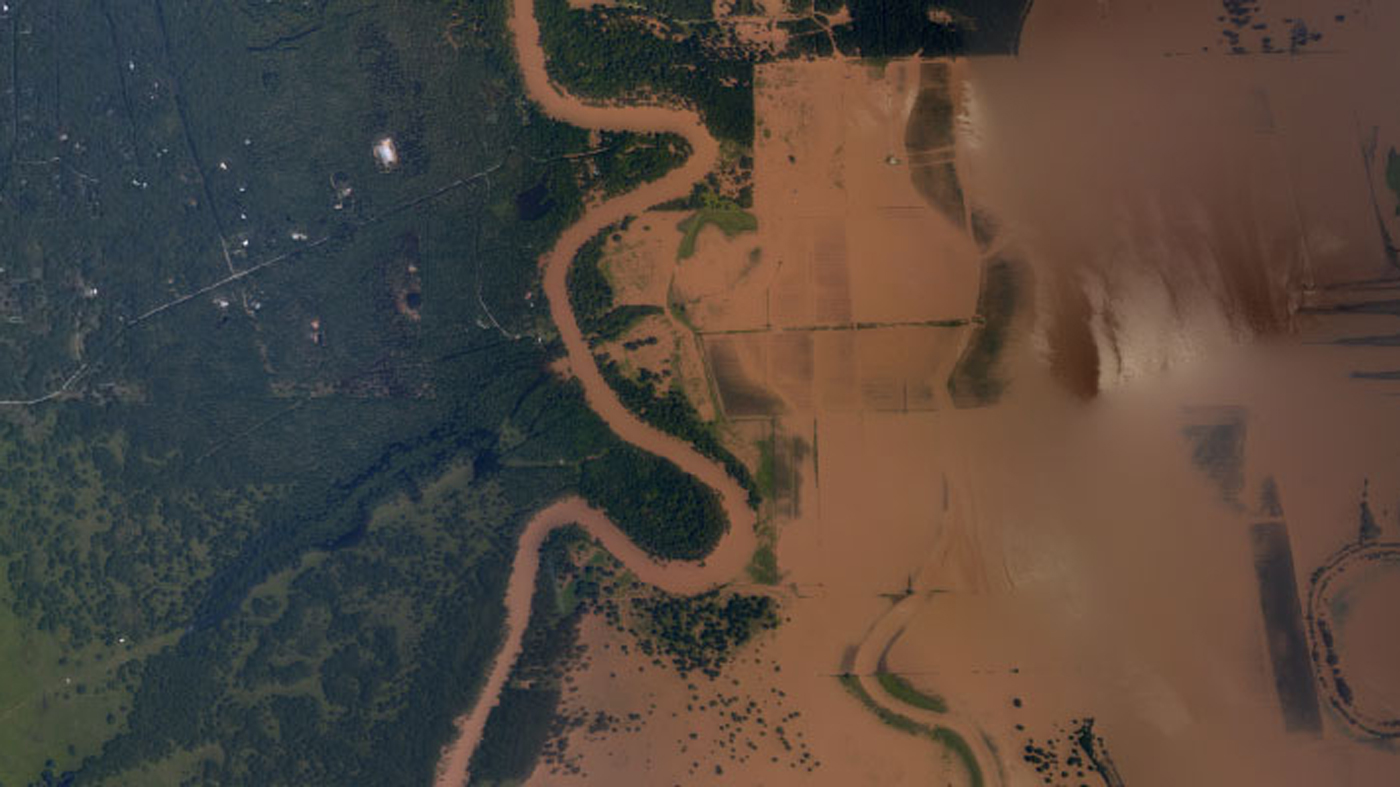 [Flooding in Otey, Texas, following Hurricane Harvey in 2017. This is one of a series of images captured by NOAA's National Geodetic Survey in the aftermath of the storm. Credits: NOAA]
The 30 percent of water that was stored on land then gradually dissipated over a period of about five weeks, likely through evapotranspiration, groundwater runoff into nearby rivers and the replenishment of aquifers.
How It Works
Made up of satellites, receivers and ground stations located around the world, GPS allows scientists to measure changes in Earth's surface elevation to an accuracy of less than an inch (a few millimeters). It works much like GPS on your mobile phone but with greater accuracy. The study team used daily elevation measurements from about 220 of these ground stations, from western Texas to Louisiana, to track changes in the amount of stormwater on land after the hurricane.
"When you sit on a mattress, your weight depresses its surface. Earth's crust is also elastic and behaves in a similar way under the weight of water," said Milliner. "GPS is measuring the amount of subsidence (or depression), which tells you how much water mass must be pressing on the surface and where that water is distributed."
[Flooding in Otey, Texas, following Hurricane Harvey in 2017. This is one of a series of images captured by NOAA's National Geodetic Survey in the aftermath of the storm. Credits: NOAA]
The 30 percent of water that was stored on land then gradually dissipated over a period of about five weeks, likely through evapotranspiration, groundwater runoff into nearby rivers and the replenishment of aquifers.
How It Works
Made up of satellites, receivers and ground stations located around the world, GPS allows scientists to measure changes in Earth's surface elevation to an accuracy of less than an inch (a few millimeters). It works much like GPS on your mobile phone but with greater accuracy. The study team used daily elevation measurements from about 220 of these ground stations, from western Texas to Louisiana, to track changes in the amount of stormwater on land after the hurricane.
"When you sit on a mattress, your weight depresses its surface. Earth's crust is also elastic and behaves in a similar way under the weight of water," said Milliner. "GPS is measuring the amount of subsidence (or depression), which tells you how much water mass must be pressing on the surface and where that water is distributed."
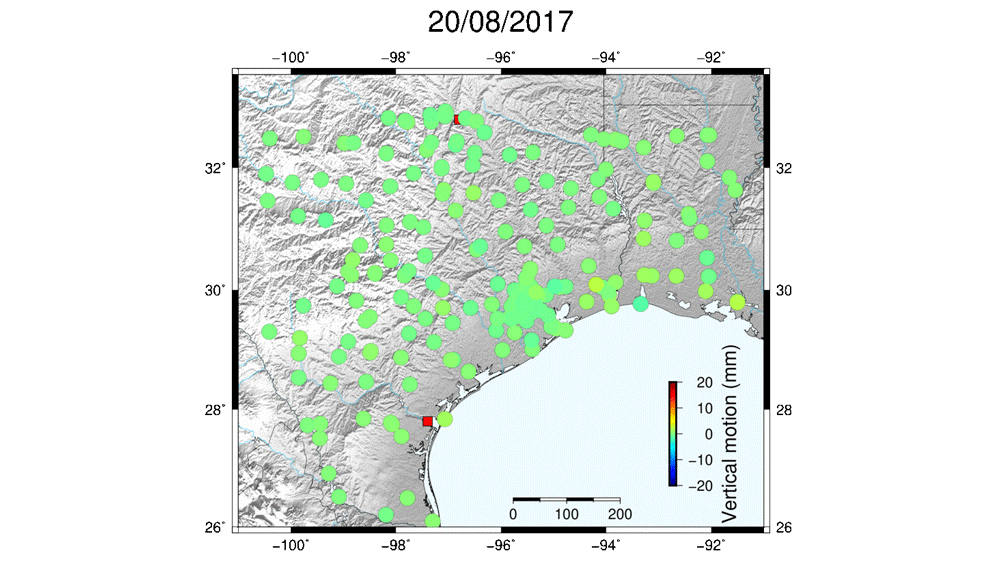 [Animation shows changes of GPS vertical positions post-Harvey over time. The warmer colors represent areas where the surface is depressed from the weight of Harvey's water. The red line is Harvey's actual path. GPS measured the subsidence, or surface depression, around Houston (center of the image) to be just under an inch (22 mm). The pattern of subsidence also migrated across the Gulf Coast toward western Louisiana over a seven-day period coinciding with the position of the hurricane. Credits: NASA/JPL-Caltech]
The team determined that in the first several days after Hurricane Harvey, the land around Houston lowered in elevation by as much as 20 millimeters. The GPS data also tracked a clear pattern of land subsidence that migrated across the Gulf Coast over a seven-day period, consistent with the position of Hurricane Harvey. Following this initial land subsidence, measurements from GPS stations found that Earth's surface gradually rose back up, indicating water was draining and evaporating from land -- just as a mattress behaves when you slowly stand up and remove your weight from it.
To detect Earth's mattress-like response to changes in water mass, the team first had to process the GPS data to remove systematic errors called common mode error (CME). CME acts essentially as "noise" that masks the hydrologic signal. Using an independent component-analysis filter, the team was able to statistically separate the raw GPS data into CME and hydrologic signals. This allowed them to discard the signal that was noise and extract the subtle hydrologic signal they sought.
With the filtered GPS data, scientists were able to determine the daily magnitude and location of the surface depression and from this calculate the daily mass of water that caused it.
[Animation shows changes of GPS vertical positions post-Harvey over time. The warmer colors represent areas where the surface is depressed from the weight of Harvey's water. The red line is Harvey's actual path. GPS measured the subsidence, or surface depression, around Houston (center of the image) to be just under an inch (22 mm). The pattern of subsidence also migrated across the Gulf Coast toward western Louisiana over a seven-day period coinciding with the position of the hurricane. Credits: NASA/JPL-Caltech]
The team determined that in the first several days after Hurricane Harvey, the land around Houston lowered in elevation by as much as 20 millimeters. The GPS data also tracked a clear pattern of land subsidence that migrated across the Gulf Coast over a seven-day period, consistent with the position of Hurricane Harvey. Following this initial land subsidence, measurements from GPS stations found that Earth's surface gradually rose back up, indicating water was draining and evaporating from land -- just as a mattress behaves when you slowly stand up and remove your weight from it.
To detect Earth's mattress-like response to changes in water mass, the team first had to process the GPS data to remove systematic errors called common mode error (CME). CME acts essentially as "noise" that masks the hydrologic signal. Using an independent component-analysis filter, the team was able to statistically separate the raw GPS data into CME and hydrologic signals. This allowed them to discard the signal that was noise and extract the subtle hydrologic signal they sought.
With the filtered GPS data, scientists were able to determine the daily magnitude and location of the surface depression and from this calculate the daily mass of water that caused it.
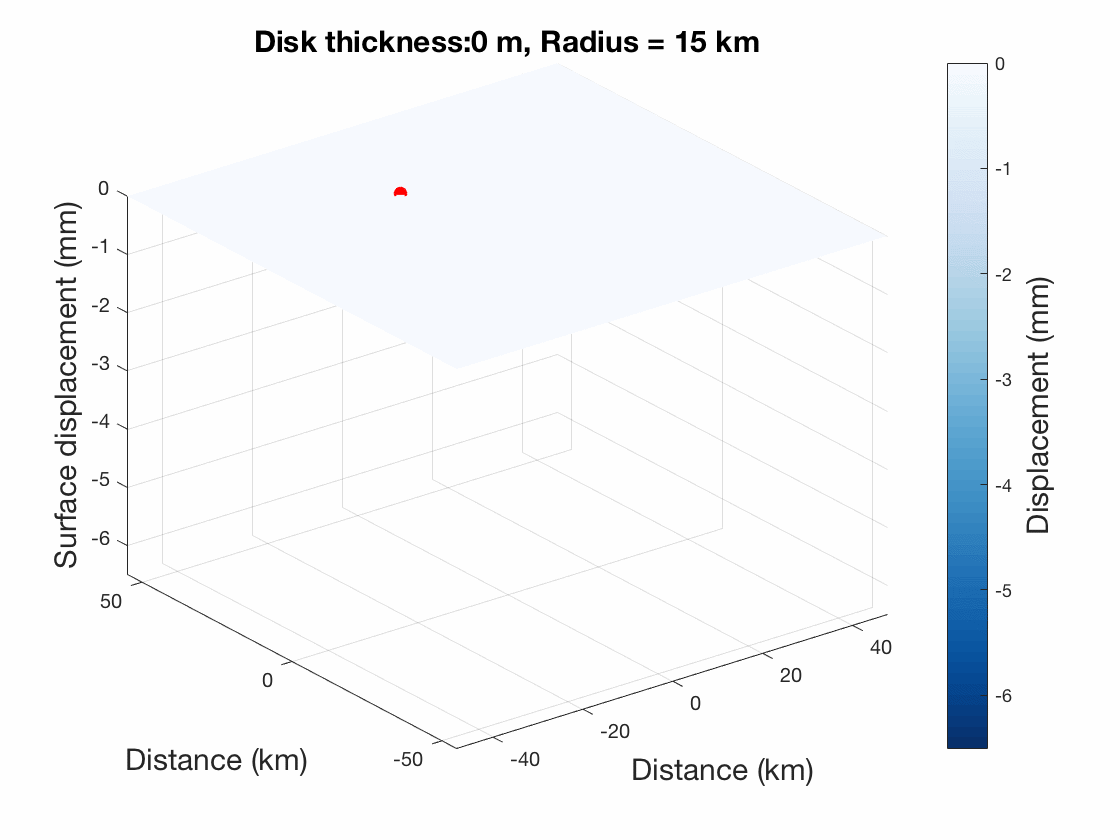 [This animation shows the elastic response of Earth to increasing and decreasing a water load on the surface. The amount of depression corresponds with the expected depression the surface underwent due to the weight of Hurricane Harvey's stormwater. Credits: NASA/JPL-Caltech]
Why It Matters
The study demonstrates -- for the first time -- that it is possible to robustly quantify daily changes in water storage following extreme precipitation events like major hurricanes. It allows us to see how much water is temporarily stored on land after a major hurricane, where it is stored, and how long it takes for stored water to dissipate over time.
Scientists wanting to understand how the hydrologic system behaves in response to large storms benefit from this information, but so do water and flood managers. If they know how much water was stored on land and how long it took for the water to dissipate after a major precipitation event, they have a clearer understanding of what to expect when the next major, rain-intensive storm hits -- and can prepare accordingly.
[This animation shows the elastic response of Earth to increasing and decreasing a water load on the surface. The amount of depression corresponds with the expected depression the surface underwent due to the weight of Hurricane Harvey's stormwater. Credits: NASA/JPL-Caltech]
Why It Matters
The study demonstrates -- for the first time -- that it is possible to robustly quantify daily changes in water storage following extreme precipitation events like major hurricanes. It allows us to see how much water is temporarily stored on land after a major hurricane, where it is stored, and how long it takes for stored water to dissipate over time.
Scientists wanting to understand how the hydrologic system behaves in response to large storms benefit from this information, but so do water and flood managers. If they know how much water was stored on land and how long it took for the water to dissipate after a major precipitation event, they have a clearer understanding of what to expect when the next major, rain-intensive storm hits -- and can prepare accordingly.
[Flooding in Otey, Texas, following Hurricane Harvey in 2017. This is one of a series of images captured by NOAA's National Geodetic Survey in the aftermath of the storm. Credits: NOAA]
The 30 percent of water that was stored on land then gradually dissipated over a period of about five weeks, likely through evapotranspiration, groundwater runoff into nearby rivers and the replenishment of aquifers.
How It Works
Made up of satellites, receivers and ground stations located around the world, GPS allows scientists to measure changes in Earth's surface elevation to an accuracy of less than an inch (a few millimeters). It works much like GPS on your mobile phone but with greater accuracy. The study team used daily elevation measurements from about 220 of these ground stations, from western Texas to Louisiana, to track changes in the amount of stormwater on land after the hurricane.
"When you sit on a mattress, your weight depresses its surface. Earth's crust is also elastic and behaves in a similar way under the weight of water," said Milliner. "GPS is measuring the amount of subsidence (or depression), which tells you how much water mass must be pressing on the surface and where that water is distributed."
[Animation shows changes of GPS vertical positions post-Harvey over time. The warmer colors represent areas where the surface is depressed from the weight of Harvey's water. The red line is Harvey's actual path. GPS measured the subsidence, or surface depression, around Houston (center of the image) to be just under an inch (22 mm). The pattern of subsidence also migrated across the Gulf Coast toward western Louisiana over a seven-day period coinciding with the position of the hurricane. Credits: NASA/JPL-Caltech]
The team determined that in the first several days after Hurricane Harvey, the land around Houston lowered in elevation by as much as 20 millimeters. The GPS data also tracked a clear pattern of land subsidence that migrated across the Gulf Coast over a seven-day period, consistent with the position of Hurricane Harvey. Following this initial land subsidence, measurements from GPS stations found that Earth's surface gradually rose back up, indicating water was draining and evaporating from land -- just as a mattress behaves when you slowly stand up and remove your weight from it.
To detect Earth's mattress-like response to changes in water mass, the team first had to process the GPS data to remove systematic errors called common mode error (CME). CME acts essentially as "noise" that masks the hydrologic signal. Using an independent component-analysis filter, the team was able to statistically separate the raw GPS data into CME and hydrologic signals. This allowed them to discard the signal that was noise and extract the subtle hydrologic signal they sought.
With the filtered GPS data, scientists were able to determine the daily magnitude and location of the surface depression and from this calculate the daily mass of water that caused it.
[This animation shows the elastic response of Earth to increasing and decreasing a water load on the surface. The amount of depression corresponds with the expected depression the surface underwent due to the weight of Hurricane Harvey's stormwater. Credits: NASA/JPL-Caltech]
Why It Matters
The study demonstrates -- for the first time -- that it is possible to robustly quantify daily changes in water storage following extreme precipitation events like major hurricanes. It allows us to see how much water is temporarily stored on land after a major hurricane, where it is stored, and how long it takes for stored water to dissipate over time.
Scientists wanting to understand how the hydrologic system behaves in response to large storms benefit from this information, but so do water and flood managers. If they know how much water was stored on land and how long it took for the water to dissipate after a major precipitation event, they have a clearer understanding of what to expect when the next major, rain-intensive storm hits -- and can prepare accordingly.
Edited for WeatherNation by Meteorologist Mace Michaels
All Weather News
More
Wildfire Outbreak in the Pacific Northwest
SPOKANE, WA - On Saturday, August 1st, the Ol
2 Aug 2026 7:20 PM

More Storms for the East Through Monday
A low-pressure system that moved through the
2 Aug 2026 7:20 PM


After Reaching Category 5, Genevieve Weakens in the Pacific
PacificGenevieve formed on last Friday south
2 Aug 2026 6:25 PM

Flooding, Severe Storms Target the Midwest Again
After an active week of storms across the nor
1 Aug 2026 1:40 AM

Flooding Risk Increases as Heavy Rain Targets the Tri-State Area
Tuesday, heavy rainfall moved across the Nort
30 Jul 2026 12:25 AM

Severe Weather: Energy From the Midwest Now in the Southeast
UPPER MIDWEST - Through Monday, dangerous tor
29 Jul 2026 10:30 PM