A Look at the Uncertain Impacts of El Niño on the Upcoming Winter
Special Stories
23 Oct 2018 8:01 AM
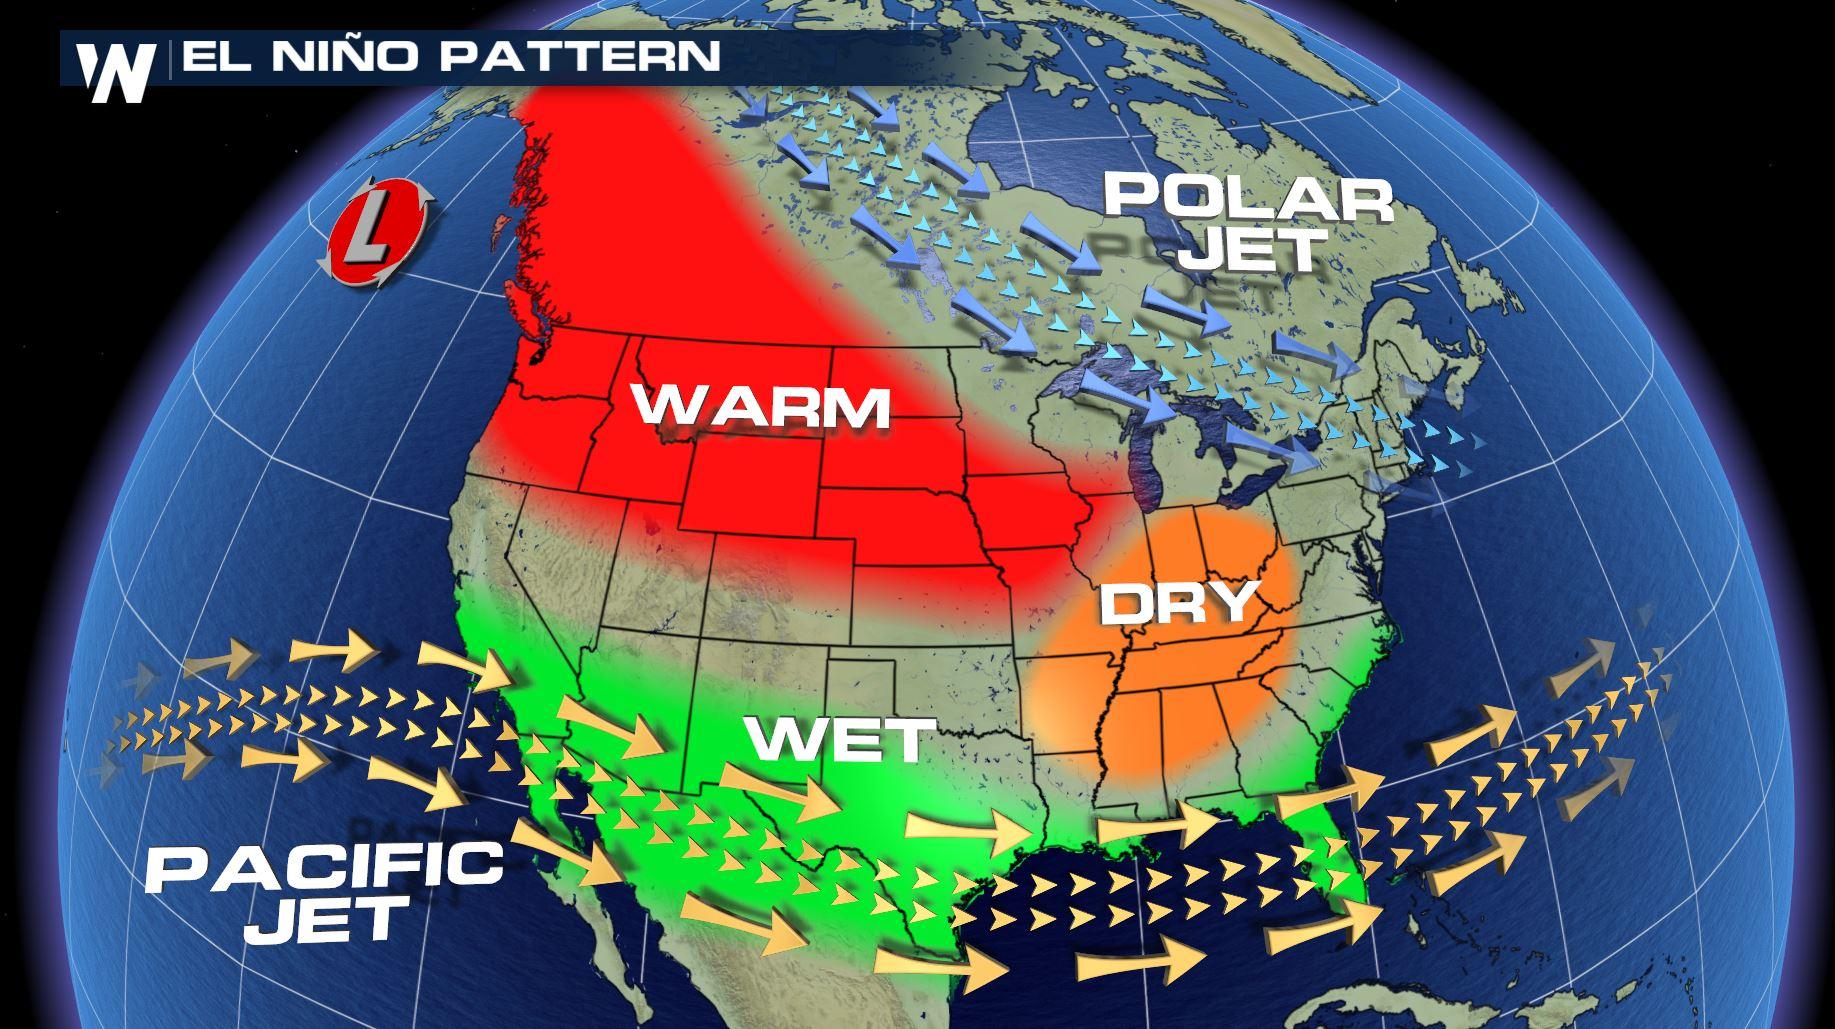
[NOAA by Mike Halpert] The air is starting to feel crisp, the leaves are changing, and the aroma of pumpkin spice lattes are filling your favorite coffee shops. Last week, NOAA issued it's outlook for the upcoming winter. And once again, one of the key players is found in the tropical Pacific. In contrast with the last two years, when we were looking at potential La Niña development, this year we’re waiting to see if El Niño will arrive in time to impact winter. Without further ado, let’s take a closer look at NOAA’s 2018-19 Winter Temperature and Precipitation Outlook and see how El Nino has affected this forecast.
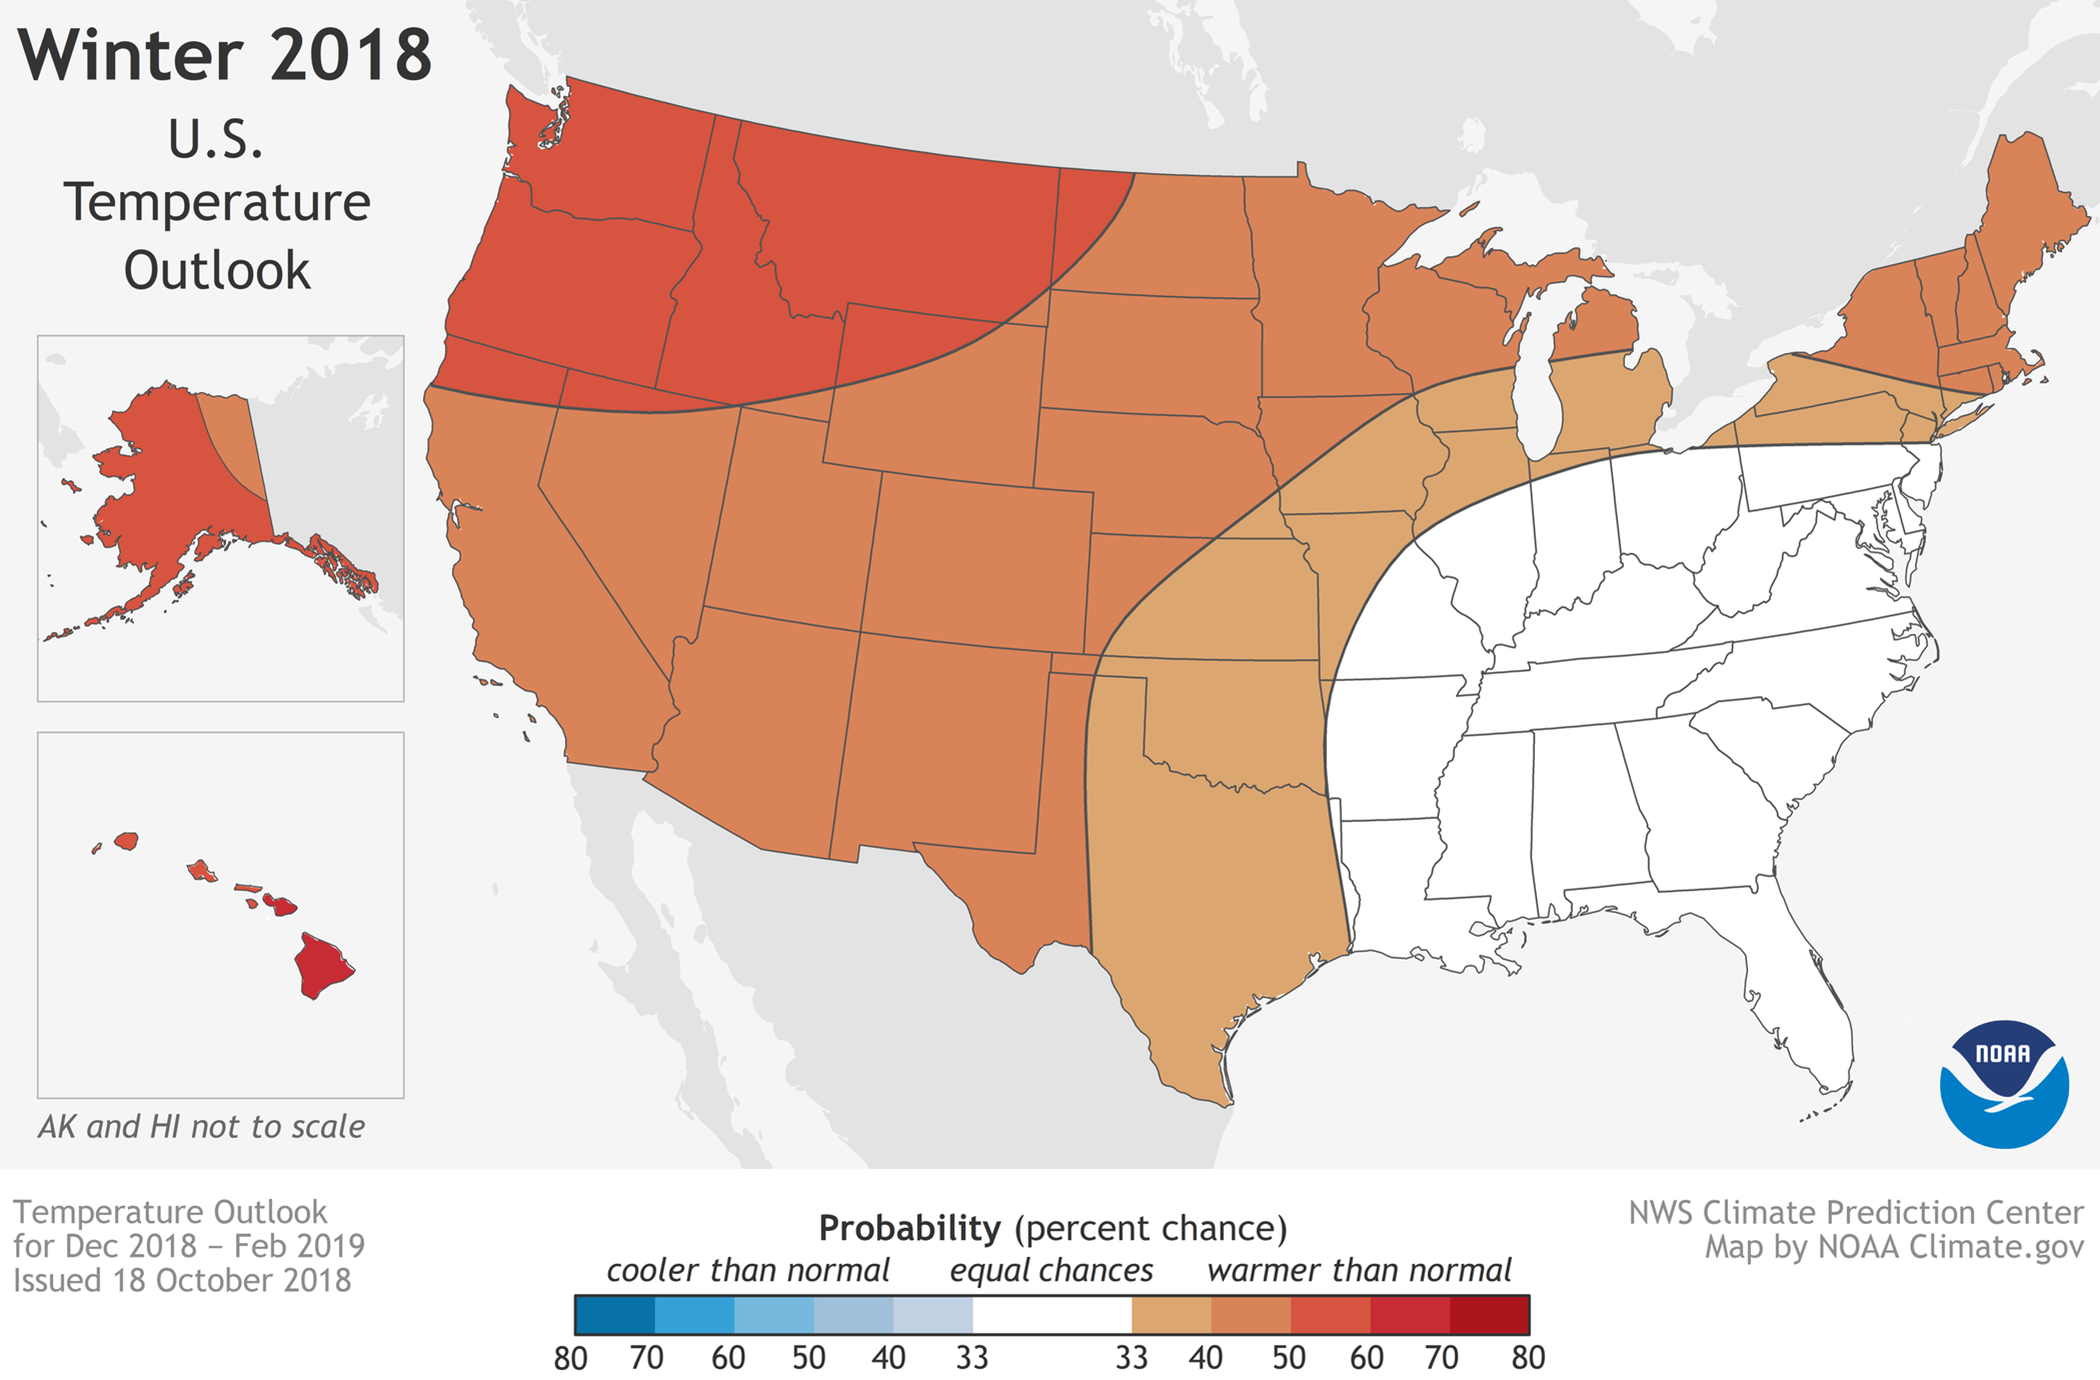 [Places where the forecast odds favor a much colder than usual winter (blue colors) or much warmer than usual winter (red), or where the probability of a cold winter, a warm winter, or a near-normal winter are all equal (white). The darker the color, the stronger the chance of that outcome (not the bigger the departure from average). NOAA Climate map, based on data from NOAA CPC.]
Finally, the outlooks! Both the temperature and precipitation outlooks depend to a certain extent on typical El Niño impacts, but forecasters think a weak El Niño event is most likely. This means that despite the potential for El Niño, confidence in this outlook is less than we had than during recent strong events like in the winter of 2015/16 (more on confidence below).
This lower confidence is reflected in fairly modest probabilities for the temperature outlook, with the largest probabilities only between 50-60% for above normal temperatures in Hawaii, Alaska, and parts of the Pacific Northwest and northern Rockies. The other shaded regions on the map indicate probabilities between 33-50%, meaning that the forecast only tilts modestly towards above normal temperatures. And while no areas of the country are favored to have below normal temperatures, it certainly wouldn’t be surprising for some areas to experience below normal temperatures this winter. This would be most likely in the white areas labeled EC (more on that later).
[Places where the forecast odds favor a much colder than usual winter (blue colors) or much warmer than usual winter (red), or where the probability of a cold winter, a warm winter, or a near-normal winter are all equal (white). The darker the color, the stronger the chance of that outcome (not the bigger the departure from average). NOAA Climate map, based on data from NOAA CPC.]
Finally, the outlooks! Both the temperature and precipitation outlooks depend to a certain extent on typical El Niño impacts, but forecasters think a weak El Niño event is most likely. This means that despite the potential for El Niño, confidence in this outlook is less than we had than during recent strong events like in the winter of 2015/16 (more on confidence below).
This lower confidence is reflected in fairly modest probabilities for the temperature outlook, with the largest probabilities only between 50-60% for above normal temperatures in Hawaii, Alaska, and parts of the Pacific Northwest and northern Rockies. The other shaded regions on the map indicate probabilities between 33-50%, meaning that the forecast only tilts modestly towards above normal temperatures. And while no areas of the country are favored to have below normal temperatures, it certainly wouldn’t be surprising for some areas to experience below normal temperatures this winter. This would be most likely in the white areas labeled EC (more on that later).
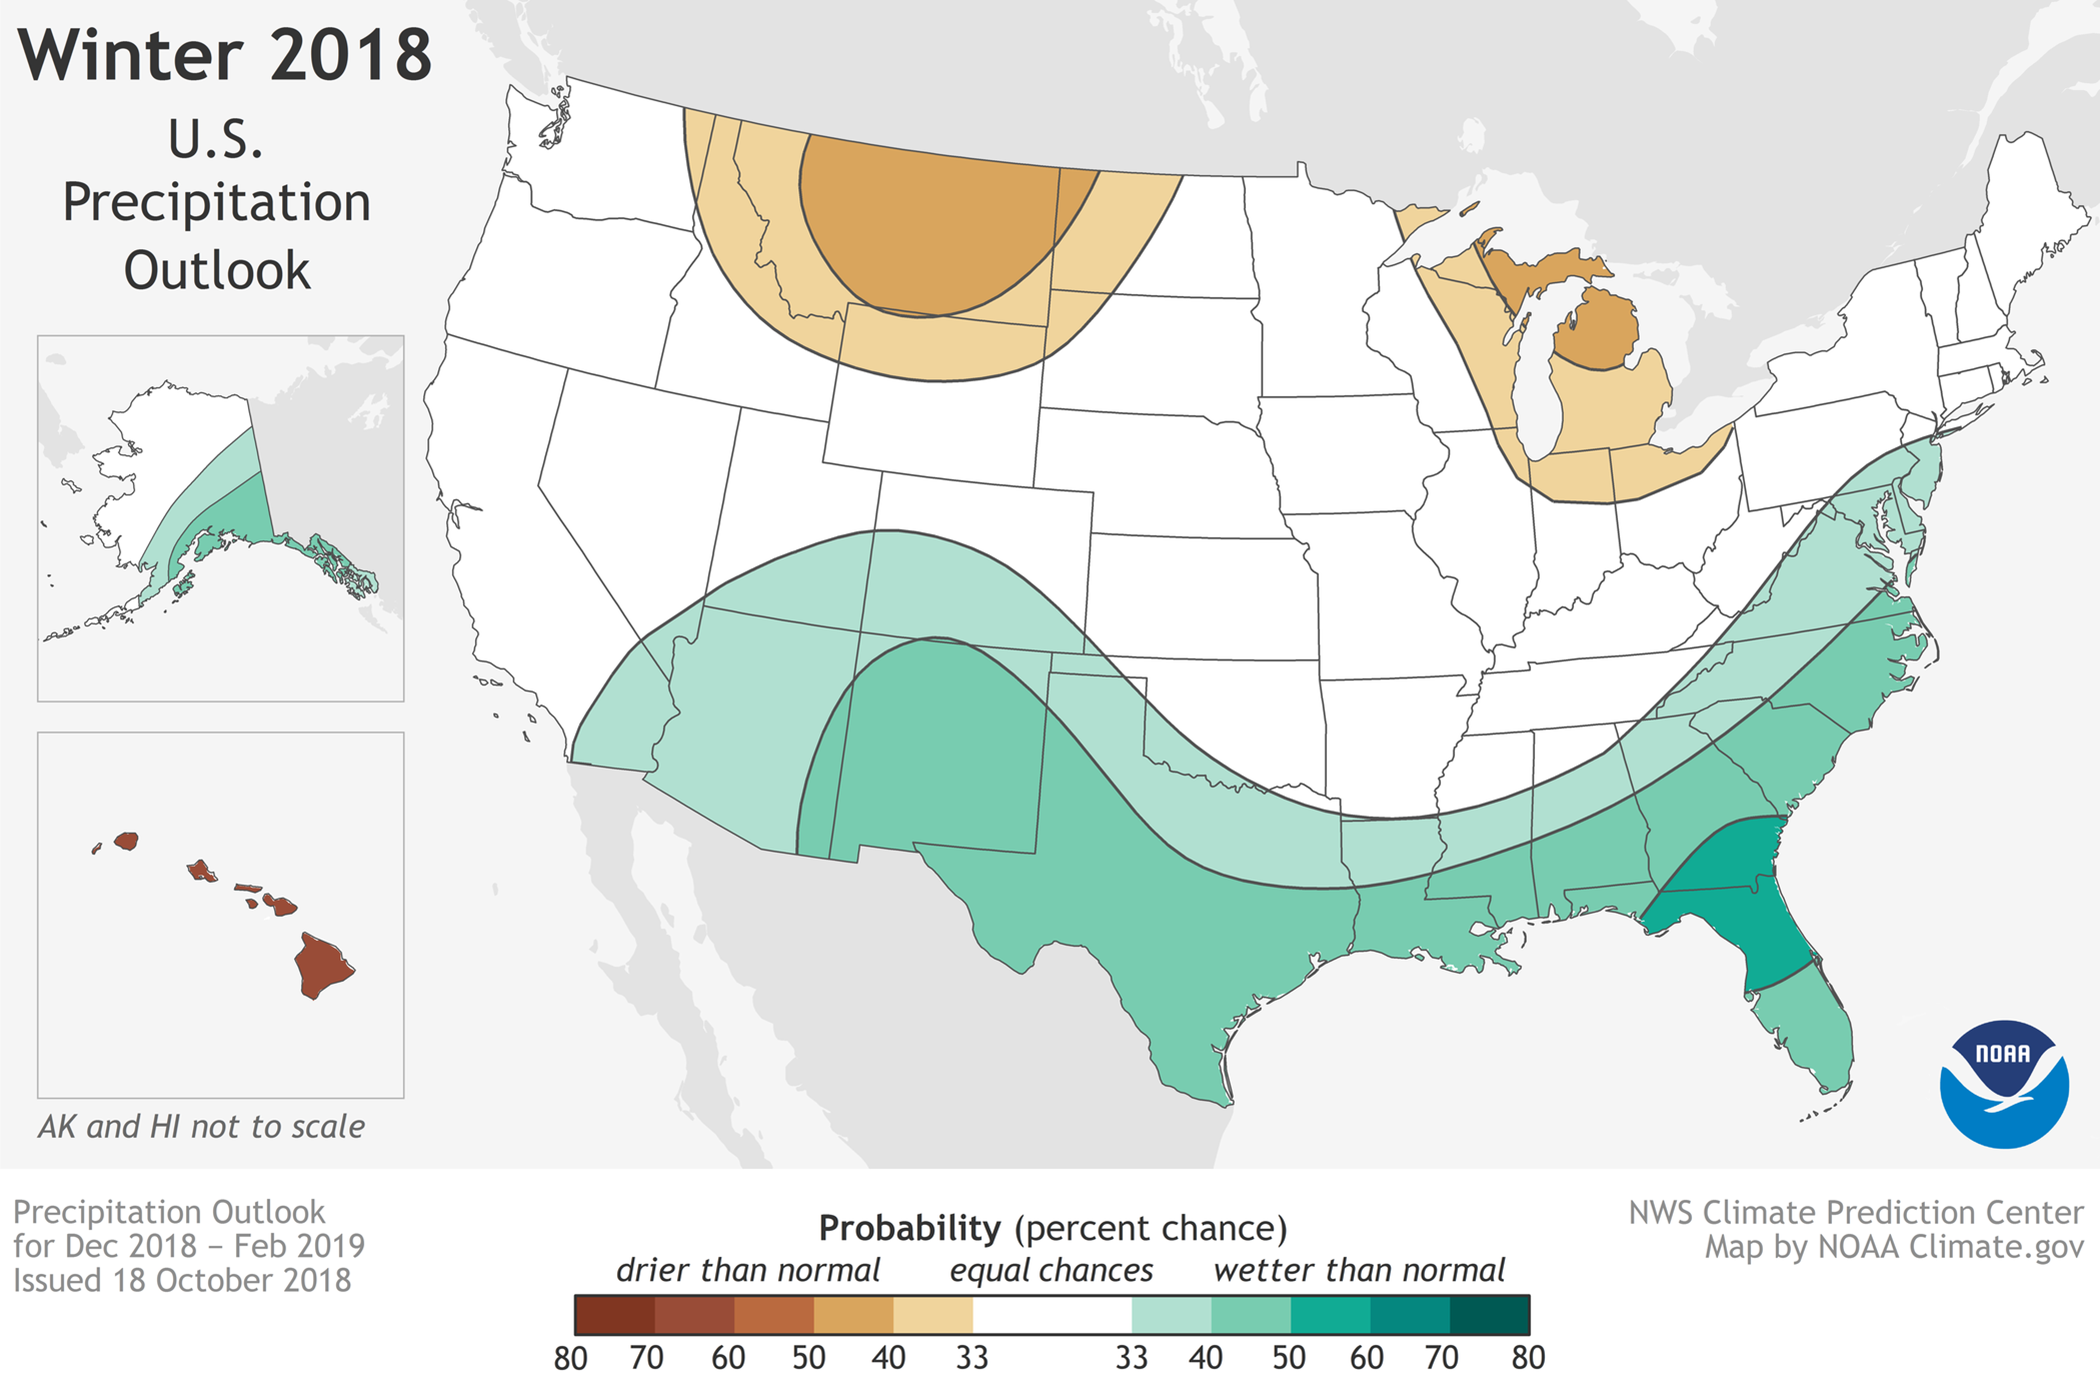 [Places where the forecast odds favor a much drier than usual winter (brown colors) or much wetter than usual winter (blue-green), or where the probability of a dry winter, a wet winter, or a near-normal winter are all equal (white). The darker the color, the stronger the chance of that outcome (not the bigger the departure from average). NOAA Climate map, based on data from NOAA CPC.]
Similarly, the precipitation outlook is also much less confident (lower probabilities) than the forecast for the last El Niño winter. The pattern does resemble the typical precipitation pattern seen in an average El Niño, with above-average precipitation favored over much of the southern tier and southern Alaska, and with below-average precipitation most likely in the northern Rockies, around the Great Lakes and in Hawaii. However, the probabilities are much lower than typical for an El Niño winter, reflecting greater uncertainty over what may happen. A 50% chance is exceeded only in northern Florida and southern Georgia, and in Hawaii.
Both maps include blank regions where neither above-, nor near-, nor below-normal is favored. These areas (shown in white and labeled EC for “equal chances”), have the same chance for above-, near-, or below-normal (33.33%). This doesn’t mean that near-average temperature or precipitation is expected this winter in those regions, but rather that there’s no tilt in the odds toward any outcome. And as mentioned earlier, the blank region in the temperature map has the greatest chance of being colder than average this winter.
[Places where the forecast odds favor a much drier than usual winter (brown colors) or much wetter than usual winter (blue-green), or where the probability of a dry winter, a wet winter, or a near-normal winter are all equal (white). The darker the color, the stronger the chance of that outcome (not the bigger the departure from average). NOAA Climate map, based on data from NOAA CPC.]
Similarly, the precipitation outlook is also much less confident (lower probabilities) than the forecast for the last El Niño winter. The pattern does resemble the typical precipitation pattern seen in an average El Niño, with above-average precipitation favored over much of the southern tier and southern Alaska, and with below-average precipitation most likely in the northern Rockies, around the Great Lakes and in Hawaii. However, the probabilities are much lower than typical for an El Niño winter, reflecting greater uncertainty over what may happen. A 50% chance is exceeded only in northern Florida and southern Georgia, and in Hawaii.
Both maps include blank regions where neither above-, nor near-, nor below-normal is favored. These areas (shown in white and labeled EC for “equal chances”), have the same chance for above-, near-, or below-normal (33.33%). This doesn’t mean that near-average temperature or precipitation is expected this winter in those regions, but rather that there’s no tilt in the odds toward any outcome. And as mentioned earlier, the blank region in the temperature map has the greatest chance of being colder than average this winter.
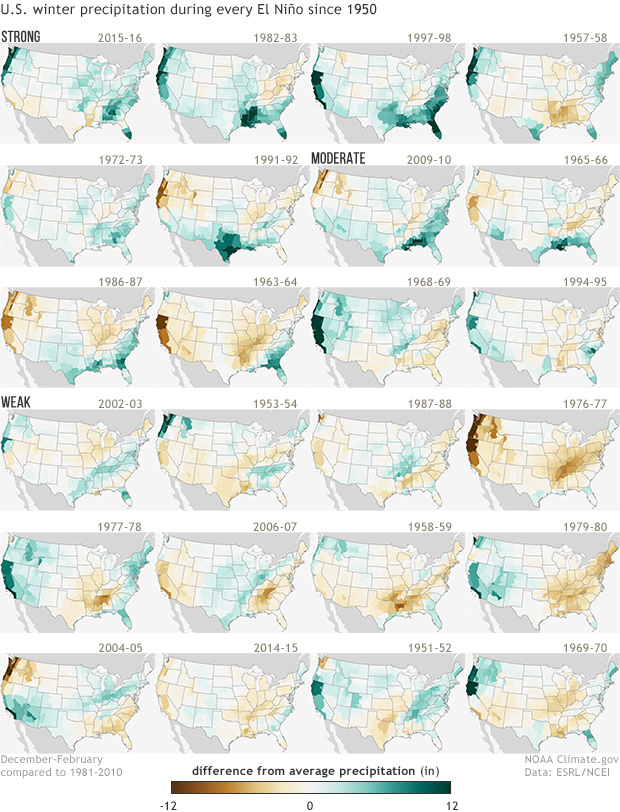 [Winter precipitation patterns during each of the El Niño episodes since 1950. Dark green colors indicate much wetter than normal conditions, and dark brown colors indicate much drier than normal conditions. The top row corresponds with the strongest El Niño episodes, the two rows below correspond with moderate El Niño episodes, and the bottom three rows correspond with weak El Niño episodes. Maps by NOAA Climate, based on NCDC climate division data provided by the Physical Sciences Division at NOAA ESRL.]
This is especially true for precipitation, with the tendency for wetter seasons often dominating the southern part of the nation during the stronger episodes (maps towards the top of the figure), but drier winters occurring more frequently for the weaker episodes (bottom 12 maps). Thus, the precipitation outlook will be less confident during the weaker episodes.
Temperature patterns over the U.S. (below) are not as well defined, with the El Niño winter-to-winter variability fairly large among the stronger events, although the 3 strongest events (1982-83, 1997-98, and 2015-16) were generally well above average coast to coast. However, some of the other stronger events (1972-73, 1965-66) were much colder, indicating that agreement even among the stronger episodes is lower. An average (not shown) of the 12 weakest events reveals some agreement favoring above average temperatures in the western and central states, but a more muddled picture in the East, where weak El Niño winter temperatures have varied widely from below-normal to above-normal. This East-West split may not be robust due to the small sample size, but it may also indicate that weak El Niño winters feature a typical temperature pattern that is somewhat distinct from the canonical pattern of a warmer-than-normal North and a normal or colder-than-normal South.
[Winter precipitation patterns during each of the El Niño episodes since 1950. Dark green colors indicate much wetter than normal conditions, and dark brown colors indicate much drier than normal conditions. The top row corresponds with the strongest El Niño episodes, the two rows below correspond with moderate El Niño episodes, and the bottom three rows correspond with weak El Niño episodes. Maps by NOAA Climate, based on NCDC climate division data provided by the Physical Sciences Division at NOAA ESRL.]
This is especially true for precipitation, with the tendency for wetter seasons often dominating the southern part of the nation during the stronger episodes (maps towards the top of the figure), but drier winters occurring more frequently for the weaker episodes (bottom 12 maps). Thus, the precipitation outlook will be less confident during the weaker episodes.
Temperature patterns over the U.S. (below) are not as well defined, with the El Niño winter-to-winter variability fairly large among the stronger events, although the 3 strongest events (1982-83, 1997-98, and 2015-16) were generally well above average coast to coast. However, some of the other stronger events (1972-73, 1965-66) were much colder, indicating that agreement even among the stronger episodes is lower. An average (not shown) of the 12 weakest events reveals some agreement favoring above average temperatures in the western and central states, but a more muddled picture in the East, where weak El Niño winter temperatures have varied widely from below-normal to above-normal. This East-West split may not be robust due to the small sample size, but it may also indicate that weak El Niño winters feature a typical temperature pattern that is somewhat distinct from the canonical pattern of a warmer-than-normal North and a normal or colder-than-normal South.
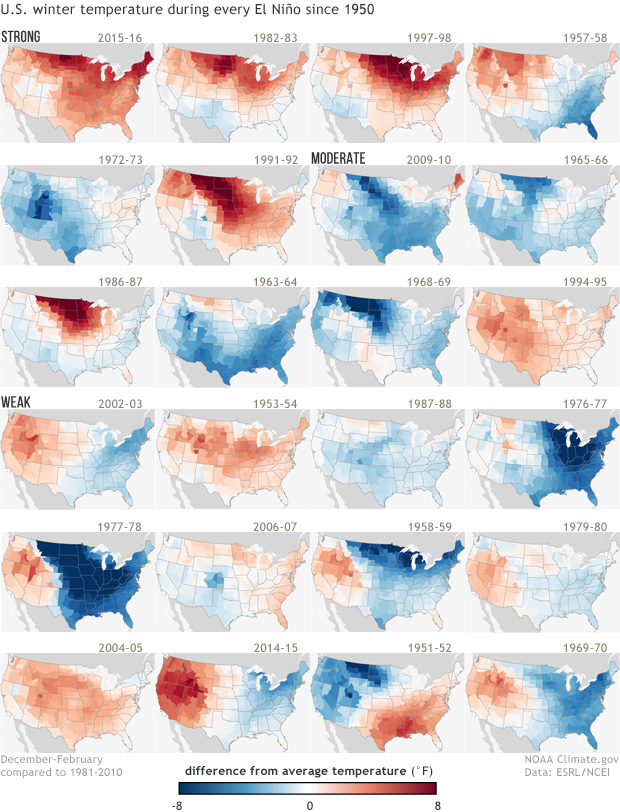 [Winter temperature patterns during each of the El Niño episodes since 1950. Dark red colors indicate much warmer than normal conditions, and dark blue colors indicate much colder than normal conditions. The top row corresponds with the strongest El Niño episodes, the two rows below correspond with moderate El Niño episodes, and the bottom three rows correspond with weak El Niño episodes. Maps by NOAA Climate, based on NCDC climate division data provided by the Physical Sciences Division at NOAA ESRL.]
This lack of consistency reflects that a weaker El Niño does not exert a strong push (or forcing) on the U.S. If we have a stronger El Niño, the big push from the vigorous tropical heating sets off a cascade of global impacts, including changes in the strength and position of the jet stream that affects U.S. weather, which tends to dominate over other factors that could impact the outlook. Because of an expected smaller push from El Niño, however, other climate patterns are more likely to play a larger role in shaping the upcoming winter. These patterns, like the Arctic Oscillation and the Madden-Julian Oscillation, can have a profound impact on the character of the winter, but are quite challenging to predict months in advance.
Footnotes
(1) The three categories are defined by terciles of the historical temperature or precipitation data, which are the 33.33 and 66.67 percentile positions in the distribution. In other words, they are the boundaries that subdivide the historical data into three equally populated categories (one-third of the data in each category): below-normal, near-normal and above-normal. In the maps, the CPC forecasts show the probability of the favored category only when there is a favored category; otherwise, they show EC (“equal chances”). Often, the near-normal category remains at 33.33%, and the category opposite the favored one is below 33.33% by the same amount that the favored category is above 33.33%. When the probability of the favored category becomes very large, such as 70% (which is very rare), the above rule for assigning the probabilities for the two non-favored categories becomes different.
Edited for WeatherNation by Meteorologist Mace Michaels
[Winter temperature patterns during each of the El Niño episodes since 1950. Dark red colors indicate much warmer than normal conditions, and dark blue colors indicate much colder than normal conditions. The top row corresponds with the strongest El Niño episodes, the two rows below correspond with moderate El Niño episodes, and the bottom three rows correspond with weak El Niño episodes. Maps by NOAA Climate, based on NCDC climate division data provided by the Physical Sciences Division at NOAA ESRL.]
This lack of consistency reflects that a weaker El Niño does not exert a strong push (or forcing) on the U.S. If we have a stronger El Niño, the big push from the vigorous tropical heating sets off a cascade of global impacts, including changes in the strength and position of the jet stream that affects U.S. weather, which tends to dominate over other factors that could impact the outlook. Because of an expected smaller push from El Niño, however, other climate patterns are more likely to play a larger role in shaping the upcoming winter. These patterns, like the Arctic Oscillation and the Madden-Julian Oscillation, can have a profound impact on the character of the winter, but are quite challenging to predict months in advance.
Footnotes
(1) The three categories are defined by terciles of the historical temperature or precipitation data, which are the 33.33 and 66.67 percentile positions in the distribution. In other words, they are the boundaries that subdivide the historical data into three equally populated categories (one-third of the data in each category): below-normal, near-normal and above-normal. In the maps, the CPC forecasts show the probability of the favored category only when there is a favored category; otherwise, they show EC (“equal chances”). Often, the near-normal category remains at 33.33%, and the category opposite the favored one is below 33.33% by the same amount that the favored category is above 33.33%. When the probability of the favored category becomes very large, such as 70% (which is very rare), the above rule for assigning the probabilities for the two non-favored categories becomes different.
Edited for WeatherNation by Meteorologist Mace Michaels
As usual: Outlooks are probabilistic, so no guarantees
Wait, just one more thing before jumping to the outlooks. I again remind readers (if this seems repetitive, well, it is) that these forecasts are provided in terms of probabilities (% chance) for below, near, or above average outcomes with the maps showing only the most likely outcome (1). Because the probabilities on these and all CPC outlook maps are less than 100%, there is no guarantee you will see temperature or precipitation departures from normal that match the color on the map. As we’ve explained in earlier blog posts, even when one outcome is more likely than another, there is still always a chance that a less favored outcome will occur. And in fact, for the forecasts to be reliable (a critical part of a probabilistic forecast), less likely outcomes MUST happen from time to time.Outlook for 2018/19 winter
[Places where the forecast odds favor a much colder than usual winter (blue colors) or much warmer than usual winter (red), or where the probability of a cold winter, a warm winter, or a near-normal winter are all equal (white). The darker the color, the stronger the chance of that outcome (not the bigger the departure from average). NOAA Climate map, based on data from NOAA CPC.]
Finally, the outlooks! Both the temperature and precipitation outlooks depend to a certain extent on typical El Niño impacts, but forecasters think a weak El Niño event is most likely. This means that despite the potential for El Niño, confidence in this outlook is less than we had than during recent strong events like in the winter of 2015/16 (more on confidence below).
This lower confidence is reflected in fairly modest probabilities for the temperature outlook, with the largest probabilities only between 50-60% for above normal temperatures in Hawaii, Alaska, and parts of the Pacific Northwest and northern Rockies. The other shaded regions on the map indicate probabilities between 33-50%, meaning that the forecast only tilts modestly towards above normal temperatures. And while no areas of the country are favored to have below normal temperatures, it certainly wouldn’t be surprising for some areas to experience below normal temperatures this winter. This would be most likely in the white areas labeled EC (more on that later).
[Places where the forecast odds favor a much drier than usual winter (brown colors) or much wetter than usual winter (blue-green), or where the probability of a dry winter, a wet winter, or a near-normal winter are all equal (white). The darker the color, the stronger the chance of that outcome (not the bigger the departure from average). NOAA Climate map, based on data from NOAA CPC.]
Similarly, the precipitation outlook is also much less confident (lower probabilities) than the forecast for the last El Niño winter. The pattern does resemble the typical precipitation pattern seen in an average El Niño, with above-average precipitation favored over much of the southern tier and southern Alaska, and with below-average precipitation most likely in the northern Rockies, around the Great Lakes and in Hawaii. However, the probabilities are much lower than typical for an El Niño winter, reflecting greater uncertainty over what may happen. A 50% chance is exceeded only in northern Florida and southern Georgia, and in Hawaii.
Both maps include blank regions where neither above-, nor near-, nor below-normal is favored. These areas (shown in white and labeled EC for “equal chances”), have the same chance for above-, near-, or below-normal (33.33%). This doesn’t mean that near-average temperature or precipitation is expected this winter in those regions, but rather that there’s no tilt in the odds toward any outcome. And as mentioned earlier, the blank region in the temperature map has the greatest chance of being colder than average this winter.
El Niño: Where’s the confidence?
In two of my earliest posts for the ENSO Blog, I wrote about the relationship between El Niño and winter precipitation and temperature, presenting figures showing precipitation and temperature differences from average for the 20 prior El Niño episodes from 1950-2013. Here those figures are updated below to include events through the 2015/16 El Niño. An important theme emerges from these two figures: in terms of U.S. impacts, no two El Niño episodes are the same, and winter precipitation and temperature become less consistent as the strength of El Niño decreases.
[Winter precipitation patterns during each of the El Niño episodes since 1950. Dark green colors indicate much wetter than normal conditions, and dark brown colors indicate much drier than normal conditions. The top row corresponds with the strongest El Niño episodes, the two rows below correspond with moderate El Niño episodes, and the bottom three rows correspond with weak El Niño episodes. Maps by NOAA Climate, based on NCDC climate division data provided by the Physical Sciences Division at NOAA ESRL.]
This is especially true for precipitation, with the tendency for wetter seasons often dominating the southern part of the nation during the stronger episodes (maps towards the top of the figure), but drier winters occurring more frequently for the weaker episodes (bottom 12 maps). Thus, the precipitation outlook will be less confident during the weaker episodes.
Temperature patterns over the U.S. (below) are not as well defined, with the El Niño winter-to-winter variability fairly large among the stronger events, although the 3 strongest events (1982-83, 1997-98, and 2015-16) were generally well above average coast to coast. However, some of the other stronger events (1972-73, 1965-66) were much colder, indicating that agreement even among the stronger episodes is lower. An average (not shown) of the 12 weakest events reveals some agreement favoring above average temperatures in the western and central states, but a more muddled picture in the East, where weak El Niño winter temperatures have varied widely from below-normal to above-normal. This East-West split may not be robust due to the small sample size, but it may also indicate that weak El Niño winters feature a typical temperature pattern that is somewhat distinct from the canonical pattern of a warmer-than-normal North and a normal or colder-than-normal South.
[Winter temperature patterns during each of the El Niño episodes since 1950. Dark red colors indicate much warmer than normal conditions, and dark blue colors indicate much colder than normal conditions. The top row corresponds with the strongest El Niño episodes, the two rows below correspond with moderate El Niño episodes, and the bottom three rows correspond with weak El Niño episodes. Maps by NOAA Climate, based on NCDC climate division data provided by the Physical Sciences Division at NOAA ESRL.]
This lack of consistency reflects that a weaker El Niño does not exert a strong push (or forcing) on the U.S. If we have a stronger El Niño, the big push from the vigorous tropical heating sets off a cascade of global impacts, including changes in the strength and position of the jet stream that affects U.S. weather, which tends to dominate over other factors that could impact the outlook. Because of an expected smaller push from El Niño, however, other climate patterns are more likely to play a larger role in shaping the upcoming winter. These patterns, like the Arctic Oscillation and the Madden-Julian Oscillation, can have a profound impact on the character of the winter, but are quite challenging to predict months in advance.
Footnotes
(1) The three categories are defined by terciles of the historical temperature or precipitation data, which are the 33.33 and 66.67 percentile positions in the distribution. In other words, they are the boundaries that subdivide the historical data into three equally populated categories (one-third of the data in each category): below-normal, near-normal and above-normal. In the maps, the CPC forecasts show the probability of the favored category only when there is a favored category; otherwise, they show EC (“equal chances”). Often, the near-normal category remains at 33.33%, and the category opposite the favored one is below 33.33% by the same amount that the favored category is above 33.33%. When the probability of the favored category becomes very large, such as 70% (which is very rare), the above rule for assigning the probabilities for the two non-favored categories becomes different.
Edited for WeatherNation by Meteorologist Mace MichaelsAll Weather News
More
Flooding & Severe Storms Target the Southwest
A low pressure system coming across the Weste
23 Oct 2026 2:05 AM

Tropical Storm Vance Forms In The Pacific
Isaias ended the late-season streak of no hur
23 Oct 2026 2:00 AM

Warmer Than Average: Above-Normal Temperatures Across the Central U.S. This Week
WHAT TO EXPECTA ridge of high pressure will b
23 Oct 2026 1:45 AM


Several Fires Break Out in SoCal Last Week Amid Santa Ana Wind Event
Santa Ana winds helped several fires grow qui
19 Oct 2026 1:25 PM

Another Cold Morning Before Things Warm Back Up
Across portions of the Ohio Valley through th
19 Oct 2026 10:15 AM

Severe Risk Diminishing Saturday Morning for the Northeast
Severe Storm PotentialSevere risk is decreasi
16 Oct 2026 10:20 AM