Citizen Scientists Take to the Streets to Map the Hottest Places in Ten U.S. Cities
Special Stories
30 Jul 2019 1:50 AM
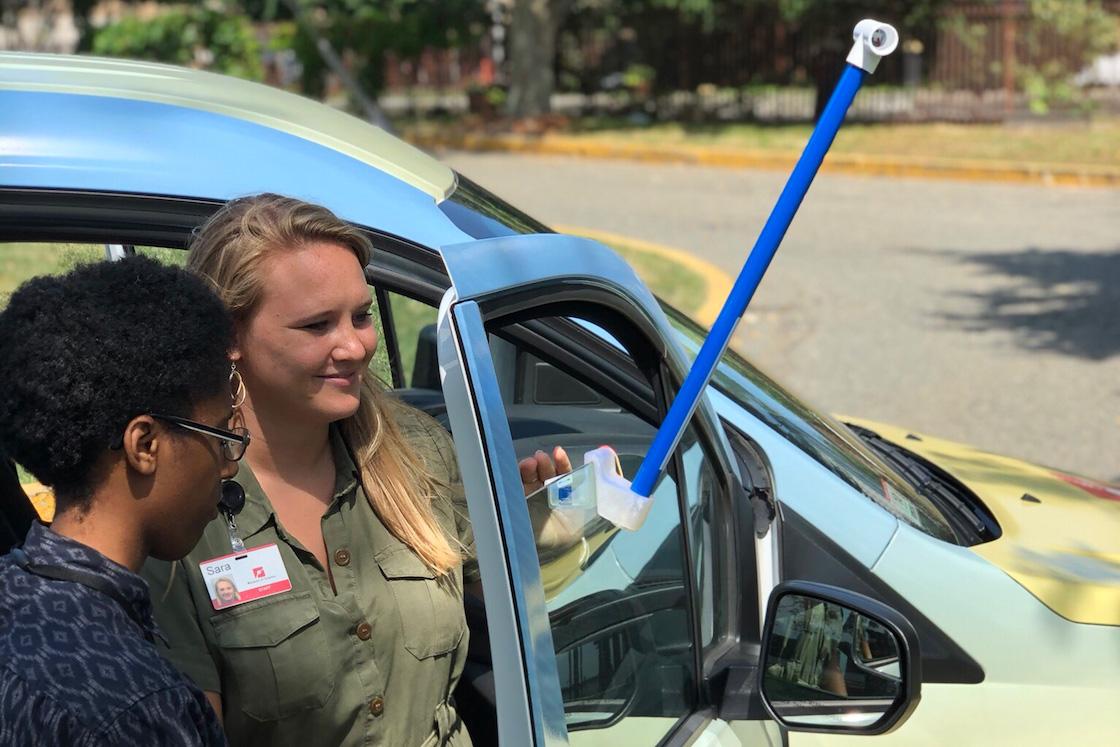
[Sara Benson (right) and Roxanne Lee, of the Boston Science Museum, using a CAPA Heat Strategies sensor to investigate the July 20 extreme heat in Boston, Brookline, and Cambridge, MA. Photo courtesy Boston Science Museum.]
[NOAA] Citizen scientists will take to the streets during the hottest days this summer to map hot spots in ten different U.S. cities. The campaign is part of a NOAA-funded project to map places where buildings, asphalt, and other parts of urban environments can amplify high temperatures, putting people at heightened risk of heat illness during extreme heat events.
With specially designed sensors mounted on their own cars, volunteers in each city will drive pre-planned routes three times on the appointed day — morning, afternoon, and evening — recording temperature, humidity, and their precise location every second. Overall, the drivers will collect more than 80,000 measurements across each city, enabling scientists to generate detailed heat maps that highlight the cities’ hot spots.
The 2019 effort will kick off with volunteer surveys in Boston, Cambridge, Brookline, and Worcester, Massachusetts. Later efforts will target Yonkers, New York; West Palm Beach, Fort Lauderdale, and Miami, Florida; Seattle and King County, Washington; and Honolulu, Hawaii. This follows heat-mapping campaigns in Richmond, Virginia, in 2017 and in Baltimore and Washington, D.C., in 2018.
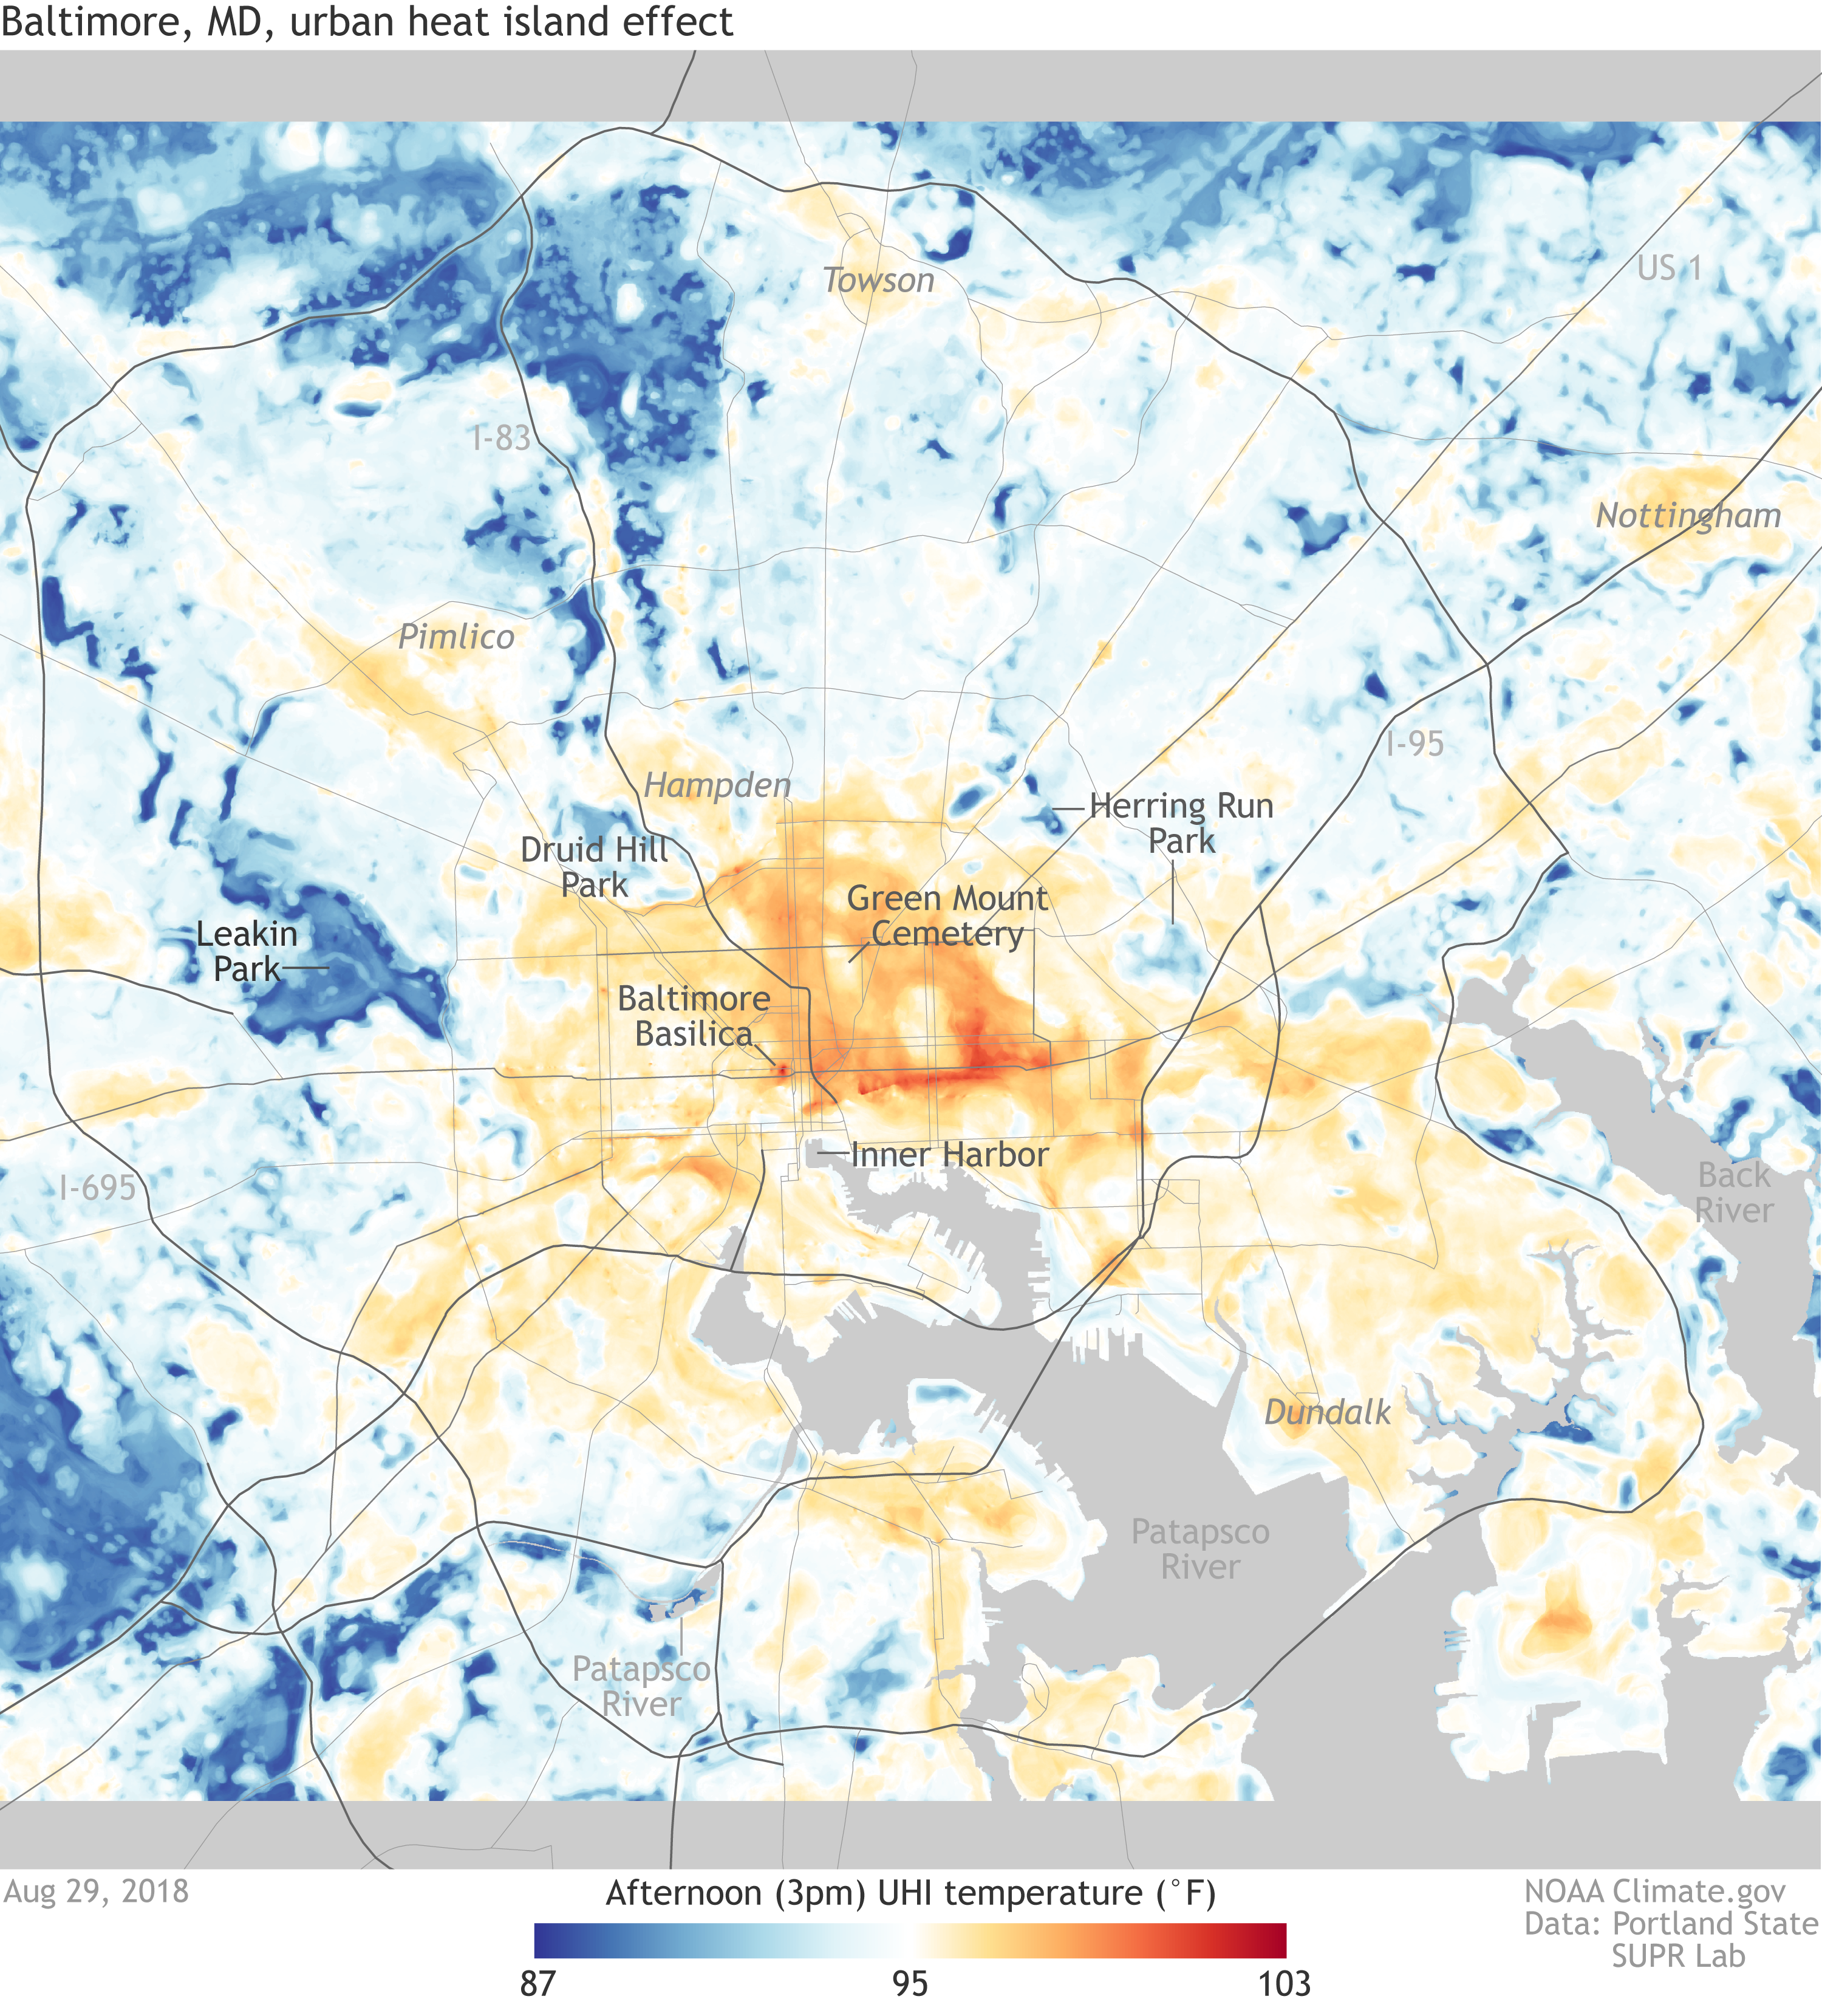 [Baltimore, Maryland temperature map. Cooler temperatures in shades of blue (coolest half of the day's temperature range) to red (warmest half). Temperature data from Portland State SUPR Lab.]
“Unshaded urban roads and buildings absorb heat during the day and radiate that heat into the surrounding air, increasing the local air temperature,” said Vivek Shandas, the campaign’s principal investigator and a professor of urban studies at Portland State University. “As a result, highly developed areas can experience much warmer temperatures — as much as 15-20 degrees Fahrenheit hotter — than nearby vegetated areas. Experts refer to this extreme temperature difference as the ‘urban heat island’.”
Detailed maps produced through these campaigns help city officials and community groups consider whether and where they can take action to protect people from extremely high temperatures. Communities can do a number of things to help keep people cool:
[Baltimore, Maryland temperature map. Cooler temperatures in shades of blue (coolest half of the day's temperature range) to red (warmest half). Temperature data from Portland State SUPR Lab.]
“Unshaded urban roads and buildings absorb heat during the day and radiate that heat into the surrounding air, increasing the local air temperature,” said Vivek Shandas, the campaign’s principal investigator and a professor of urban studies at Portland State University. “As a result, highly developed areas can experience much warmer temperatures — as much as 15-20 degrees Fahrenheit hotter — than nearby vegetated areas. Experts refer to this extreme temperature difference as the ‘urban heat island’.”
Detailed maps produced through these campaigns help city officials and community groups consider whether and where they can take action to protect people from extremely high temperatures. Communities can do a number of things to help keep people cool:
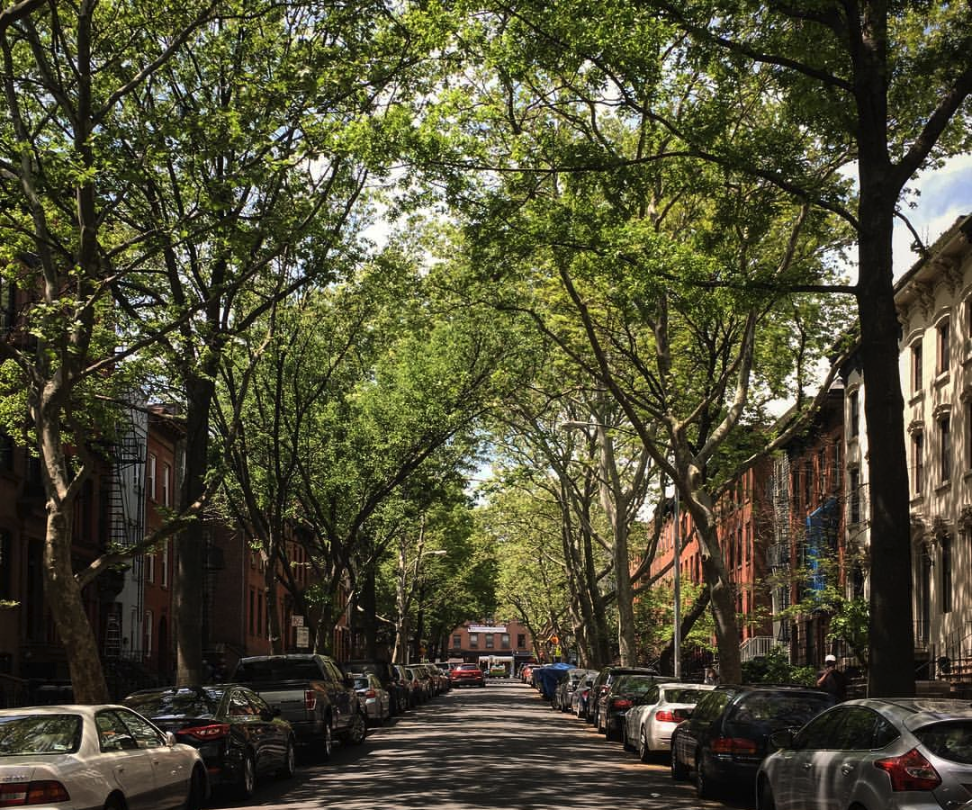 [Deep shade along a tree-lined street in Brooklyn, New York. Planting trees to provide shade, especially next to paved surfaces, helps to reduce the urban heat island effect. Image by smallchan, used under a Creative Commons license.]
City officials in Richmond, Baltimore, and D.C. are already using the maps from previous years’ citizen science campaigns in their long-term planning, said Jeremy Hoffman, Chief Scientist at the Science Museum of Virginia, who co-led these mapping projects.
Each city in the project has local champions who work with local governments and community institutions such as museums, science centers, environmental justice organizations, and nonprofits. The champions recruit and train volunteer participants and help them connect with city planners so they can take action based on the heat-mapping results. Equipment and training is provided by the “Heat Watch” program developed by CAPA Strategies, LLC, a climate consultancy founded by Shandas to prepare regions around the world for addressing extreme urban heat.
Shandas was the lead author of an article summarizing the findings from last year’s campaign in the journal Climate, titled “Integrating Satellite and Ground Measurements for Predicting Locations of Extreme Urban Heat.”
This year’s campaign is funded jointly by the participating cities, the Climate Resilience Fund, a non-profit granting organization, and NOAA’s Climate Program Office through its National Integrated Heat Health Information System and Communication, Education and Engagement programs. Weekly updates on the 2019 campaign will be made available on the NIHHIS website.
For WeatherNation: Meteorologist Mace Michaels
[Deep shade along a tree-lined street in Brooklyn, New York. Planting trees to provide shade, especially next to paved surfaces, helps to reduce the urban heat island effect. Image by smallchan, used under a Creative Commons license.]
City officials in Richmond, Baltimore, and D.C. are already using the maps from previous years’ citizen science campaigns in their long-term planning, said Jeremy Hoffman, Chief Scientist at the Science Museum of Virginia, who co-led these mapping projects.
Each city in the project has local champions who work with local governments and community institutions such as museums, science centers, environmental justice organizations, and nonprofits. The champions recruit and train volunteer participants and help them connect with city planners so they can take action based on the heat-mapping results. Equipment and training is provided by the “Heat Watch” program developed by CAPA Strategies, LLC, a climate consultancy founded by Shandas to prepare regions around the world for addressing extreme urban heat.
Shandas was the lead author of an article summarizing the findings from last year’s campaign in the journal Climate, titled “Integrating Satellite and Ground Measurements for Predicting Locations of Extreme Urban Heat.”
This year’s campaign is funded jointly by the participating cities, the Climate Resilience Fund, a non-profit granting organization, and NOAA’s Climate Program Office through its National Integrated Heat Health Information System and Communication, Education and Engagement programs. Weekly updates on the 2019 campaign will be made available on the NIHHIS website.
For WeatherNation: Meteorologist Mace Michaels
[Baltimore, Maryland temperature map. Cooler temperatures in shades of blue (coolest half of the day's temperature range) to red (warmest half). Temperature data from Portland State SUPR Lab.]
“Unshaded urban roads and buildings absorb heat during the day and radiate that heat into the surrounding air, increasing the local air temperature,” said Vivek Shandas, the campaign’s principal investigator and a professor of urban studies at Portland State University. “As a result, highly developed areas can experience much warmer temperatures — as much as 15-20 degrees Fahrenheit hotter — than nearby vegetated areas. Experts refer to this extreme temperature difference as the ‘urban heat island’.”
Detailed maps produced through these campaigns help city officials and community groups consider whether and where they can take action to protect people from extremely high temperatures. Communities can do a number of things to help keep people cool:
- plant trees along streets to make shade, especially over dark surfaces,
- add vegetation to urban spaces, including green roofs,
- whitewash roofs, roads, and parking lots (any large areas of black asphalt),
- provide more access to public air-conditioned spaces,
- vary the height of new buildings to increase airflow and create shade canyons,
- use more natural ventilation in buildings.
[Deep shade along a tree-lined street in Brooklyn, New York. Planting trees to provide shade, especially next to paved surfaces, helps to reduce the urban heat island effect. Image by smallchan, used under a Creative Commons license.]
City officials in Richmond, Baltimore, and D.C. are already using the maps from previous years’ citizen science campaigns in their long-term planning, said Jeremy Hoffman, Chief Scientist at the Science Museum of Virginia, who co-led these mapping projects.
Each city in the project has local champions who work with local governments and community institutions such as museums, science centers, environmental justice organizations, and nonprofits. The champions recruit and train volunteer participants and help them connect with city planners so they can take action based on the heat-mapping results. Equipment and training is provided by the “Heat Watch” program developed by CAPA Strategies, LLC, a climate consultancy founded by Shandas to prepare regions around the world for addressing extreme urban heat.
Shandas was the lead author of an article summarizing the findings from last year’s campaign in the journal Climate, titled “Integrating Satellite and Ground Measurements for Predicting Locations of Extreme Urban Heat.”
This year’s campaign is funded jointly by the participating cities, the Climate Resilience Fund, a non-profit granting organization, and NOAA’s Climate Program Office through its National Integrated Heat Health Information System and Communication, Education and Engagement programs. Weekly updates on the 2019 campaign will be made available on the NIHHIS website.
For WeatherNation: Meteorologist Mace MichaelsAll Weather News
More

Severe Storms Target the Midwest to the Northeast This Week
Extreme heat will be a big story this week ac
27 Jul 2026 1:50 AM


Tropics: Fausto Heads to Hawaii; Genevieve Rapidly Intensifying
Atlantic BasinBertha has dissipated after mov
27 Jul 2026 1:40 AM

Southeast Flood Risk Lingers Near Stalled Front
A stalled boundary over the Southeast will ke
25 Jul 2026 10:55 AM

Another Round of Storms Targets the Northeast
Tuesday brought severe weather again across p
23 Jul 2026 1:15 AM

Another Round of Severe Weather for the Upper Midwest and Great Lakes
The upper-level low train continues to keep t
21 Jul 2026 1:45 AM