Eight Cities for Urban Heat Island Mapping This Summer

news image
Special Stories
26 Jun 2019 3:26 AM
[A youth volunteer from groundwork in Richmond, VA during the 2018 urban heat island campaign attaching a sensor unit onto a car.] [NOAA] With support from the National Integrated Heat Health Information System (NIHHIS) and CPO’s Communication, Education, and Engagement Division, community organizers in eight U.S. cities are preparing to run citizen-science campaigns to map Urban Heat Islands (UHI) this summer. Cities were selected for support based in part on their readiness to mobilize community members to run the mapping campaign and on their ability and willingness to use the heat maps produced by the campaign to build resilience to extreme heat. The group is also engaging NWS personnel, NIHHIS collaborators, and Weather Ready Nation Ambassadors in each city to help identify high-heat target dates and publicize the campaigns.

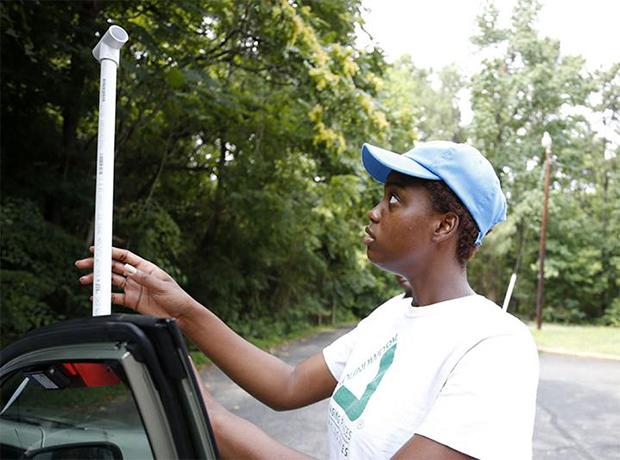
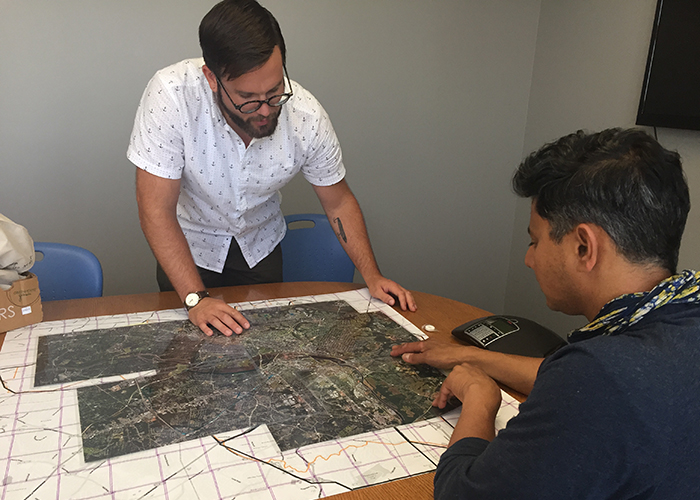
[Jeremy Hoffman, a climate and earth scientist at the Science Museum of Virginia, left, and Vivek Shandas, a professor of urban studies and planning at Portland State University, design the routes that citizen scientists will take to collect heat data for mapping Richmond’s heat islands last summer. Photo courtesy of Jeremy Hoffman via NOAA]

Cities that have been offered support for UHI mapping campaigns for 2019 are: Boston and Worcester, Massachusetts; West Palm Beach, Ft. Lauderdale, and Miami, Florida; Yonkers, New York; Seattle, Washington; and Honolulu, Hawaii. Additional cities are in the planning stages, preparing to run campaigns in 2020; organizers from these cities have been invited to participate in events that occur this summer.

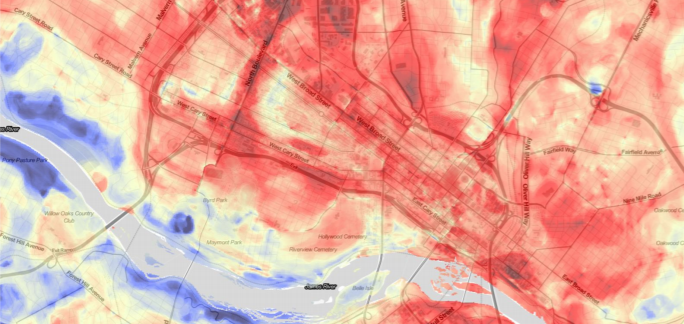
[Map from Richmond, VA, urban heat island study last summer. Red shows hotter areas and blue shows cooler areas. From NOAA]

Working with equipment, methodology, and collaborators from CAPA Strategies and the Science Museum of Virginia, participating cities will mobilize community members to drive pre-selected routes through their cities three times per day, collecting temperatures and GPS locations every second. The image above shows a color-coded path along one driver’s route in Richmond, Virginia. Collaborators will process the gathered data to produce high-resolution maps of temperature in the morning, afternoon, and evening across each city. Community groups that participate in the campaign will use the maps to promote resilience-building actions.

In the past few years, similar successful campaigns were produced in Washington D.C., Baltimore, and Richmond, VA.

All Weather News
More
Storms Slide Down the Plains

Storms Slide Down the Plains

CENTRAL U.S - A trough that came in from the

18 Sep 2025 1:20 AM
Fall Color Starting To Show in Parts of the Lower 48

Fall Color Starting To Show in Parts of the Lower 48

Grab the pumpkin spice and apple cider donuts

18 Sep 2025 1:15 AM
Eastern Pacific: Mario Fizzles, but Sends Moisture to California

Eastern Pacific: Mario Fizzles, but Sends Moisture to California

While the Atlantic has been relatively quiet

18 Sep 2025 12:50 AM
ATLANTIC: Gabrielle Forms in the Atlantic

ATLANTIC: Gabrielle Forms in the Atlantic

We are now a week after the climatological pe

18 Sep 2025 12:25 AM
Florida Rainfall: Nuisance or Beneficial?

Florida Rainfall: Nuisance or Beneficial?

The dry time has been a little hard to enjoy

18 Sep 2025 12:25 AM
Northern Lights Close Out the Weekend For Many

Northern Lights Close Out the Weekend For Many

Did you see them? Many might have had better

15 Sep 2025 10:30 PM
Severe Storms Look More Likely This Afternoon

Severe Storms Look More Likely This Afternoon

A strong upper-level trough along with monsoo

14 Sep 2025 7:30 PM