Eye-Catching Climatology: Examining Hurricane Eye Location and Size
Special Stories
30 May 2018 7:01 AM
From NOAA
Tropical cyclones are one of the most dangerous weather events on Earth, but at their core lies a paradox—an area of clear skies and calm winds called the eye. The eye is surrounded by an eyewall, which is composed of towering clouds, intense severe weather, and the storm’s strongest winds. The more defined a cyclone’s eye and eyewall, the greater the intensity of the storm. So, determining when, where, and how often eyes occur is imperative for understanding how these storms are changing over time.
To determine how often eyes occur, where they occur most frequently, and how their size varies, NCEI scientist Ken Knapp and his colleagues at the Cooperative Institute for Meteorological Satellite Studies developed a global climatology of tropical cyclone eyes, which is described in a paper recently published in Monthly Weather Review.
 Tropical cyclone eyes were much more frequent in the Northern Hemisphere, but eyes in the Southern Hemisphere were typically larger than their northern counterparts. Eyes were seen in approximately:
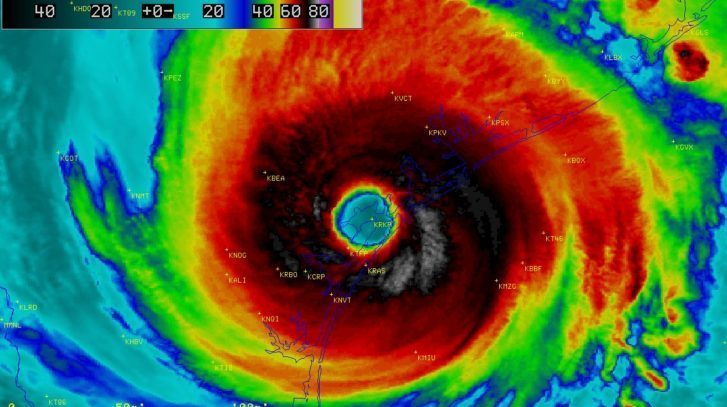 [The distinct eye of Hurricane Harvey from August, 2017]
Known as the Automated Rotational Center Hurricane Eye Retrieval or the ARCHER algorithm, this program helped the scientists identify the probability of an eye being present and allowed them to easily calculate:
[The distinct eye of Hurricane Harvey from August, 2017]
Known as the Automated Rotational Center Hurricane Eye Retrieval or the ARCHER algorithm, this program helped the scientists identify the probability of an eye being present and allowed them to easily calculate:
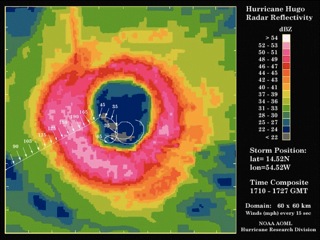 [The eye of Hurricane Hugo from NOAA 42 radar display on September 15, 1989]
Edited for WeatherNation by Meteorologist Mace Michaels
[The eye of Hurricane Hugo from NOAA 42 radar display on September 15, 1989]
Edited for WeatherNation by Meteorologist Mace Michaels
What can a climatology of tropical cyclone eyes tell us?
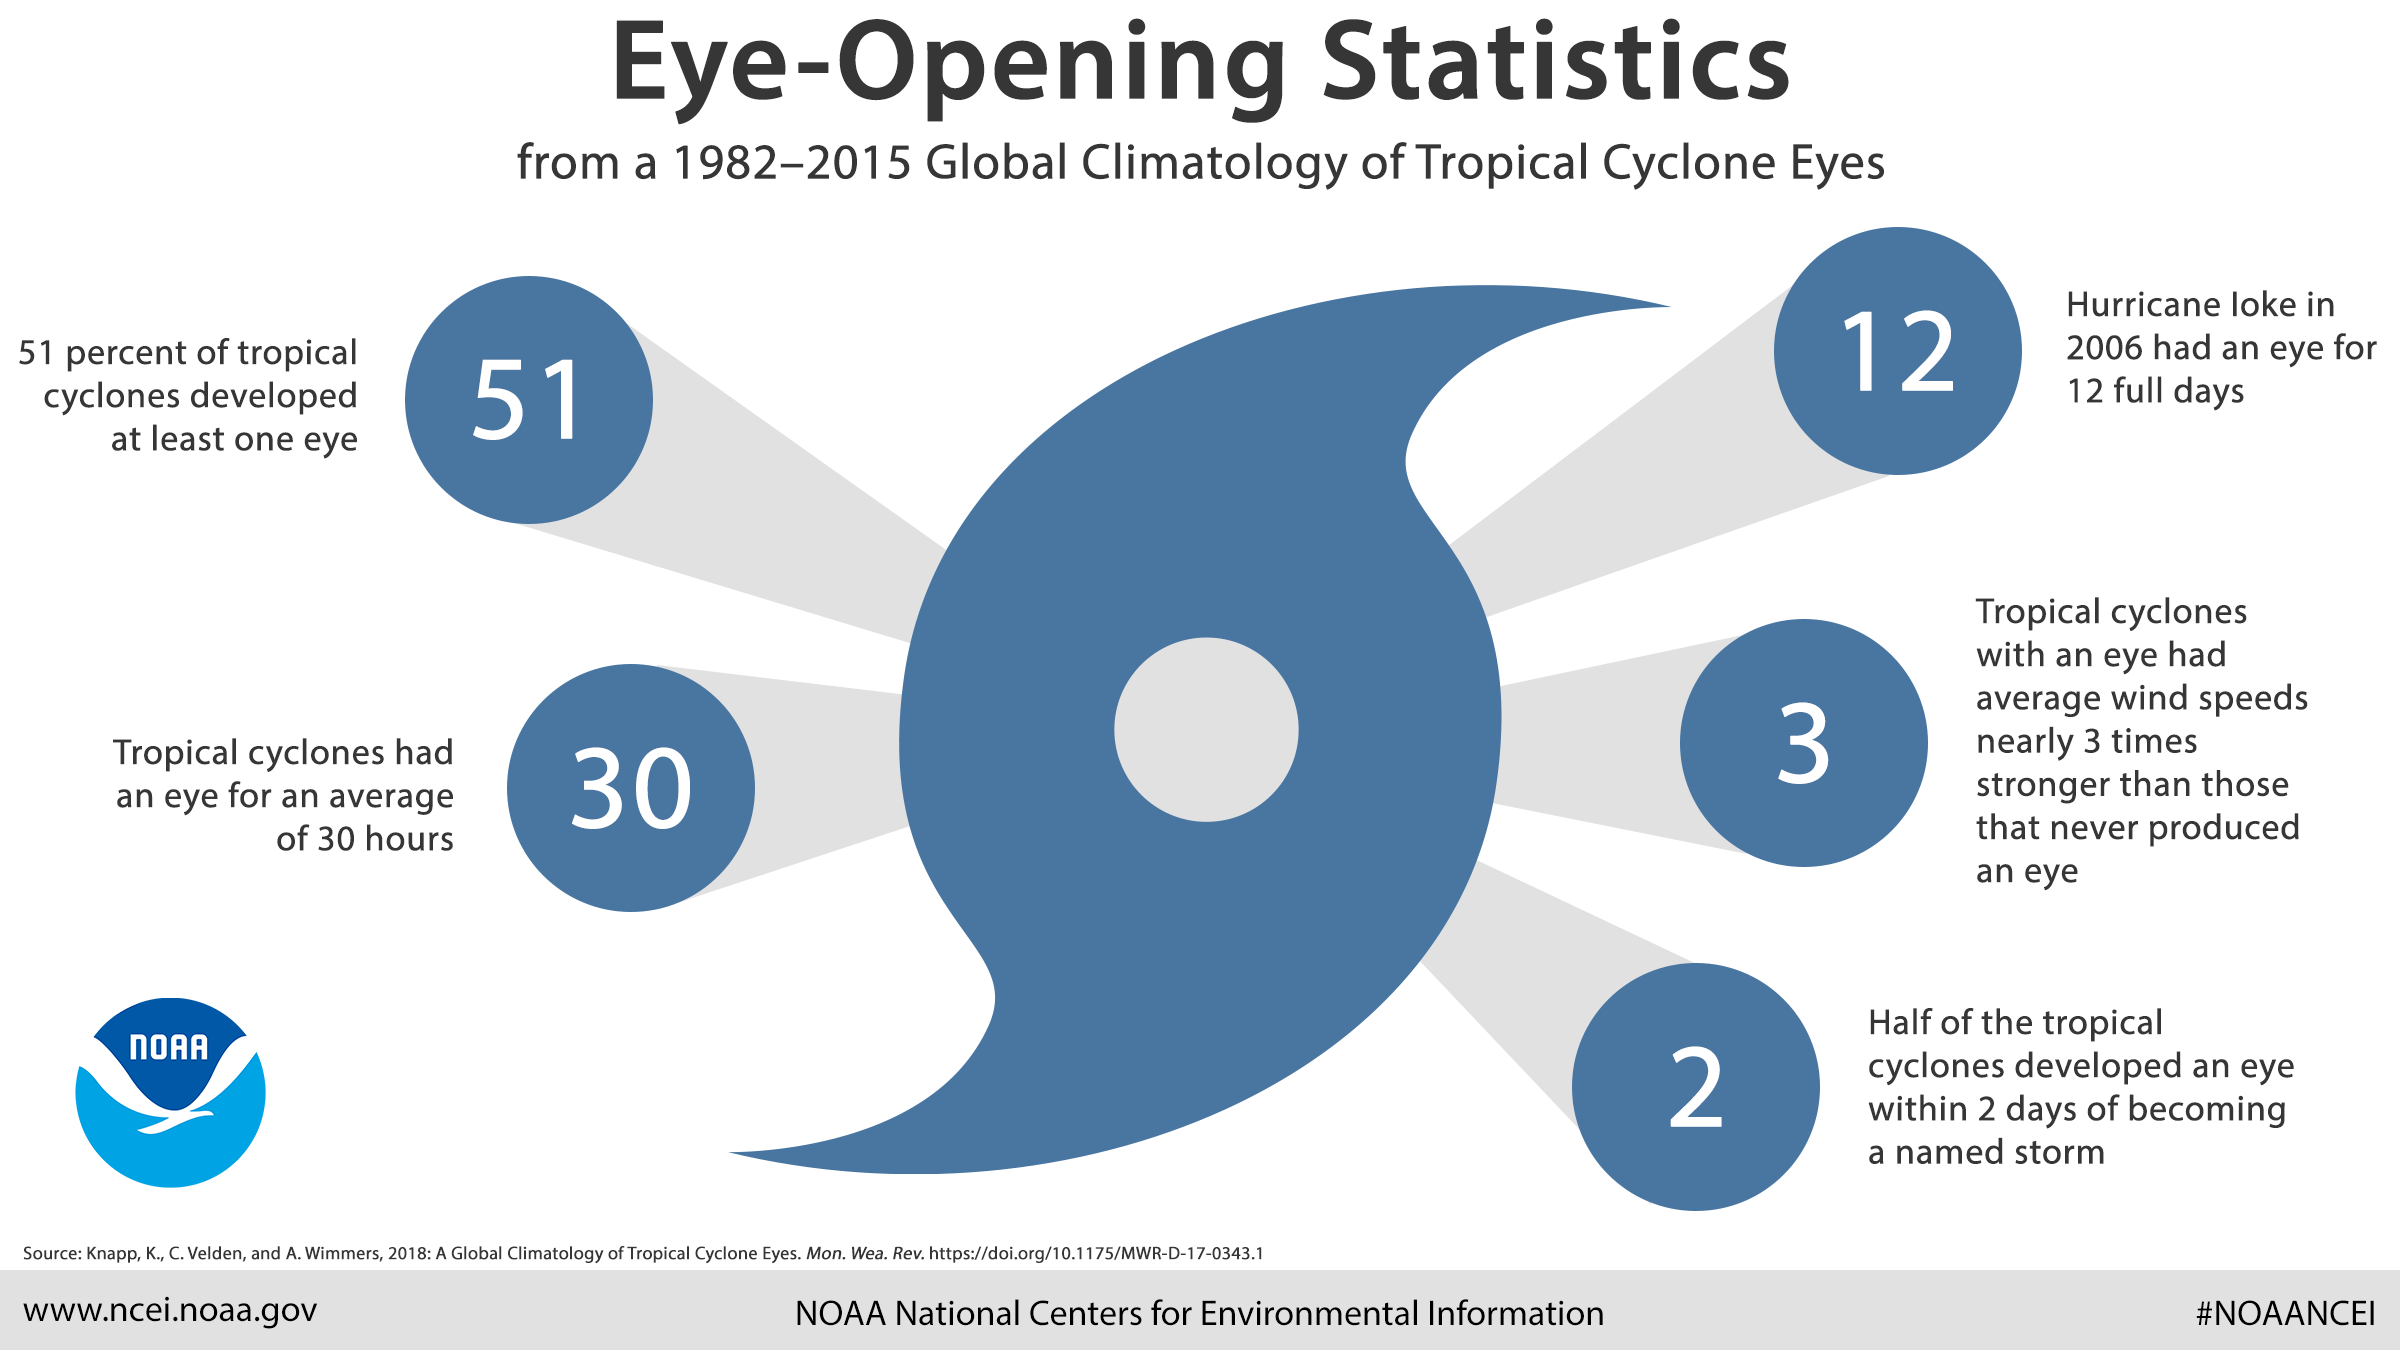
This 34-year climatology showed that more than half of the tropical cyclones occurring between 1982 and 2015 developed at least one eye. On average, the eye storms had an eye for at least 30 hours, and 50 percent of the systems developed their first eye within two days of becoming a named storm. Hurricane Ioke in 2006 had an eye for the longest period of time at 12 complete days. And, storms with an eye had average wind speeds nearly three times stronger than those that never produced an eye.
Tropical cyclone eyes were much more frequent in the Northern Hemisphere, but eyes in the Southern Hemisphere were typically larger than their northern counterparts. Eyes were seen in approximately:
- 66 percent of Western Pacific storms
- 52 percent of Eastern Pacific storms
- 46 percent of Northern Indian Ocean storms
- 43 percent of Southern Indian Ocean storms
- 41 percent of North Atlantic storms
- 40 percent of Southern Pacific storms
How was this climatology developed?
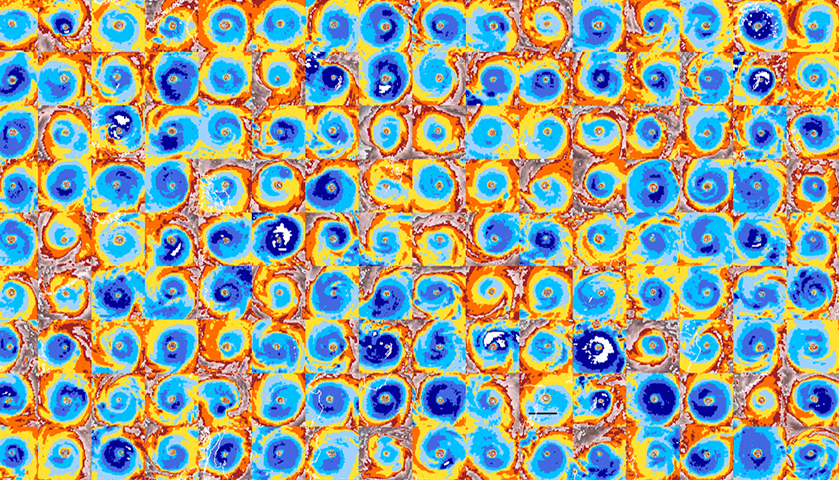
To develop this climatology, the scientists used a computer algorithm to examine over a quarter million individual infrared satellite images from the global Hurricane Satellite (HURSAT) dataset. The HURSAT dataset provides geostationary satellite images of tropical cyclones in the International Best Track Archive for Climate Stewardship (IBTrACS) every three hours.
[The distinct eye of Hurricane Harvey from August, 2017]
Known as the Automated Rotational Center Hurricane Eye Retrieval or the ARCHER algorithm, this program helped the scientists identify the probability of an eye being present and allowed them to easily calculate:
- The location of the low pressure center
- The probability that a given image has an eye
- The width of the eye and eyewall clouds
- The percent of the eye that the eyewall encompasses
What’s next for this climatology?
While this climatology provides important insights into tropical cyclones and their history, it is not without its limitations. In the future, the scientists hope to incorporate additional satellite data from different instruments into the climatology to produce a consensus eye product. Additionally, they plan to study this new climatology alongside the HURSAT data to better understand how the structure and intensity of a tropical cyclone change over a storm’s duration.
[The eye of Hurricane Hugo from NOAA 42 radar display on September 15, 1989]
Edited for WeatherNation by Meteorologist Mace MichaelsAll Weather News
More
Wildfire Outbreak in the Pacific Northwest
SPOKANE, WA - On Saturday, August 1st, the Ol
3 Aug 2026 1:55 AM

More Storms for the East Through Monday
A low-pressure system that moved through the
3 Aug 2026 1:50 AM


After Reaching Category 5, Genevieve Weakens in the Pacific
PacificGenevieve formed last Friday south of
3 Aug 2026 12:30 AM

Flooding, Severe Storms Target the Midwest Again
After an active week of storms across the nor
1 Aug 2026 1:40 AM

Flooding Risk Increases as Heavy Rain Targets the Tri-State Area
Tuesday, heavy rainfall moved across the Nort
30 Jul 2026 12:25 AM

Severe Weather: Energy From the Midwest Now in the Southeast
UPPER MIDWEST - Through Monday, dangerous tor
29 Jul 2026 10:30 PM