Hot Days in the City? It’s All about Exact Location
A similar pattern took place in D.C. a day earlier when temperatures soared to 102 degrees F in several neighborhoods, while other parts of the city were 17 degrees cooler.
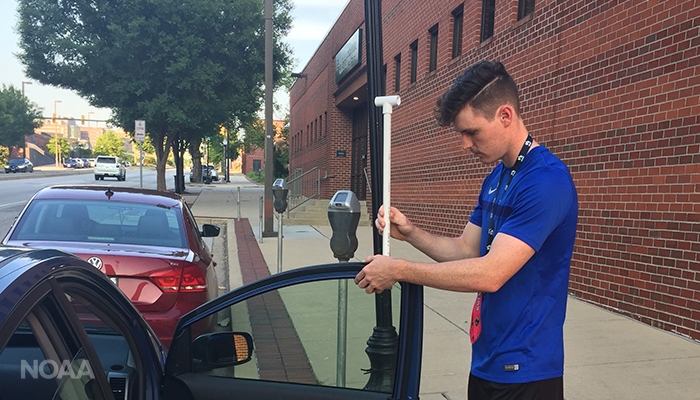
[Luke Hanno, a high school senior from Bowie, Maryland, and citizen scientist mounts a special temperature sensor on his car just prior to driving his assigned route in Baltimore on Aug. 29, 2018. (David Herring/NOAA)]
The detailed maps are the result of a NOAA-funded project to map urban heat islands – the places where people are most at risk during extreme heat. A corps of 25 volunteers drove along designated routes through each city on two consecutive days to collect temperature data using specially designed thermal sensors mounted on their own cars.
Vivek Shandas of Portland State University and Jeremy Hoffman of the Science Museum of Virginia then used these data to create detailed maps of the hottest and coolest places in both cities.
Asphalt and concrete amplify heat The map of DC shows that some of the hottest places on the afternoon of August 28 included the neighborhoods of Queens Chapel, Michigan Park and Bloomingdale in the Northeast. In Baltimore, sampled on August 29, the highest temperatures were recorded in the Penn Fallsway, Middle East and Milton-Montford neighborhoods.
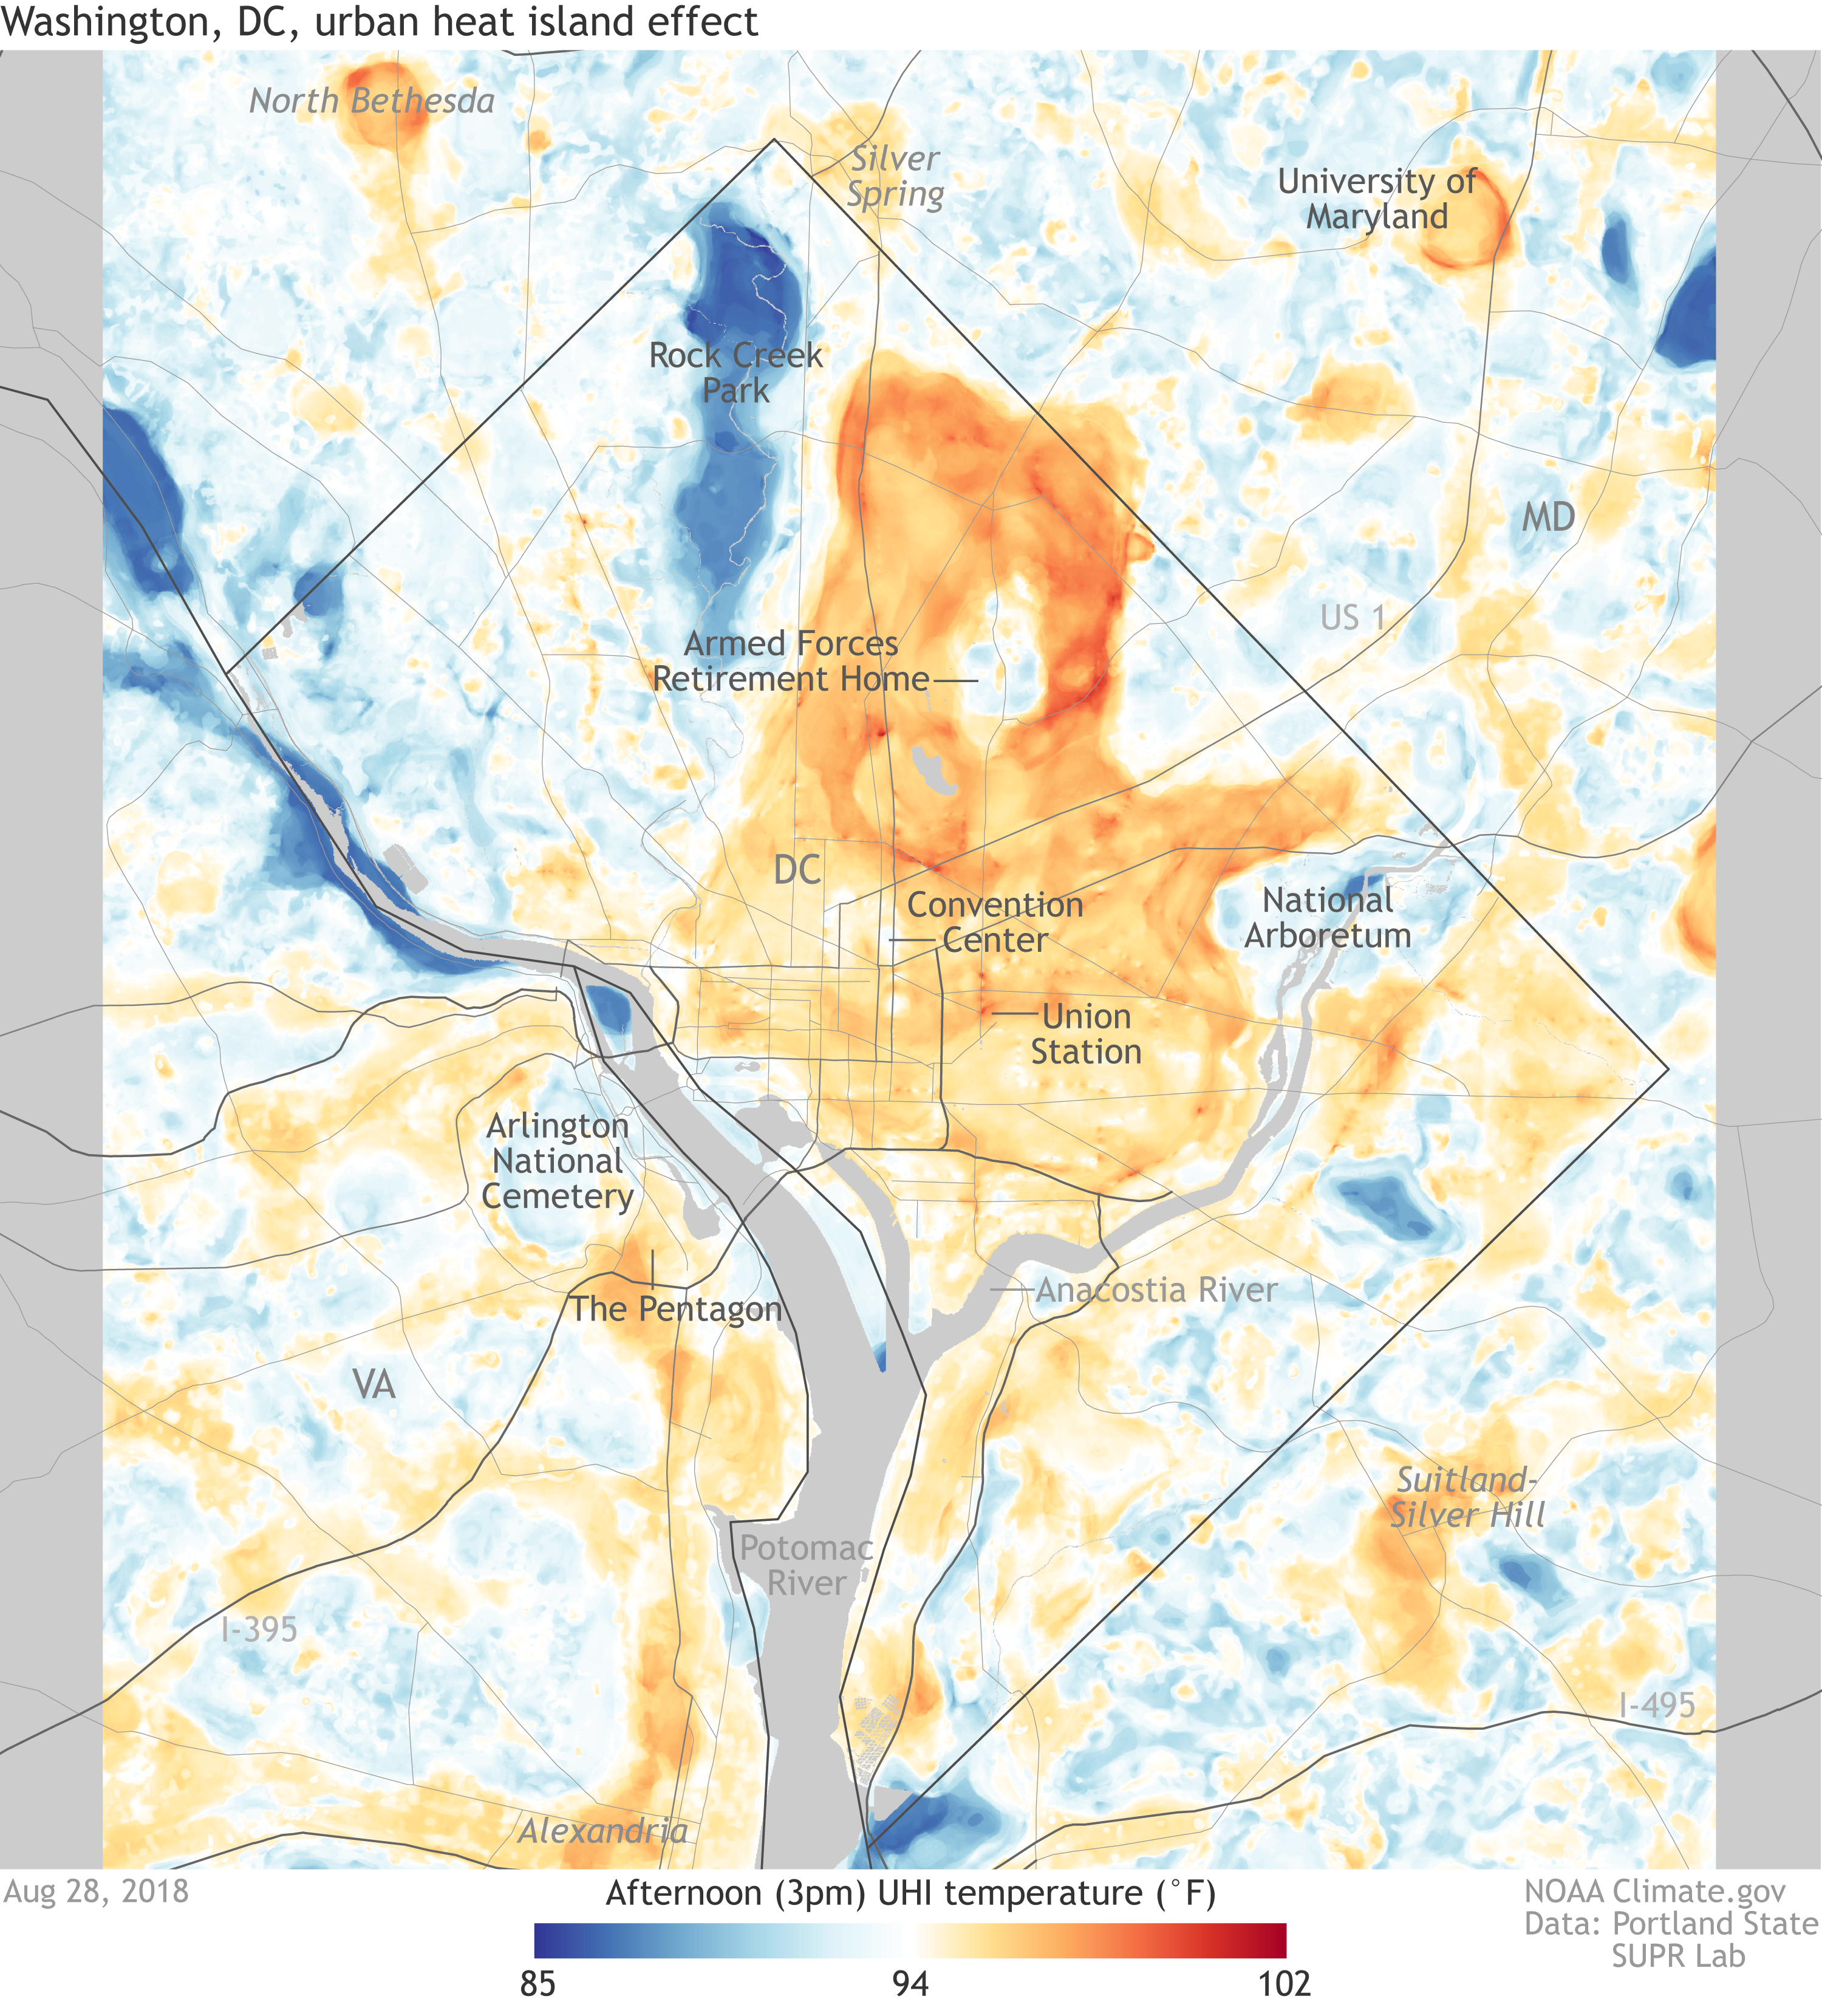
[This Washington, D.C. map reveals a range of temperatures on the afternoon of Aug. 28, 2018, from a low of 85 degrees F to a high of 102 degrees F. (NOAA Climate / Portland State University)]
“Major roadways and dense urban pockets are some of the warmest landscapes in both cities,” said Hoffman. “These are areas with little or no vegetation, more asphalt and concrete buildings, which can amplify a heat wave.”
In contrast, neighborhoods near large, tree-filled parks were among the coolest places, including areas around Rock Creek Parkway and the National Arboretum in D.C. and Herring Run Park and Druid Hill Park in Baltimore.
NOAA and its partners are sharing the maps and data with officials in Washington, D.C., and Baltimore who have expressed interest in using them to help plan cooling strategies and inform resiliency plans.
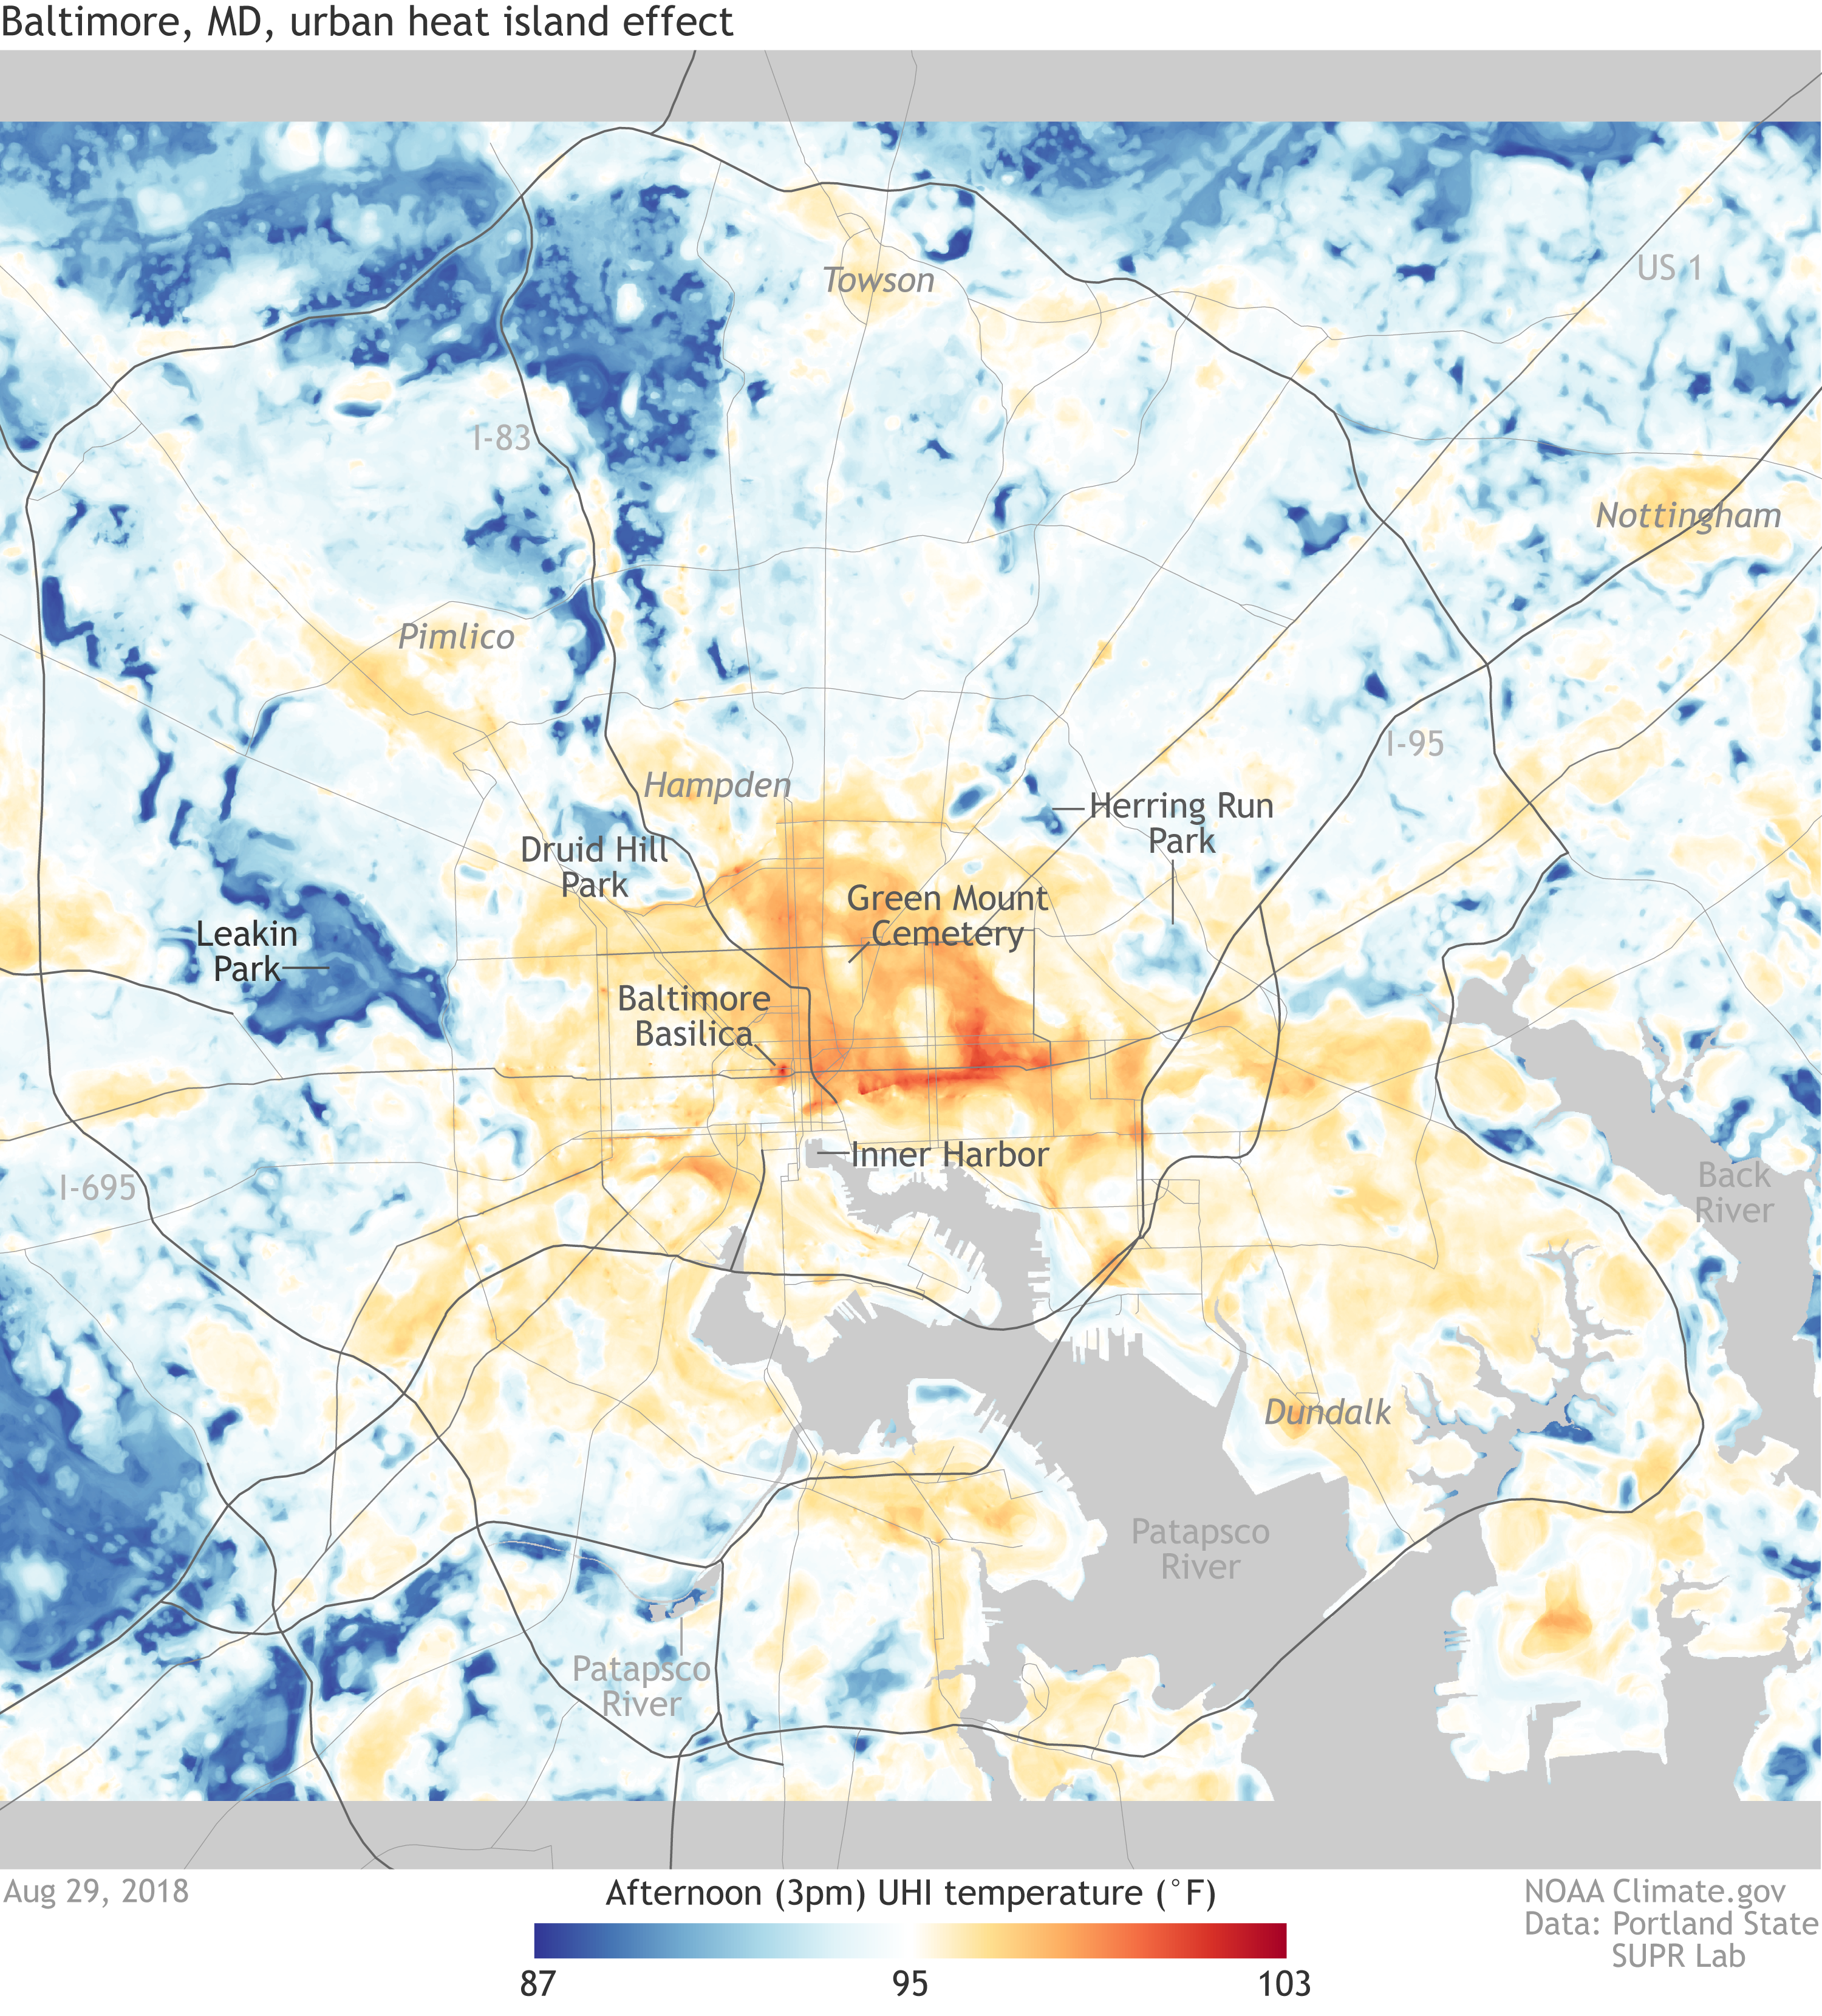
[This map shows the hottest and coolest places in Baltimore on Aug. 29, 2018. Temperatures ranged from more than 103 degrees F to 87 degrees F. (NOAA Climate / Portland State University)]
Sheila McMenamin, a volunteer who collected heat data, is excited to have the maps to help with her work as director of programs for the Baltimore Tree Trust. "Heat islands are a serious public health issue, and this data shows a clear connection between areas of our city lacking tree canopy and the extreme pockets of heat that residents are enduring over the summer months. The maps will help us continue to work within the community to champion the accessibility, growth, and maintenance of our city's green spaces."
“The citizen scientists did a remarkable job collecting data in both cities,” said Shandas. “Other cities can work with us, using the same methods to engage citizen volunteers and community organizations to map their cities’ heat islands. These maps can then inform a range of strategies to make communities more resilient to climate warming.”
Edited for WeatherNation by Meteorologist Mace Michaels


