Hurricane Harvey Provides Lessons Learned For Flood Resiliency Plans
Special Stories
4 Jun 2019 7:19 PM
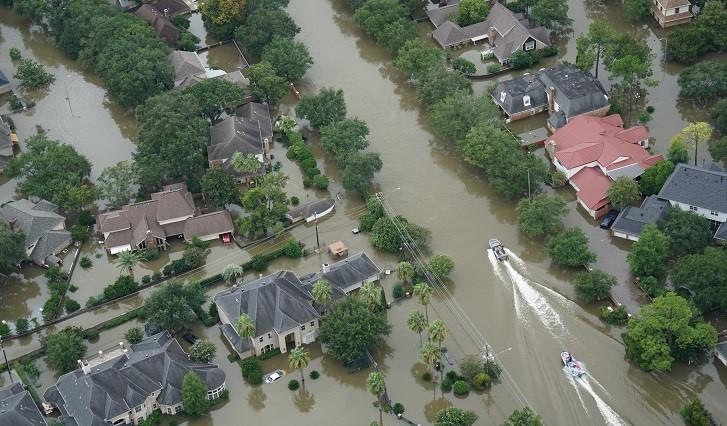
[People pilot boats down flooded streets in the aftermath of Hurricane Harvey. Courtesy istockphoto via ASU]
[Arizona State University] Hurricane Harvey made landfall on Aug. 25, 2017, then stalled over Texas for three days as a tropical storm. The Category 4 storm claimed 80 lives, displaced multitudes of people and damaged more than 80,000 homes.
Arizona State University researcher Manoochehr Shirzaei of the School of Earth and Space Exploration and former graduate student and lead author Megan Miller (now a postdoctoral researcher at the Jet Propulsion Laboratory, California Institute of Technology) used satellite data to map the Houston-Galveston area impacted by Hurricane Harvey to understand why the flooding was so severe and widespread. The results of their study have been recently published in the journal Remote Sensing of Environment.
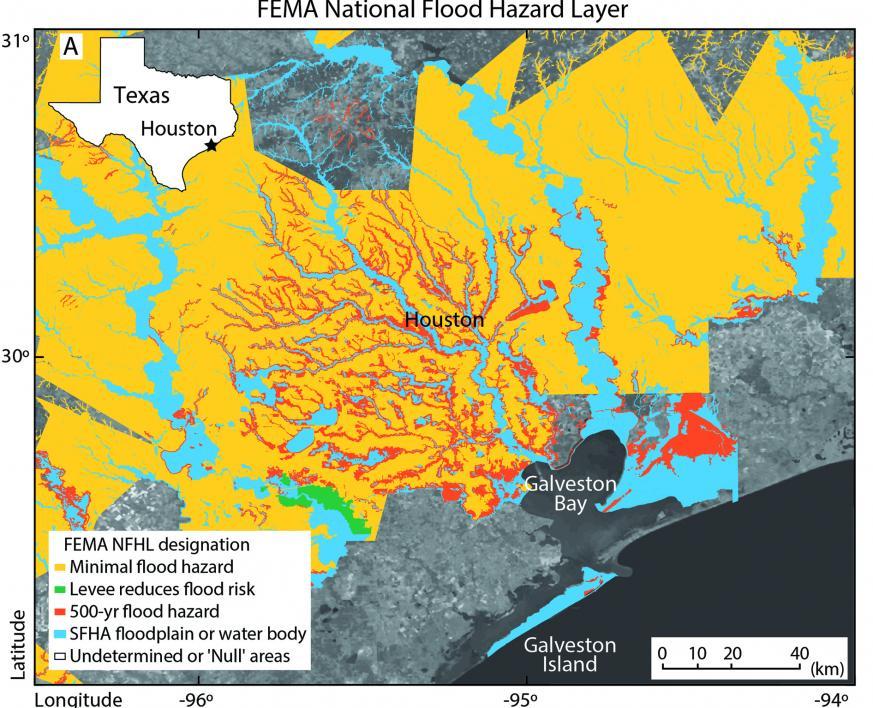 [Flood risk classifications provided by National Flood Hazard Layer for the Houston-Galveston area displayed over greyscale Landsat7 Global Imagery Mosaic. Image by Megan Miller]
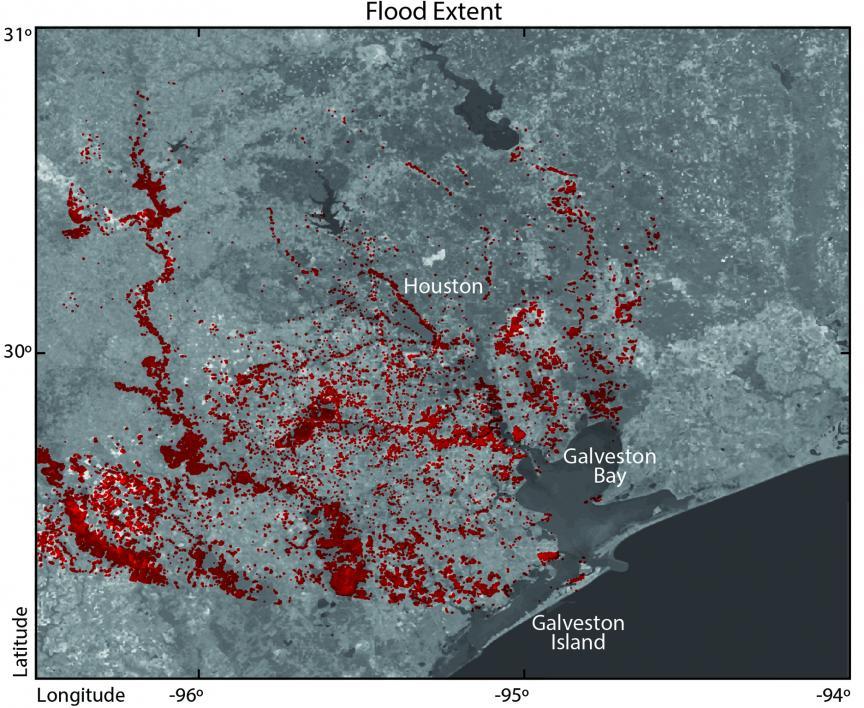 [Red markers indicate inundation and standing water at 9:40 Central Daylight Time (14:40 Universal Coordinated Time) on Aug. 30, 2017, which is detected using Sentinel-1A/B SAR backscattering intensity change detection. Image by Megan Miller]
“Earth-orbiting radar satellites provide us with an opportunity to map areas when other techniques fail due to cloud coverage and lack of ground access to the area of the disaster,” Miller said.
In analyzing the satellite data, Miller and Shirzaei were surprised to see that large flooded areas fell outside the Federal Emergency Management Agency (FEMA) designated 500-year flood zones. “This highlights the need for revising both flood hazard zone maps and flood resilience plans in coastal regions,” Shirzaei said.
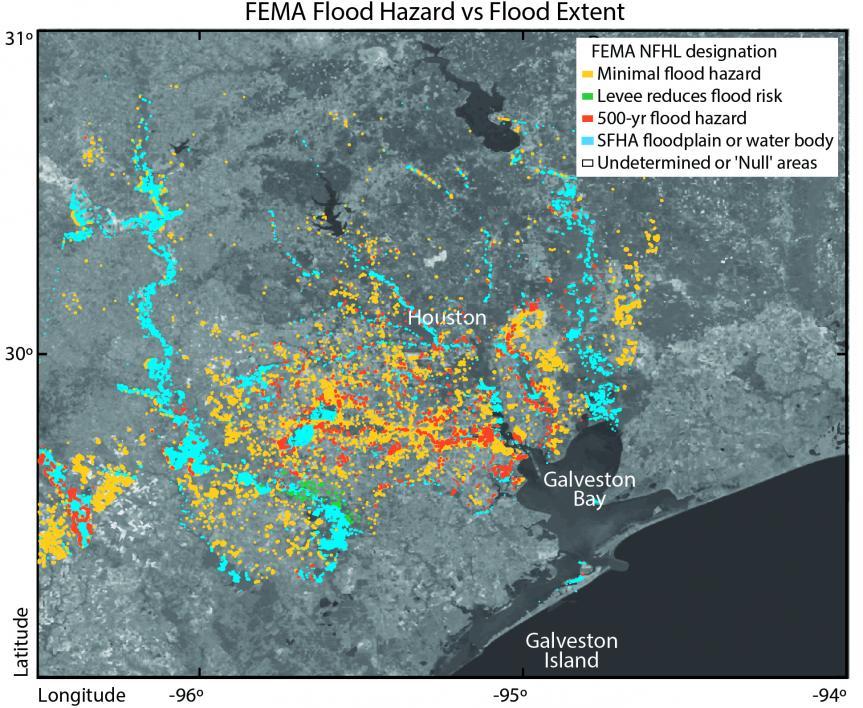
Through this analysis, they found land subsidence in the Houston-Galveston area of more than 0.19 inches (5 millimeters) per year in 85% of the flooded area. The likely causes of subsidence include compaction of sediments, groundwater extraction and hydrocarbon production.
[Red markers indicate inundation and standing water at 9:40 Central Daylight Time (14:40 Universal Coordinated Time) on Aug. 30, 2017, which is detected using Sentinel-1A/B SAR backscattering intensity change detection. Image by Megan Miller]
“Earth-orbiting radar satellites provide us with an opportunity to map areas when other techniques fail due to cloud coverage and lack of ground access to the area of the disaster,” Miller said.
In analyzing the satellite data, Miller and Shirzaei were surprised to see that large flooded areas fell outside the Federal Emergency Management Agency (FEMA) designated 500-year flood zones. “This highlights the need for revising both flood hazard zone maps and flood resilience plans in coastal regions,” Shirzaei said.
Through this analysis, they found land subsidence in the Houston-Galveston area of more than 0.19 inches (5 millimeters) per year in 85% of the flooded area. The likely causes of subsidence include compaction of sediments, groundwater extraction and hydrocarbon production.
 [Red markers indicate inundation and standing water at 9:40 Central Daylight Time (14:40 Universal Coordinated Time) on Aug. 30, 2017, which is detected using Sentinel-1A/B SAR backscattering intensity change detection. Image by Megan Miller]
They concluded that the area’s subsidence affected flood severity by modifying base flood elevations and topographic gradients. “Ongoing land subsidence across the Houston area possibly lowered the flood control structures and changed floodplain boundaries and base flood drainage, which further intensified flooding,” Shirzaei said.
[Red markers indicate inundation and standing water at 9:40 Central Daylight Time (14:40 Universal Coordinated Time) on Aug. 30, 2017, which is detected using Sentinel-1A/B SAR backscattering intensity change detection. Image by Megan Miller]
They concluded that the area’s subsidence affected flood severity by modifying base flood elevations and topographic gradients. “Ongoing land subsidence across the Houston area possibly lowered the flood control structures and changed floodplain boundaries and base flood drainage, which further intensified flooding,” Shirzaei said.
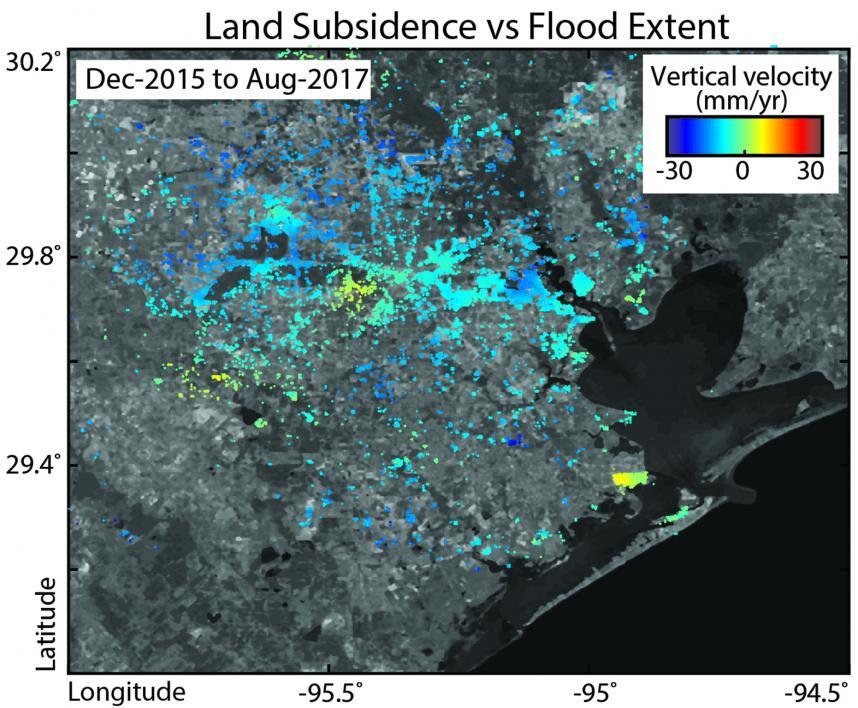 [Colored pixels identify areas inundated with standing water on Aug. 30, 2017 at 9:40 Central Daylight Time (14:40 Universal Coordinated Time) which is detected using Sentinel-1A/B SAR backscattering intensity change detection. The hue represents subsidence rates calculated from multitemporal SAR interferometric analysis of Sentinel-1A/B. Image by Megan Miller]
Also, land subsidence lowers coastal lands and makes them more vulnerable to flooding due to sea level rise and storm surges.
“The lessons learned from the floods following Hurricane Harvey highlight the major shortcomings of current flood resilience plans,” Shirzaei said. “We encourage stakeholders and regulators to use these findings to update hazard maps and improve flood resiliency plans accordingly to decide what precautionary measures are needed for their communities.”
On the horizon, Shirzaei and his research team are using the same satellite data techniques used in this study to focus on the spring 2019 flooding that has devastated the Midwestern states. They will be looking specifically at the impact of flooding on agriculture crop health and the local population. They hope to be able to provide recommendations on updating maps and resiliency plans to help these areas in the future.
[Colored pixels identify areas inundated with standing water on Aug. 30, 2017 at 9:40 Central Daylight Time (14:40 Universal Coordinated Time) which is detected using Sentinel-1A/B SAR backscattering intensity change detection. The hue represents subsidence rates calculated from multitemporal SAR interferometric analysis of Sentinel-1A/B. Image by Megan Miller]
Also, land subsidence lowers coastal lands and makes them more vulnerable to flooding due to sea level rise and storm surges.
“The lessons learned from the floods following Hurricane Harvey highlight the major shortcomings of current flood resilience plans,” Shirzaei said. “We encourage stakeholders and regulators to use these findings to update hazard maps and improve flood resiliency plans accordingly to decide what precautionary measures are needed for their communities.”
On the horizon, Shirzaei and his research team are using the same satellite data techniques used in this study to focus on the spring 2019 flooding that has devastated the Midwestern states. They will be looking specifically at the impact of flooding on agriculture crop health and the local population. They hope to be able to provide recommendations on updating maps and resiliency plans to help these areas in the future.
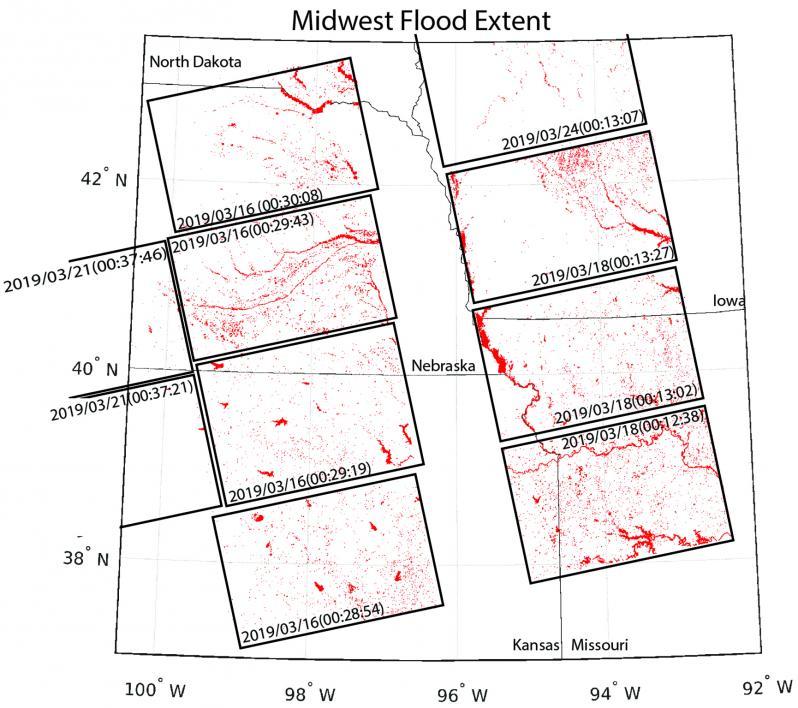 [Red markers indicate snapshots of inundation area and standing water within the Midwest as detected using Sentinel-1A/B SAR backscattering intensity change detection at dates and UTC times mentioned within each SAR frame, shown with black rectangles. Image by Manoochehr Shirzaei]
Edited for WeatherNation by Meteorologist Mace Michaels
[Red markers indicate snapshots of inundation area and standing water within the Midwest as detected using Sentinel-1A/B SAR backscattering intensity change detection at dates and UTC times mentioned within each SAR frame, shown with black rectangles. Image by Manoochehr Shirzaei]
Edited for WeatherNation by Meteorologist Mace Michaels
[Flood risk classifications provided by National Flood Hazard Layer for the Houston-Galveston area displayed over greyscale Landsat7 Global Imagery Mosaic. Image by Megan Miller]
Mapping Eastern Texas with satellites and radar
For their study, Miller and Shirzaei mapped the Eastern Texas area of Houston-Galveston impacted by Hurricane Harvey using satellite radar data collected from the European Space Agency’s Sentinel-1 A/B satellites and Japan Aerospace Exploration Agency’s Advanced Land Observing Satellite. From this data, Miller and Shirzaei then compiled a snapshot of the extent of standing water in the area following the hurricane. They also measured land subsidence (how much the land surface moves downward) for the area before the storm using space-borne Interferometric Synthetic Aperture Radar, a radar technique used to generate maps of surface deformation using differences in the phase of the waves returning to the satellite. The technique can measure millimeter-scale changes in deformation over spans of days to years.
[Red markers indicate inundation and standing water at 9:40 Central Daylight Time (14:40 Universal Coordinated Time) on Aug. 30, 2017, which is detected using Sentinel-1A/B SAR backscattering intensity change detection. Image by Megan Miller]
“Earth-orbiting radar satellites provide us with an opportunity to map areas when other techniques fail due to cloud coverage and lack of ground access to the area of the disaster,” Miller said.
In analyzing the satellite data, Miller and Shirzaei were surprised to see that large flooded areas fell outside the Federal Emergency Management Agency (FEMA) designated 500-year flood zones. “This highlights the need for revising both flood hazard zone maps and flood resilience plans in coastal regions,” Shirzaei said.
Through this analysis, they found land subsidence in the Houston-Galveston area of more than 0.19 inches (5 millimeters) per year in 85% of the flooded area. The likely causes of subsidence include compaction of sediments, groundwater extraction and hydrocarbon production.
[Red markers indicate inundation and standing water at 9:40 Central Daylight Time (14:40 Universal Coordinated Time) on Aug. 30, 2017, which is detected using Sentinel-1A/B SAR backscattering intensity change detection. Image by Megan Miller]
They concluded that the area’s subsidence affected flood severity by modifying base flood elevations and topographic gradients. “Ongoing land subsidence across the Houston area possibly lowered the flood control structures and changed floodplain boundaries and base flood drainage, which further intensified flooding,” Shirzaei said.
Flood resilience strategies
“In an era of climate change, weather extremes are becoming more frequent and intense,” Shirzaei added. “The combination of extreme rainfall and ground conditions are causing unprecedented flood events not only in coastal areas like Houston-Galveston, but also in Midwestern states where farmers have experienced damage to livestock and agriculture, stretching from Illinois to Louisiana.” While risk classification maps used by FEMA provide flood hazard data, this study shows that land elevation and slope are changing rapidly and these maps may need to be updated more frequently to account for such changes.
[Colored pixels identify areas inundated with standing water on Aug. 30, 2017 at 9:40 Central Daylight Time (14:40 Universal Coordinated Time) which is detected using Sentinel-1A/B SAR backscattering intensity change detection. The hue represents subsidence rates calculated from multitemporal SAR interferometric analysis of Sentinel-1A/B. Image by Megan Miller]
Also, land subsidence lowers coastal lands and makes them more vulnerable to flooding due to sea level rise and storm surges.
“The lessons learned from the floods following Hurricane Harvey highlight the major shortcomings of current flood resilience plans,” Shirzaei said. “We encourage stakeholders and regulators to use these findings to update hazard maps and improve flood resiliency plans accordingly to decide what precautionary measures are needed for their communities.”
On the horizon, Shirzaei and his research team are using the same satellite data techniques used in this study to focus on the spring 2019 flooding that has devastated the Midwestern states. They will be looking specifically at the impact of flooding on agriculture crop health and the local population. They hope to be able to provide recommendations on updating maps and resiliency plans to help these areas in the future.
[Red markers indicate snapshots of inundation area and standing water within the Midwest as detected using Sentinel-1A/B SAR backscattering intensity change detection at dates and UTC times mentioned within each SAR frame, shown with black rectangles. Image by Manoochehr Shirzaei]
Edited for WeatherNation by Meteorologist Mace MichaelsAll Weather News
More
Tropical Storm Chantal Forms This Morning
Tropical Storm Chantal has formed, with winds
5 Jul 2025 4:35 PM

Catastrophic Flooding in the Texas Hill Country
Multiple Flash Flood Emergencies were issued
5 Jul 2025 4:35 PM


Severe Storms in the Midwest Continue To Spoil the Holiday Weekend
NORTHERN PLAINS - A frontal system continues
5 Jul 2025 8:30 AM

Near Seasonal Temperatures for Many Come July 4th!
AAA is expecting over 70 million travelers to
4 Jul 2025 10:15 AM


Northwest Heat Met With Thunderstorm Risk
NORTHWEST - Today, portions of Montana are un
3 Jul 2025 12:00 AM