Improving Hurricane Storm Surge Forecasts with Digital Elevation Models
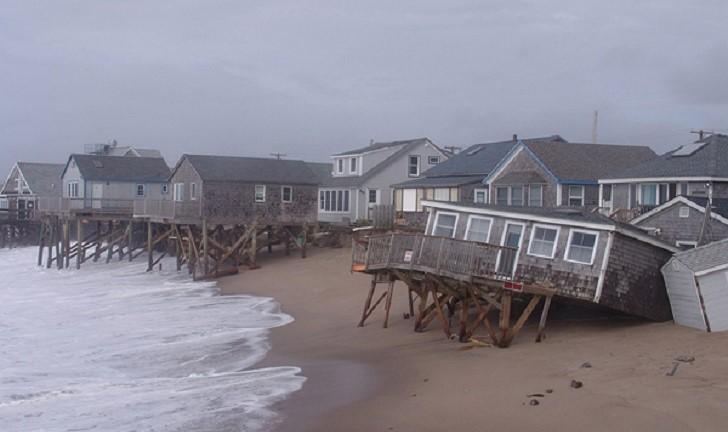
[Beachfront homes in the aftermath of Post-tropical Cyclone Sandy in 2012.]
From NOAA NCEI
Before and after a storm, NOAA NCEI scientists work hard at better preparing coastal communities for future tropical cyclones and hurricanes. NCEI supports hurricane storm surge and flood modeling through the development of coastal digital elevation models (DEMs). A DEM is a representation of Earth’s solid surface that depicts land heights and water depths to visualize relief in coastal zones. NCEI DEMs integrate bathymetry (details about the ocean floor) and topography in the coastal zones of the United States and in select international locations.
The shape and configuration of the coastline and the offshore, underwater slope exert controls on the rise of sea level associated with a landfalling hurricane. This storm surge enables waves to extend farther inland relative to normal conditions, flooding low-lying coastal areas and altering the physical landscape. Having access to the most up-to-date elevation data is critical for modeling and mapping experts to best determine the magnitude, timing, and extent of potential inundation.
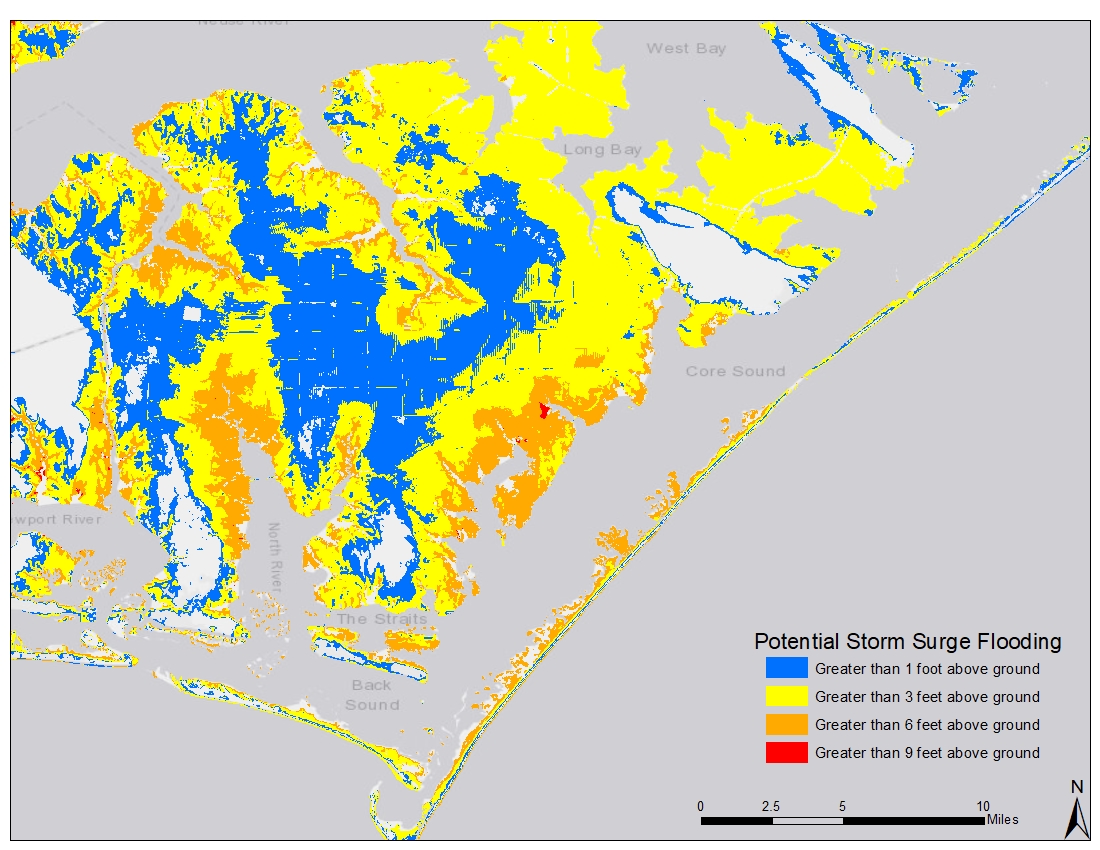
[This image represents the potential storm surge inundation extents for eastern North Carolina (Morehead City/Beaufort and vicinity). Courtesy of NOAA National Hurricane Center.]
In 2014, in the wake of Hurricane Sandy, a new national scale DEM development framework was created at NCEI to more efficiently create standardized, seamless data products. It was designed to facilitate rapid, targeted updates to existing DEMs with the most recent elevation data, ensuring that modelers and emergency managers have access to the most current, accurate data. Newly developed DEMs for North Carolina help prepare for future storms.
The DEM team at NCEI draws on its vast archive of data about the ocean depth (known as bathymetry data) collected for navigation and ocean resource management, as well as data from other federal agencies—like the U.S. Geological Survey, U.S. Army Corps of Engineers, and NASA—academia, and nonprofit organizations.
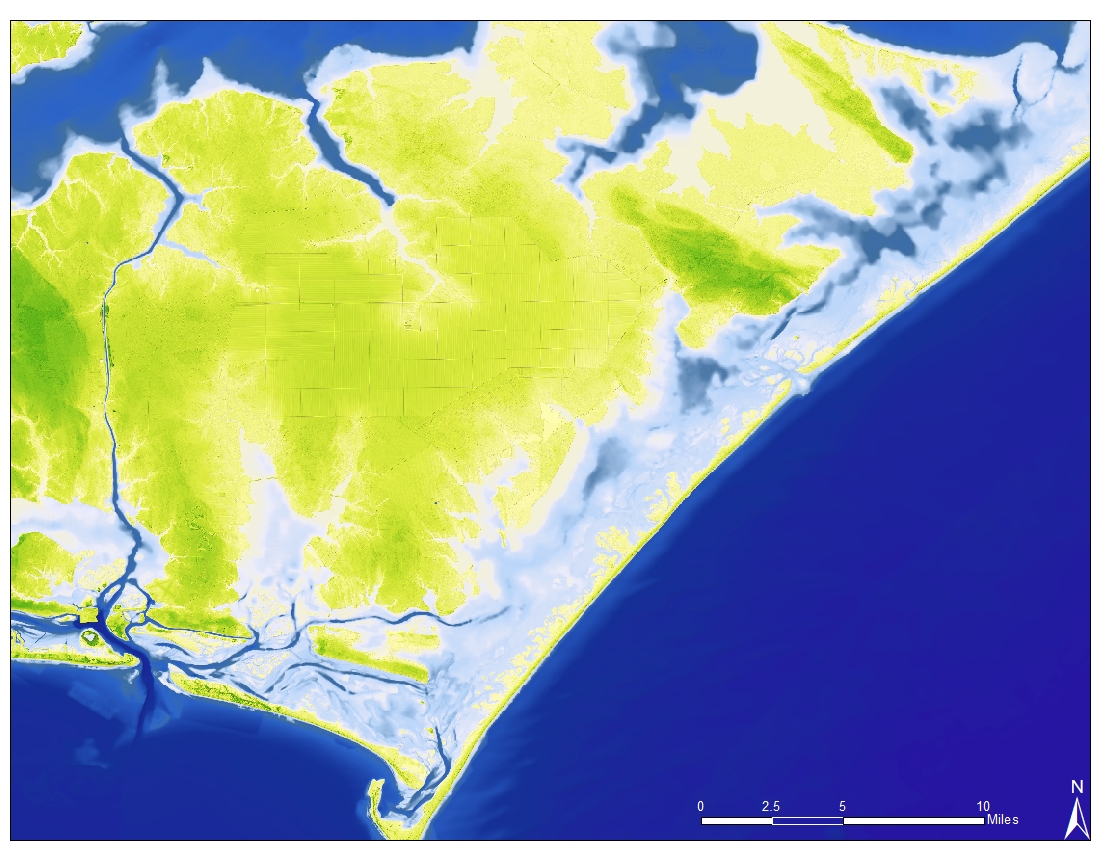
[Integrated topographic-bathymetric digital elevation model of eastern North Carolina (Morehead City/Beaufort and vicinity). Courtesy of NOAA NCEI.]
Other coastal topography and ocean bathymetry data include the NOAA NCEI Bathymetry Viewer and NOAA Office for Coastal Management Digital Coast Data Access Viewer.
Edited for WeatherNation by Meteorologist Mace Michaels


