Lightning Observations and Radar Data from Tuesday's Tornadic Supercell in Tennessee

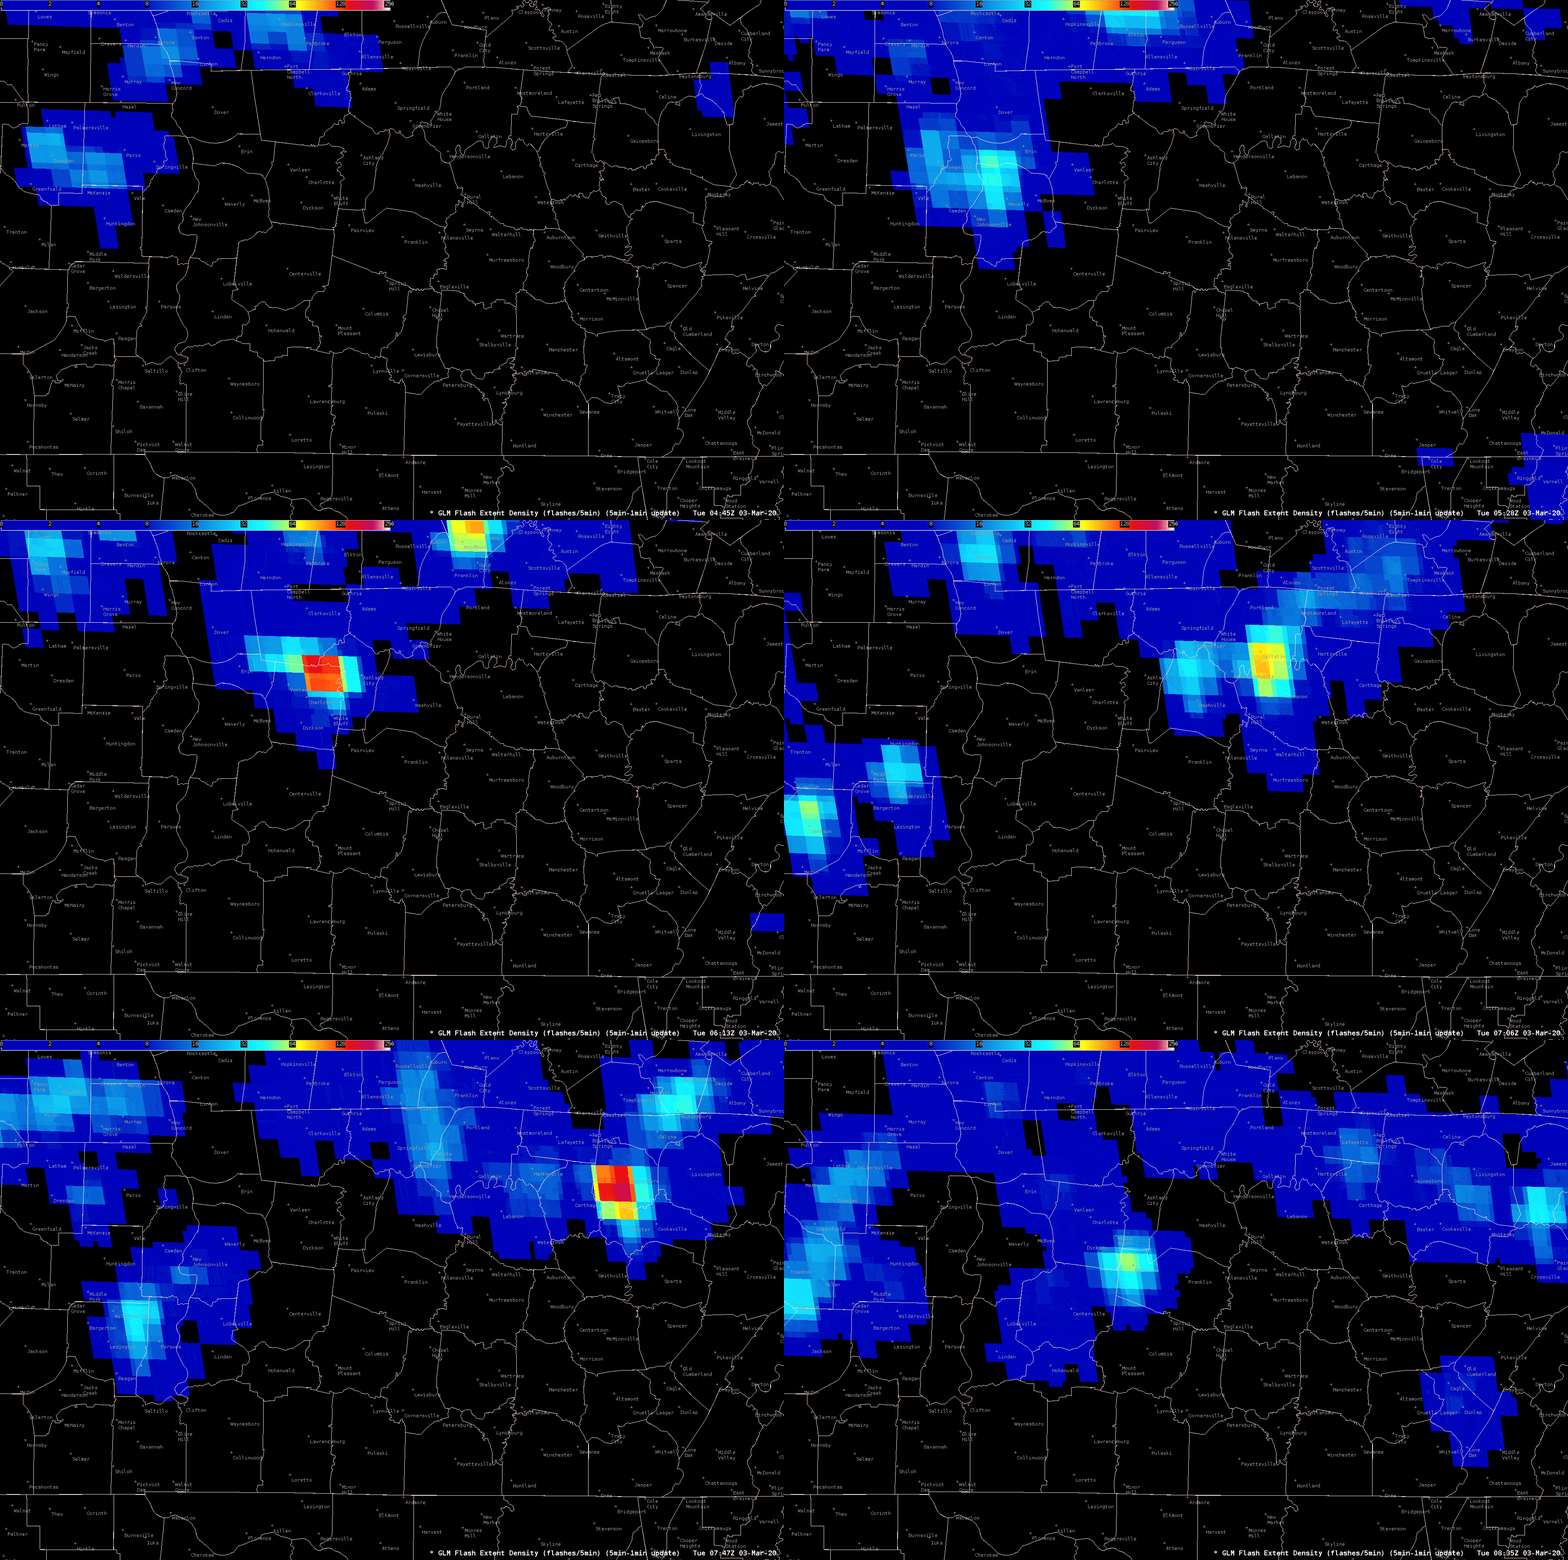 The first image below shows an animation of flash extent density within the NWS primary warning dissemination tool, AWIPS2. Note that there are 3-4 distinct pulses in lightning activity as the storm traverses Central Tennessee. If we look at a time series of this flash data, there are five distinct rapid increases in the flash rate, known as lightning jumps, were observed (below, Fig. 2). Rapid increases in flash rate depicted in Figure 2 are associated to strengthening updrafts in the mid-levels of thunderstorms, where the strengthening updraft facilitates charge separation and an increase in the lightning frequency.
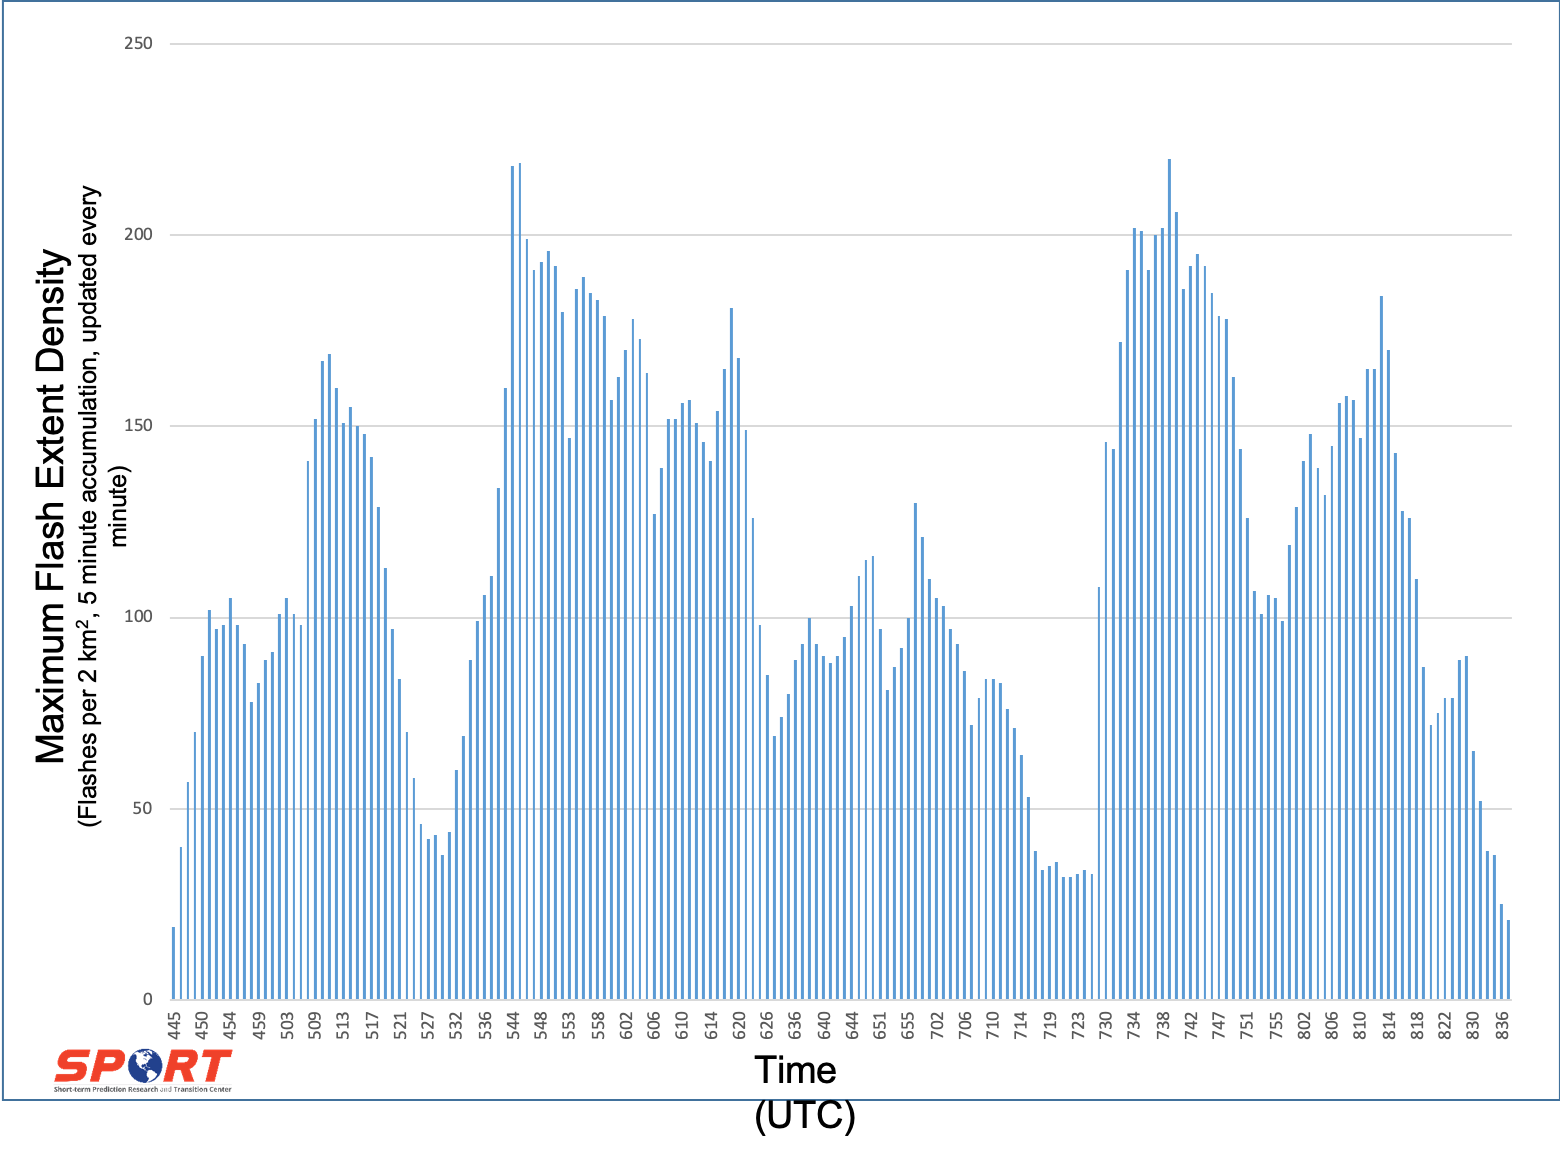
[Figure 2 – Time trend information of the maximum flash extent density value aggregated over a five minute period, updated every one minute.]
Examining the initial lightning jump, there are notable differences in storm structure when the pre-jump and post-jump radar images are compared (Figure 3). The first main difference is the notable bounded weak echo region (BWER) in the horizontal reflectivity data (Panels A vs F). Cross section of reflectivity also show an increased depth of the BWER in Panels E and J. The second notable difference is the increase in low-level rotation in radial velocity between Panels B and G. Research completed at UAH indicates that 77% of the time a lightning jump was observed in a sample of 19 supercell events, low and mid-level rotation increased, similar to what is observed in this time period. The first severe weather reported with this storm was near 11 p.m. Monday night (0507 UTC) with 1.50 inch hail falling near Camden, Tennessee.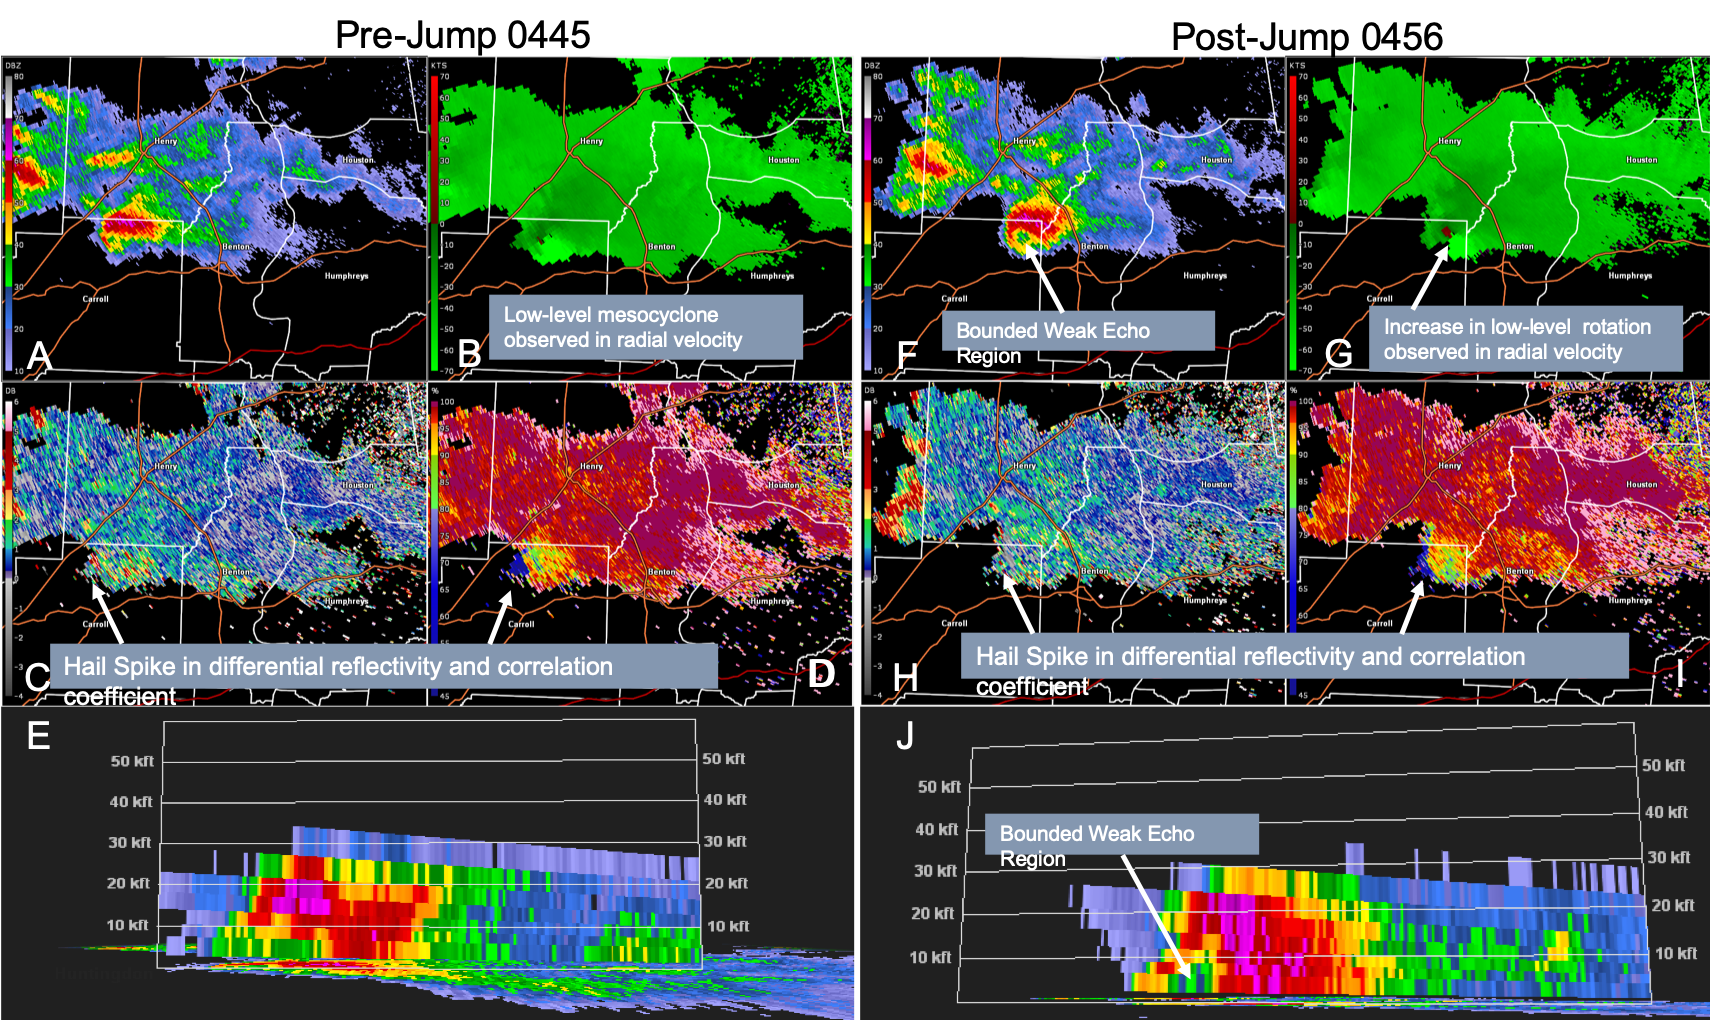
[Figure 3 – 10 panel image of radar information from the National Weather Service Radar at Ft. Campbell, Kentucky at 0445 UTC and 0456 UTC. Panels A and F are horizontal reflectivity at 0.5 degrees elevation, B and G are radial velocity, C and H are differential reflectivity, D and I are correlation coefficient, and E and J are vertical cross sections of the storm through the center of the mesocyclone region.]
Another observation is the relative lull in lightning activity around 1:20 a.m. to 2:30 a.m. (0620 UTC through 0730 UTC). It is unclear at this point in time of the specific start time of the tornado that tracked from Nashville to Mt. Juliet due to ongoing surveys; however, radar data indicates lofted debris from the tornado as early as 1:36 a.m. (0636 UTC) (Figure 4A), lasting all the way to at least 2:33 a.m. (0733 UTC) (not shown). Previous work on lightning lulls near the time of tornadogenesis theorize that the lack of lightning is due to weakening vertical motion in the mixed phase region as downdraft processes in the thunderstorm taking over.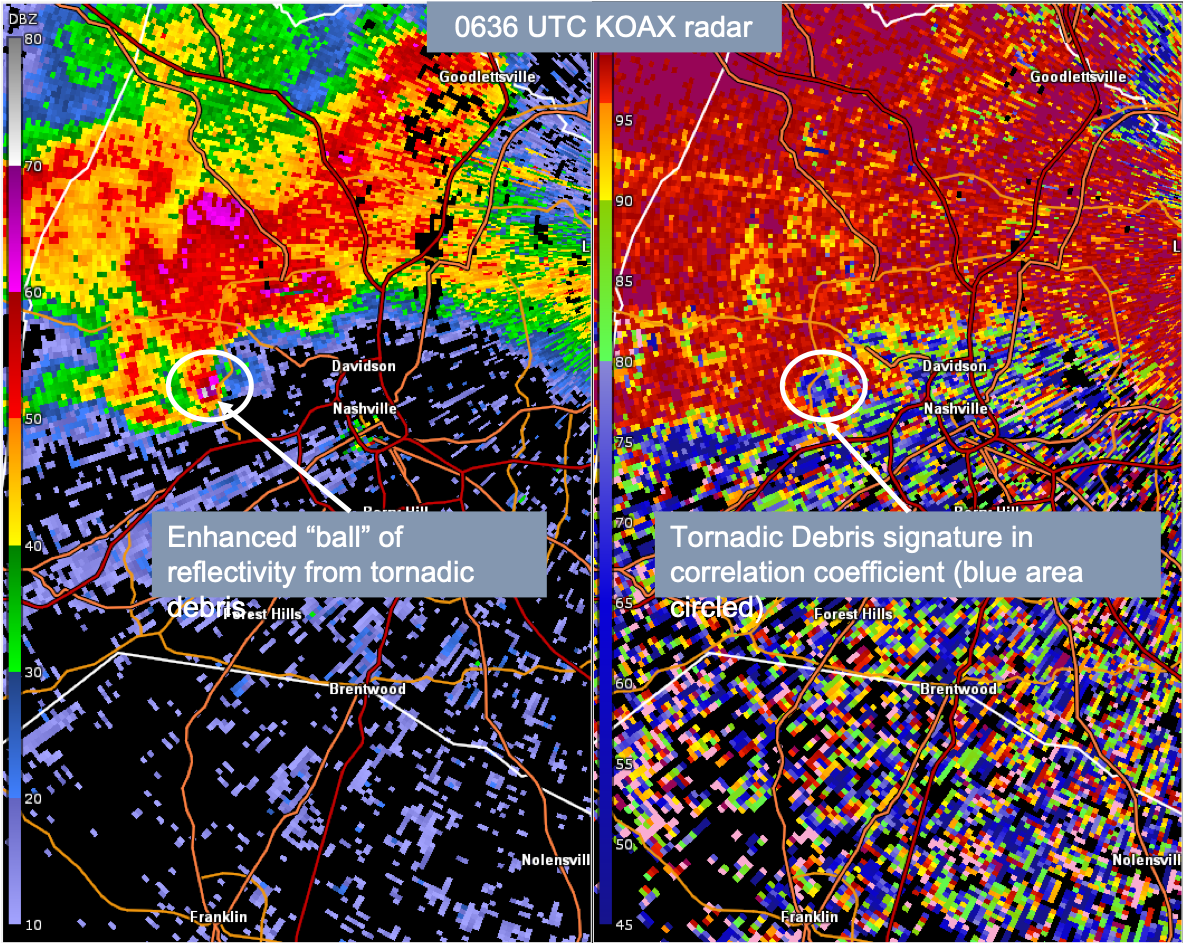
[Figure 4 – Two panel radar image from KOHX in Old Hickory, Tennessee at 1:36 a.m. (0636 UTC), when the first instances of a tornadic debris signature was present, confirming the tornado’s presence at the surface.]
It must be emphasized that the low and mid-level rotation increases do not directly correspond to the development of tornadoes because the processes that are responsible for tornadogenesis are found within the lowest 1 km of the atmosphere, while those related to lightning generation are generally above 4 km. However, forecasters within the NWS have been able to combine the lightning, radar, and local environmental data to anticipate potential strengthening of a thunderstorm in specific severe weather environments. Additional details on storm evolution will unfold as the NWS offices complete their surveys. We will be looking into the resurgence in flash rates as the storm moved eastward from Nashville and Mt. Juliet. Additional damage was reported near Cookeville, Tennessee, but radar data at this time do not allow us to confirm any details on this portion of the storm’s lifecycle.


