Revisiting the April 2011 Tornado “Super Outbreak” from Orbit
Special Stories
28 Apr 2021 3:45 PM
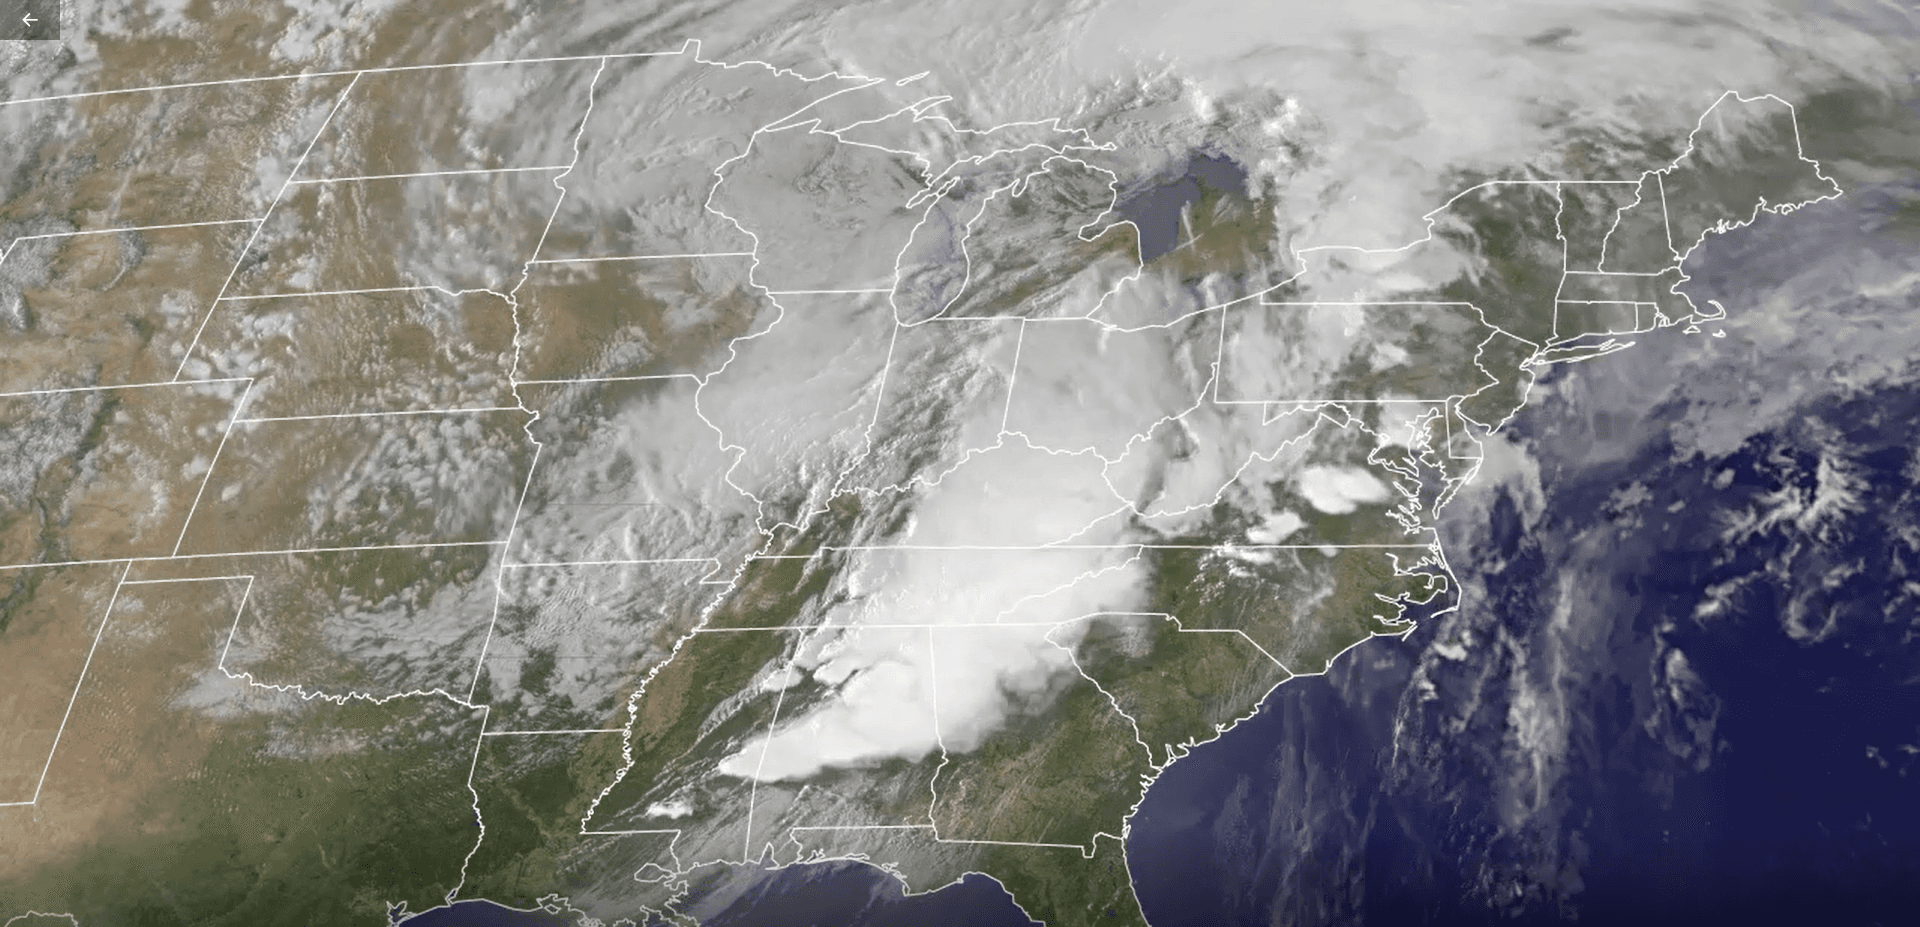
[A time lapse of the April 2011 tornado outbreak from NOAA’s GOES-13 satellite from April 26-28, 2011.]
[Written by NOAA] This week marks the tenth anniversary of one of the largest, deadliest, and most destructive tornado outbreaks in United States history.
 [One of the larger tornado damage tracks across northwestern Alabama was apparent on GOES-13’s visible channel imagery. Yellow arrows point to the southwest-to-northeast oriented track and the animation helps to confirm that the feature is not a contrail or some other type of linear cloud feature (which would be moving in an animation, rather than stationary.)]
 [A 4-km-resolution GOES-13 infrared channel loop with overlays of severe weather reports from April 27-28, 2011. The coldest cloud tops, generally indicative of the strongest storms, are shown in red and black colors.]
 [A 1-km-resolution GOES-13 visible channel loop showing the multiple clusters of severe thunderstorms that developed across the region on April 27, 2011.]
[One of the larger tornado damage tracks across northwestern Alabama was apparent on GOES-13’s visible channel imagery. Yellow arrows point to the southwest-to-northeast oriented track and the animation helps to confirm that the feature is not a contrail or some other type of linear cloud feature (which would be moving in an animation, rather than stationary.)]
The Outbreak
The ingredients for this now-infamous tornado outbreak started coming together the weekend before. A powerful low-pressure system was sweeping across the U.S. and it was expected to combine with moist and unstable air as it pushed eastward that Monday, April 25. During the next four days, more than 360 tornadoes touched down from Texas to New York. Of those, there were three EF5 tornadoes—with winds above 200 mph—12 EF4 tornadoes and 21 EF3s. The outbreak from April 25-28, 2011, challenged and surpassed the records set by almost all previous tornado events, ranking as one of the deadliest and most expensive meteorological disasters on record. It resulted in roughly $12 billion in damages and left an estimated 321 people dead. The event killed more people than any tornado outbreak since 1936, when 454 people lost their lives.
[A 4-km-resolution GOES-13 infrared channel loop with overlays of severe weather reports from April 27-28, 2011. The coldest cloud tops, generally indicative of the strongest storms, are shown in red and black colors.]
GOES-13
During that outbreak a decade ago, NOAA’s GOES-13 satellite served as GOES East, and it was a critical source of information during major U.S. weather events. When GOES-13 first launched from Cape Canaveral Air Force Station in May 2006, it joined a new generation of satellites known as the GOES-N,O,P series. With faster data processing, GOES-13 could pinpoint the location of severe storms and other weather phenomena with increased accuracy, allowing forecasters to provide timelier warnings to the public. For more information about that historic outbreak, check out these links: 2011 Tornado Super Outbreak and 10th Anniversary of April 27, 2011 Super Outbreak
[A 1-km-resolution GOES-13 visible channel loop showing the multiple clusters of severe thunderstorms that developed across the region on April 27, 2011.]
Today’s GOES Satellites
Ten years later, NOAA has another generation of geostationary satellites called the GOES-R series, with GOES-16 and GOES-17 serving as GOES East and West, respectively. The GOES-R Series scans the Earth five times faster with four times the resolution and three times the number of channels than previous GOES satellites. The satellites’ Advanced Baseline Image ABI provides images as frequently as every 30 seconds for more accurate and reliable forecasts and severe weather warnings. Working in concert, NOAA’s GOES-R satellites provide constant watch over the United States and the Western Hemisphere, helping monitor severe storms, tropical systems, wildfires, and daily weather patterns.All Weather News
More


More Storms for the East Sunday and Monday
A low-pressure system crashing through the Mi
2 Aug 2026 2:20 AM

After Reaching Category 5, Genevieve Weakens in the Pacific
PacificGenevieve formed on last Friday south
2 Aug 2026 1:30 AM

Flooding, Severe Storms Target the Midwest Again
After an active week of storms across the nor
1 Aug 2026 1:40 AM

Flooding Risk Increases as Heavy Rain Targets the Tri-State Area
Tuesday, heavy rainfall moved across the Nort
30 Jul 2026 12:25 AM

Severe Weather: Energy From the Midwest Now in the Southeast
UPPER MIDWEST - Through Monday, dangerous tor
29 Jul 2026 10:30 PM