Weather and Data Fun - The 12 Datasets of Christmas!
Special Stories
19 Dec 2018 7:46 AM
Every month, NOAA’s National Centers for Environmental Information (NCEI), which houses NOAA’s environmental data, serves millions of requests for data from its vast archives. Much of this data is free and open to the public.
While you could easily spend days, if not weeks, exploring NCEI’s treasure trove of environmental observations, here are 12 noteworthy databases worth a browse:
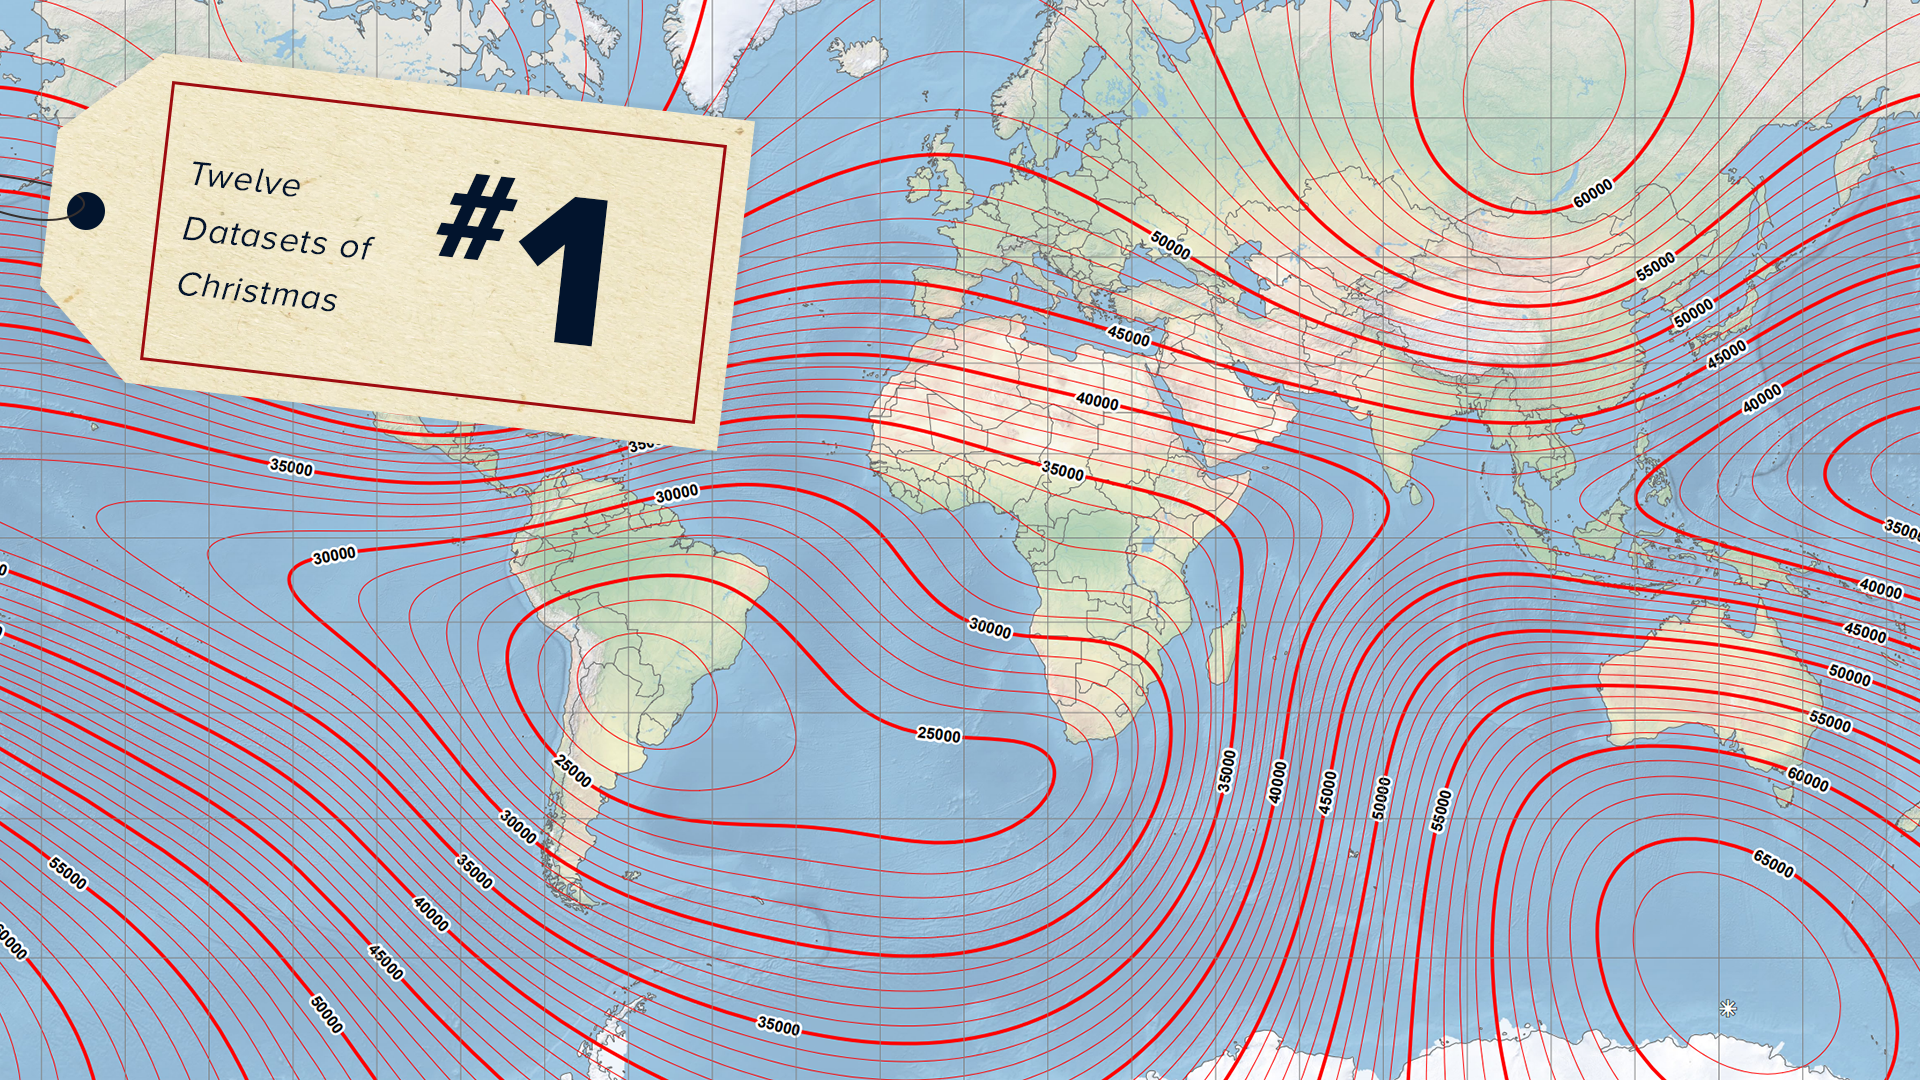 Earth’s magnetic field has been important to navigation since ancient times. Today, whether we realize it or not, our smartphones rely on magnetic models to get us from point A to point B.
NOAA’s World Magnetic Model (WMM), which is a large-scale representation of the planet’s magnetic field, is used to ensure that both analog and digital magnetic compasses are actually pointing you in the right direction. Satellite data on Earth’s changing magnetic fields help scientists ensure that they are providing the most accurate world magnetic model.
To this day, the WMM is the navigation standard model for the entire U.S. Department of Defense, the North Atlantic Treaty Organization, International Hydrographic Organization, Federal Aviation Administration, consumer electronics (e.g., iOS, Blackberry, Android), and many others.
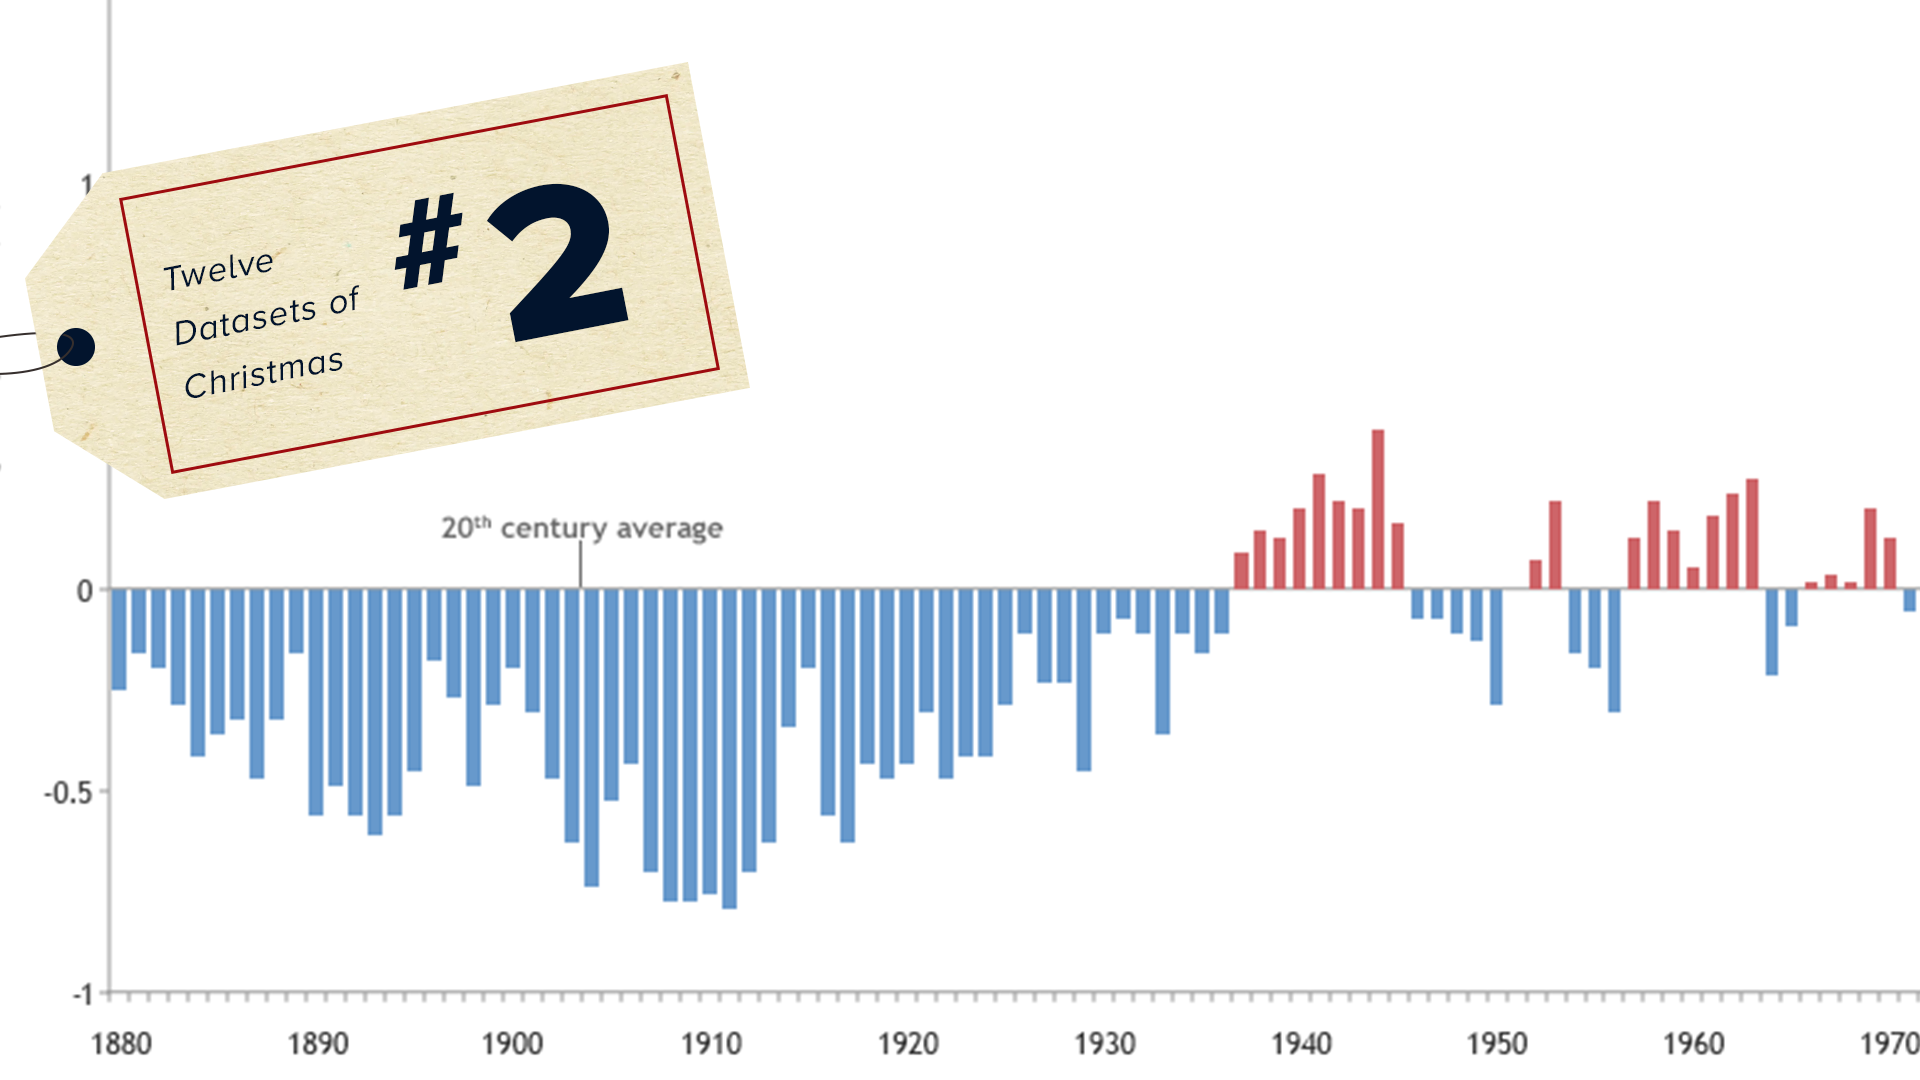
Also known as the GHCN, this massive database contains temperature and precipitation observations from tens of thousands of land-based weather stations around the world – available from the late 1800s to the present. These daily and monthly data allow us to understand long-term climate trends (on local and regional scales) and are used extensively by individuals and organizations, both public and private, in sectors such as agriculture, energy and transportation.
The daily climate data in the GHCN come from 180 countries and territories, with the most comprehensive records available in the U.S., Canada and Australia. Learn more about how to access the data.
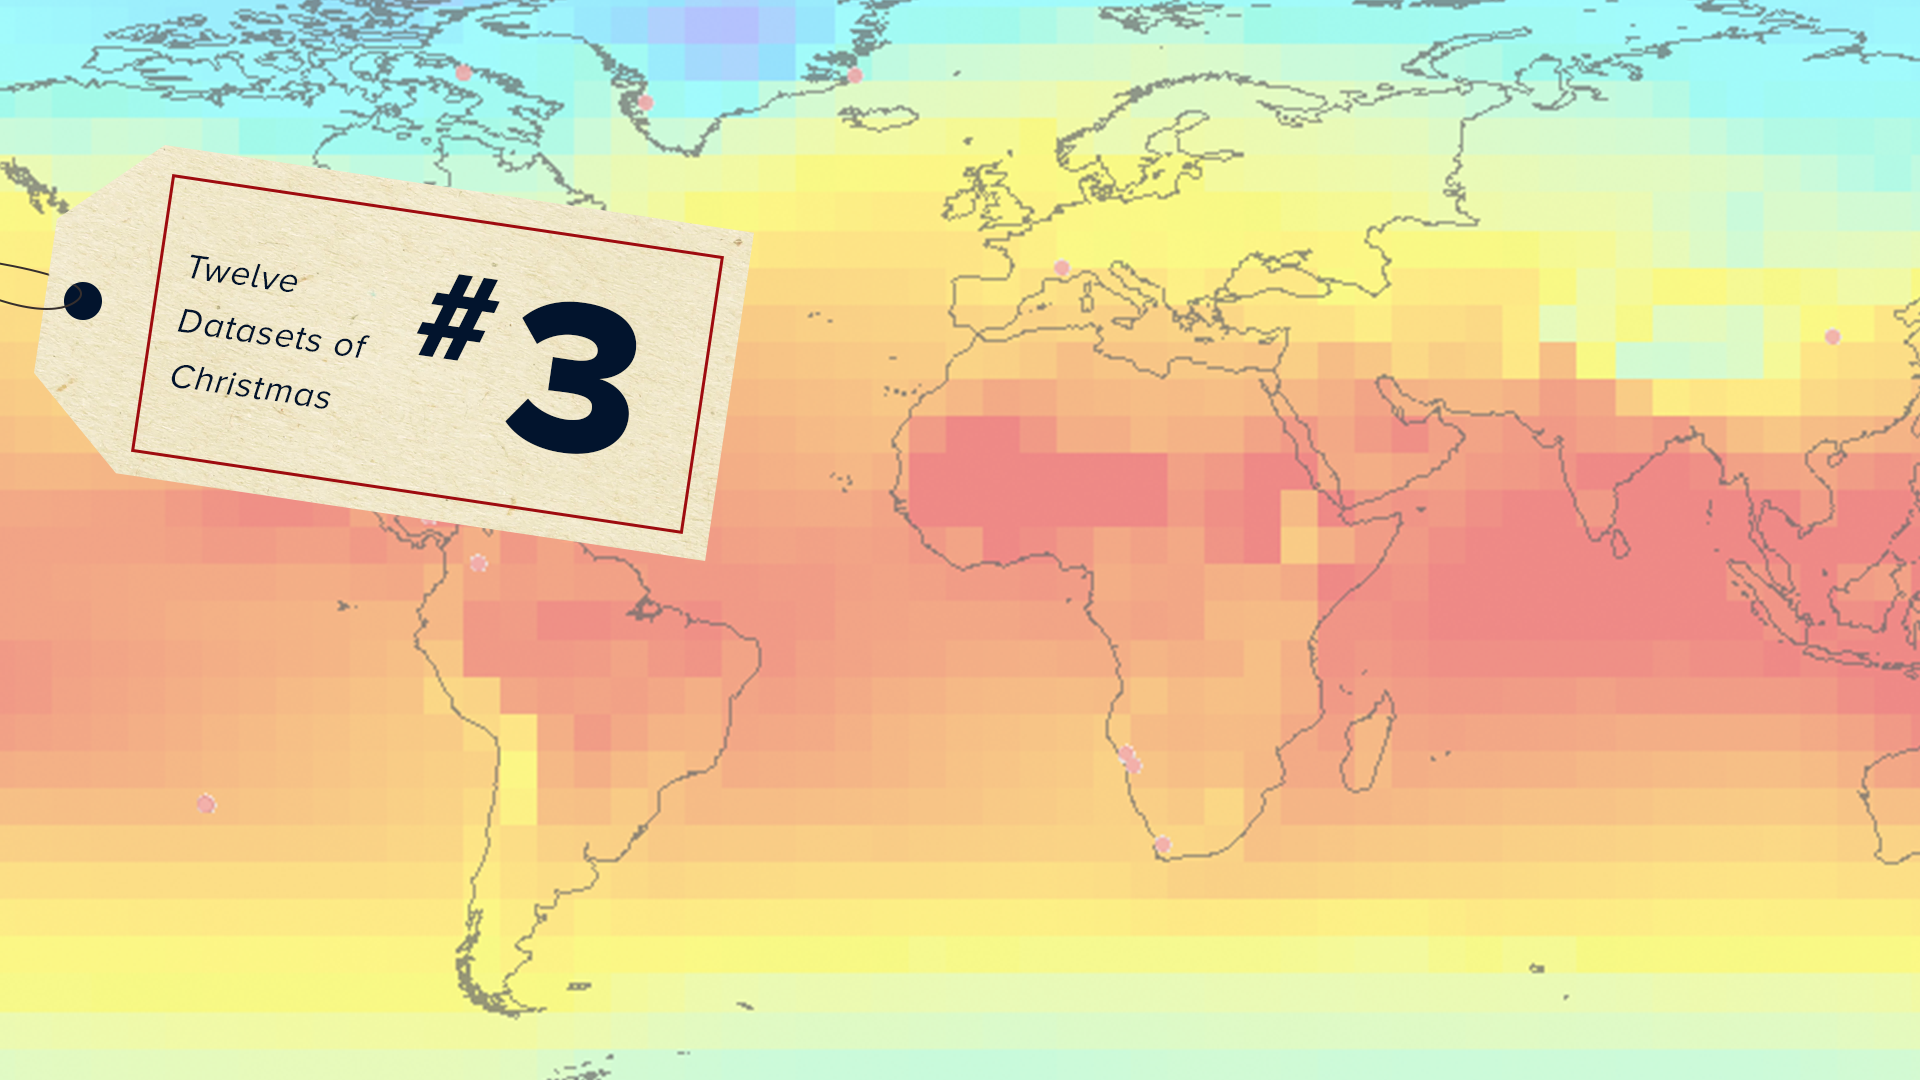 This may sound a little batty, but bat guano (basically poop that’s accumulated over the years) has helped scientists reconstruct climate conditions from hundreds of years ago.
Paleoclimate scientists, who study substances that accumulate over time, traveled to a place known as Mӑgurici Cave in Romania. A colony of bats has lived there for generations and has left behind droppings on the cave floor for just as long. It may sound gross, but the 9-foot-tall pile of guano that scientists found there was a goldmine in terms of climate data.
Scientists were able to radiocarbon date the guano to determine when certain layers were deposited. Those various layers revealed how temperature, precipitation and the plants growing in the area had changed over hundreds of years.
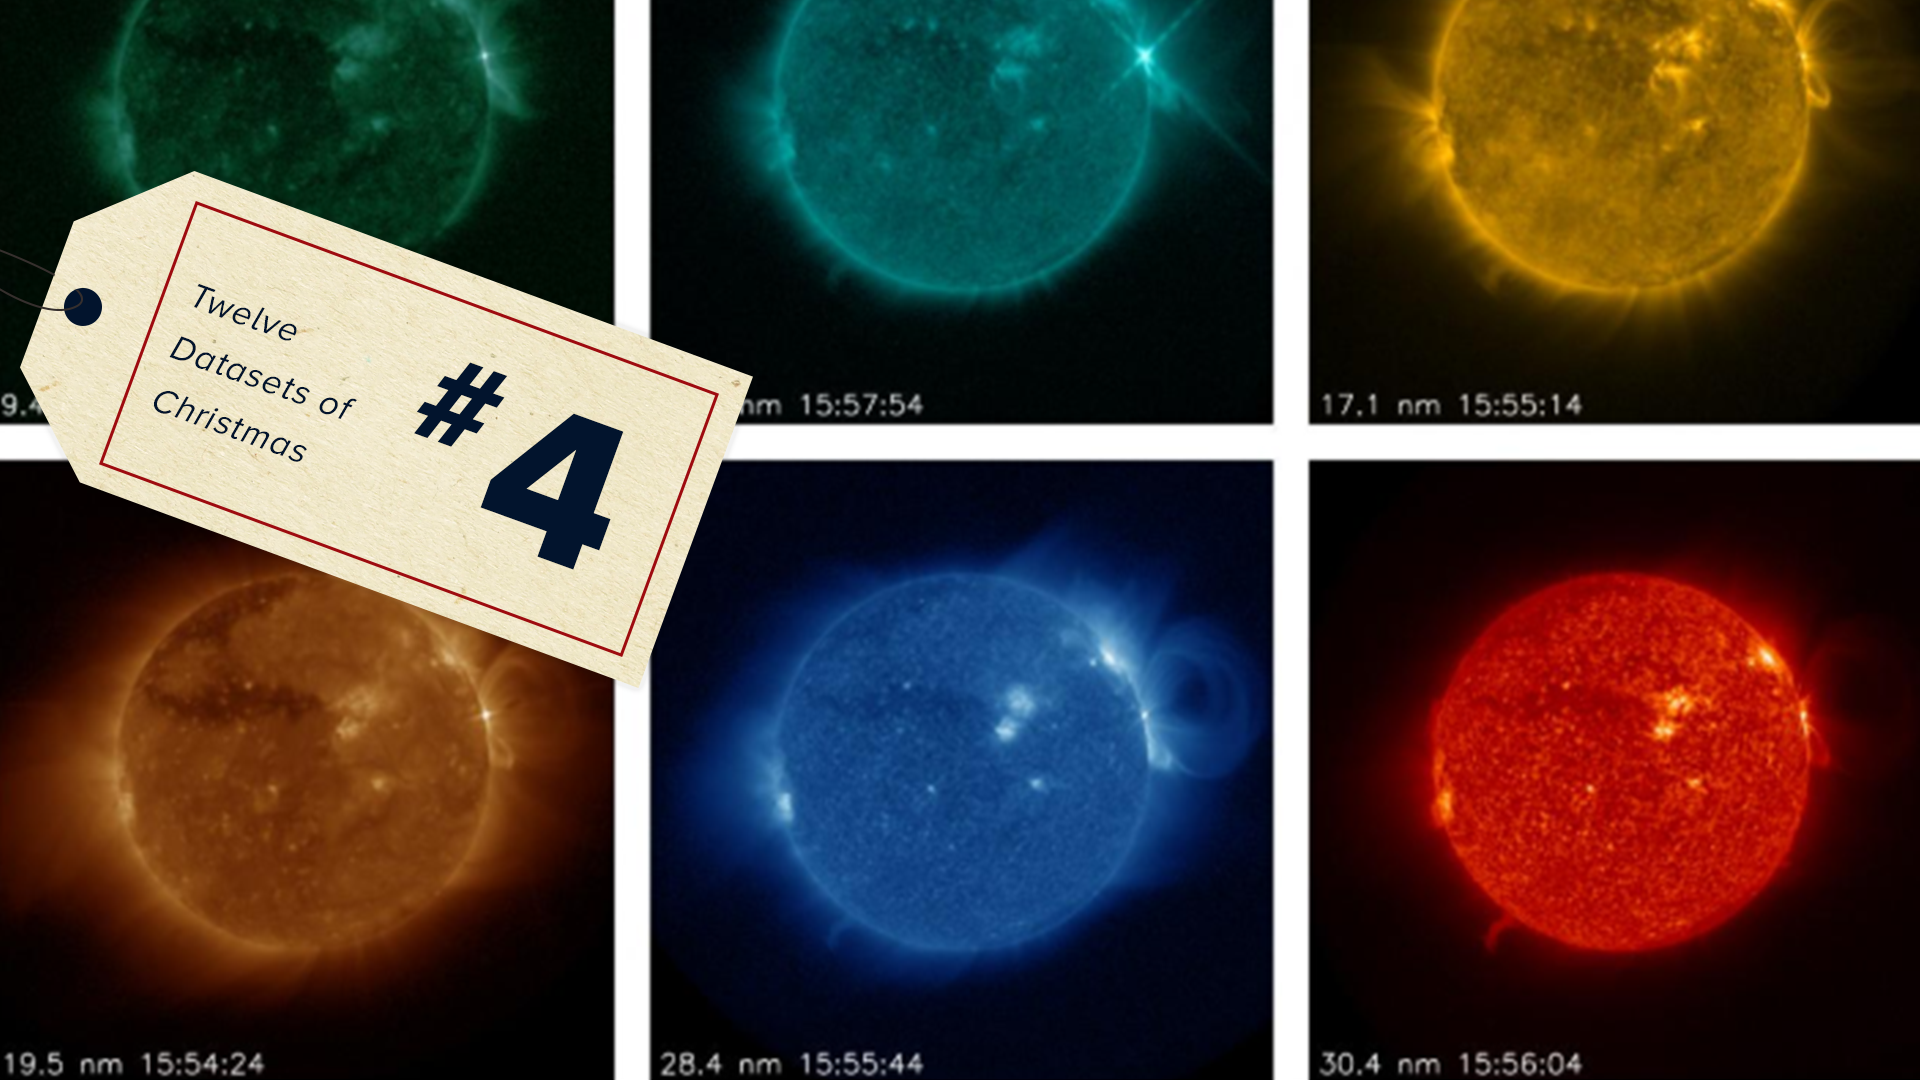 While we know quite a bit about weather here on Earth, there are a lot of questions about space weather that have yet to be answered. The sun is believed to be the main source of space weather, which is why scientists want to understand more about solar activity at different temperatures.
Scientists from NCEI and the Cooperative Institute for Research in Environmental Sciences (CIRES) are working to collect imagery from GOES East’s Solar Ultraviolet Imager (SUVI) instrument, which is a telescope used to monitor solar flares and solar eruptions. These observations can help NOAA’s Space Weather Prediction Centerimprove space weather forecasts and provide early warnings if there are potential impacts to Earth.
 This database is a joint initiative between NCEI and the NOAA Office of Ocean Exploration and Research (OER) to archive thousands of hours of video from expeditions conducted aboard the NOAA ship Okeanos Explorer. The underwater footage provides a glimpse of never-before-seen underwater locations, geological features, marine life, and historical artifacts.
When coupled with scientific data, the footage archived in the OER Video Portal can be used to support policy development and resource management decisions.
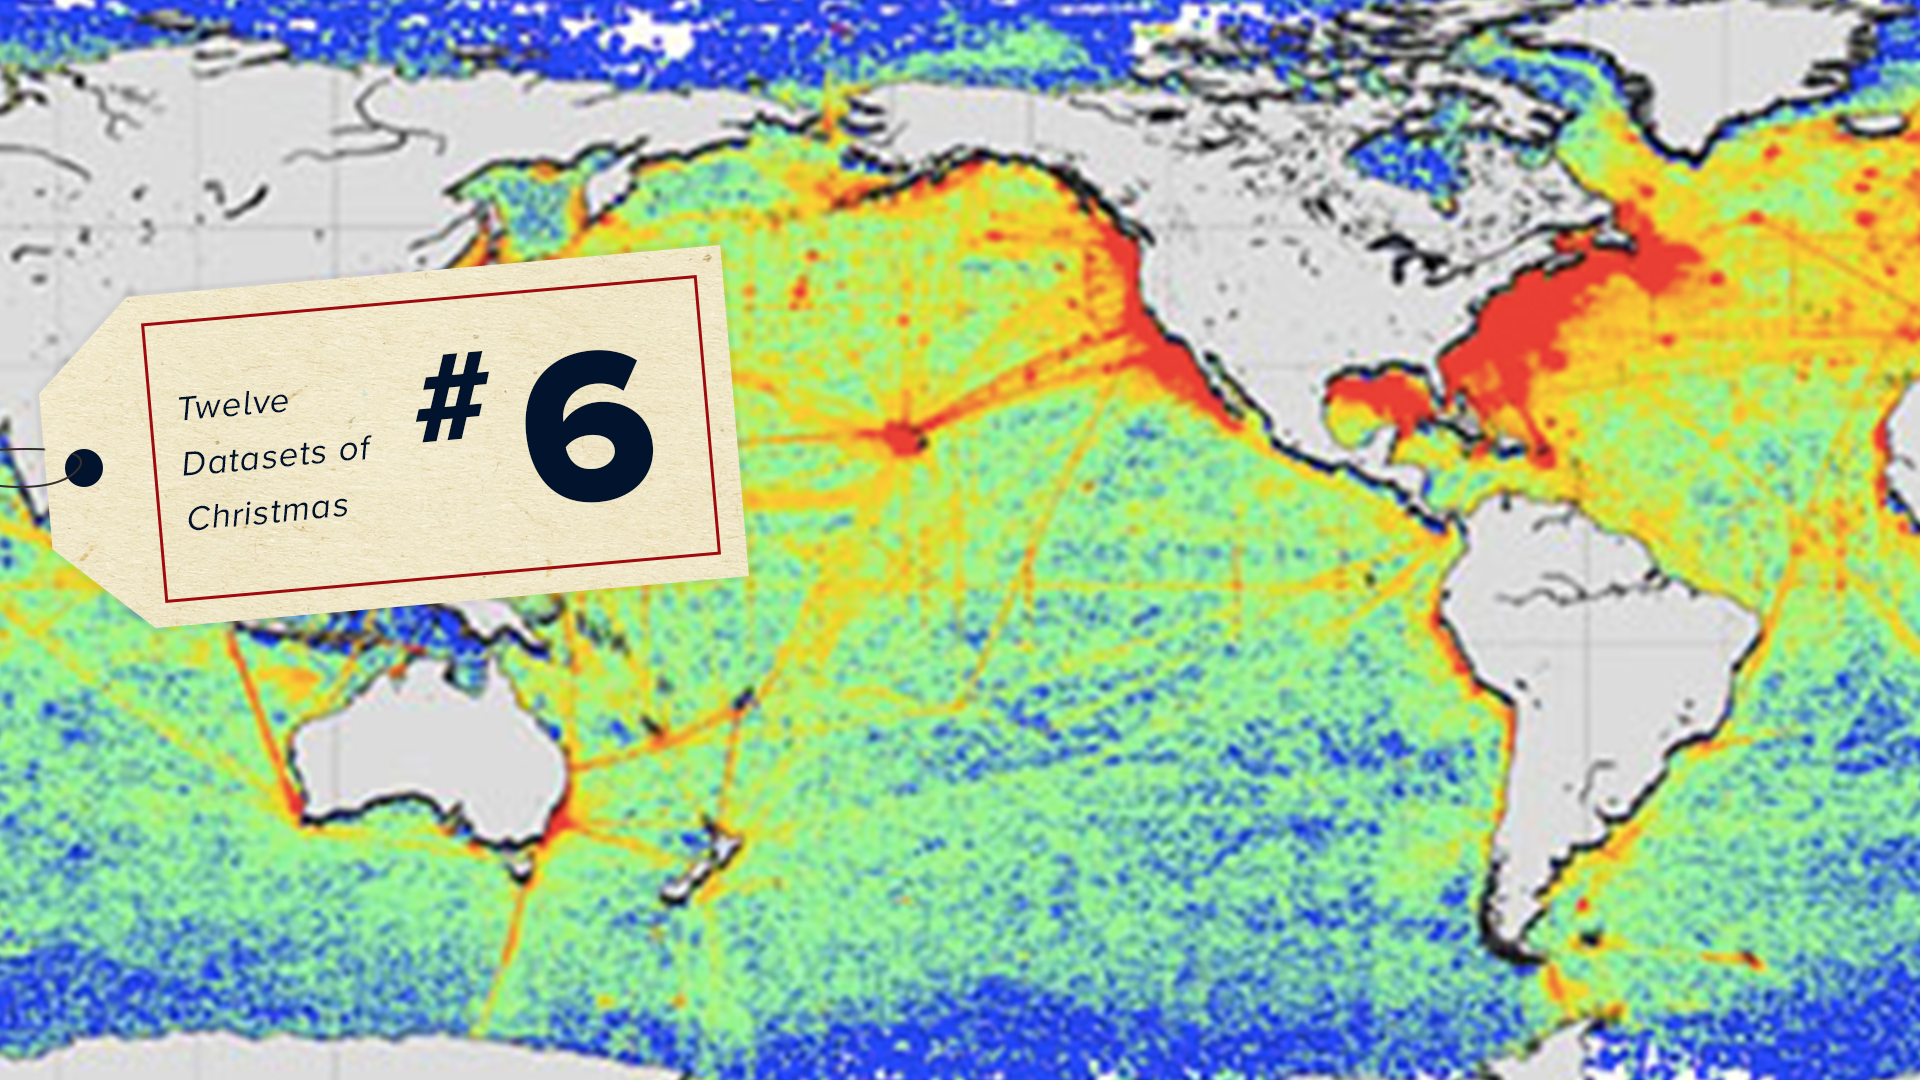 Did you know NOAA has ocean records dating back to the sailing days of Captain Cook? The World Ocean Database (WOD) contains more than 20,000 datasets measuring sea surface temperature, salinity, nutrients, pH levels, oxygen concentrations, and more. These datasets consist of millions of uniformly formatted records called “profiles,” which are continually updated by about 90 countries around the world. It is the largest publicly available in situ ocean profile database in the world.
The World Ocean Database is widely used by the global oceanography community. Access the data here.
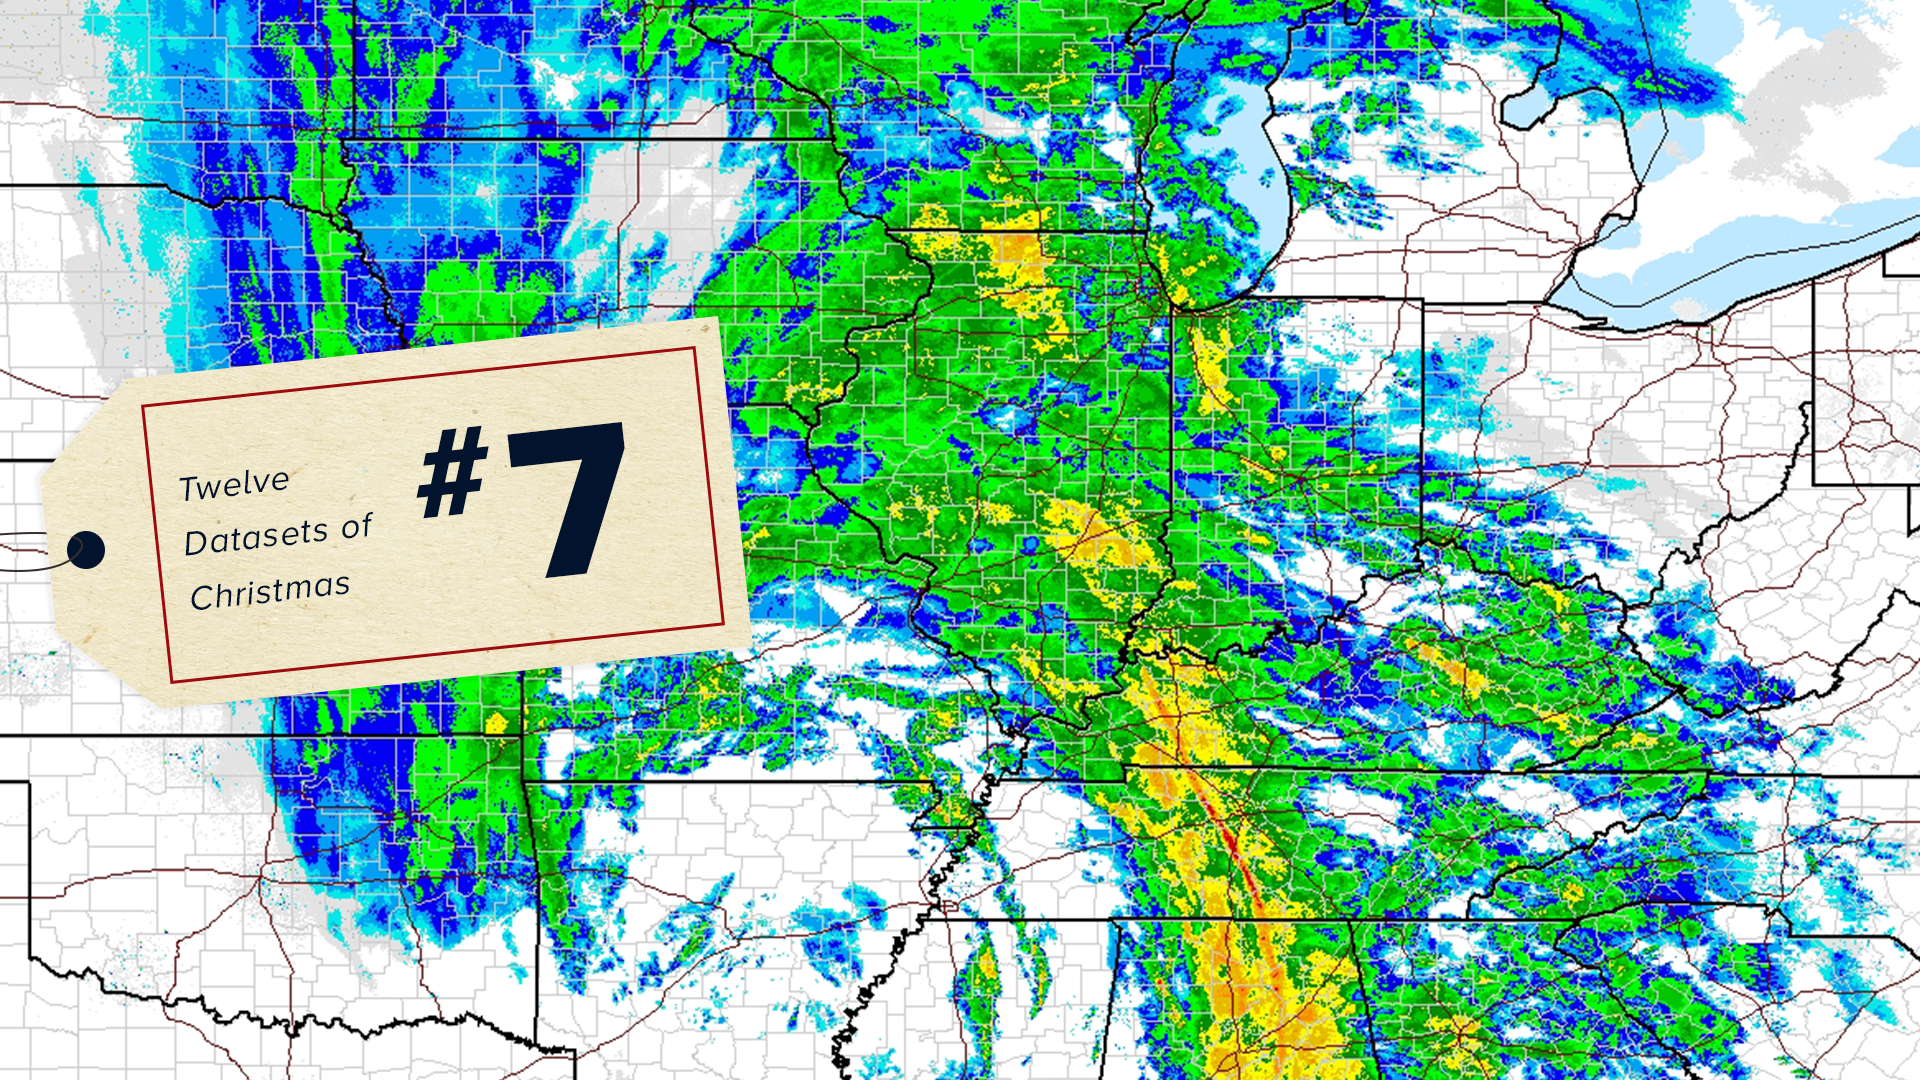 When a thunderstorm or severe weather strikes, you’ve probably seen those colorful maps that show where the heaviest rain is falling. Thanks to radar (an acronym for radio detection and ranging) we can use radio waves to detect the height, movement and speed of objects – including rain and other precipitation. An antenna transmits pulses of radio waves or microwaves, which bounce off the precipitation in its path, and allow us to measure the intensity of water falling from the sky.
NCEI’s Radar Archive lets you download historical radar data and maps from the Next Generation Weather Radar system (NEXRAD), which are available as a public dataset on Google Cloud. Radar data helps us estimate the location and intensity of rainfall, hail, tornadoes, snowfall and even wind speeds. This information is useful for air traffic control, agriculture, and water management.
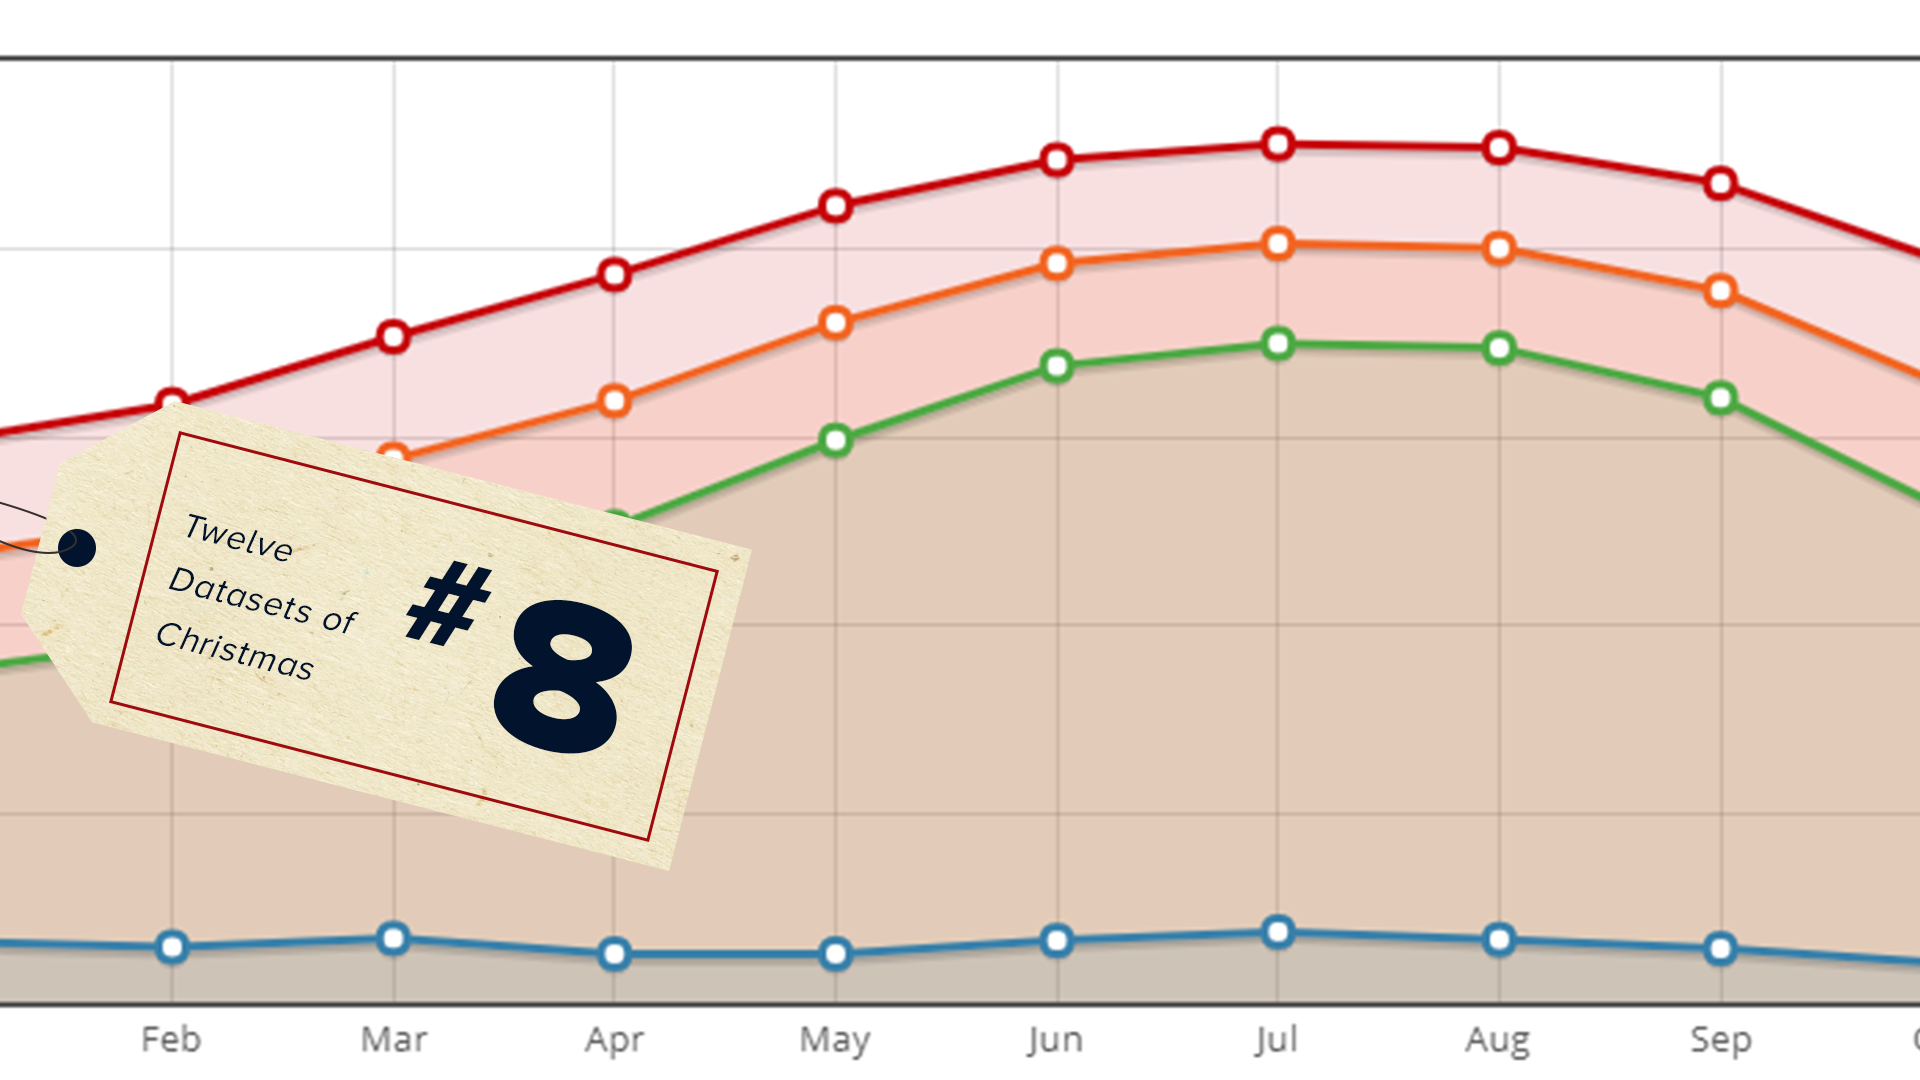 Climate normals are long-term averages of historical climate data, such as temperature and precipitation, based on a 30-year reference period (currently 1981–2010). Knowing these averages can tell us how much warmer or cooler, wetter or drier the weather has been lately. This database lets you search more than 9,800 stations across the U.S. to learn about the long-term average climate at any one location and includes a series of interactive maps.
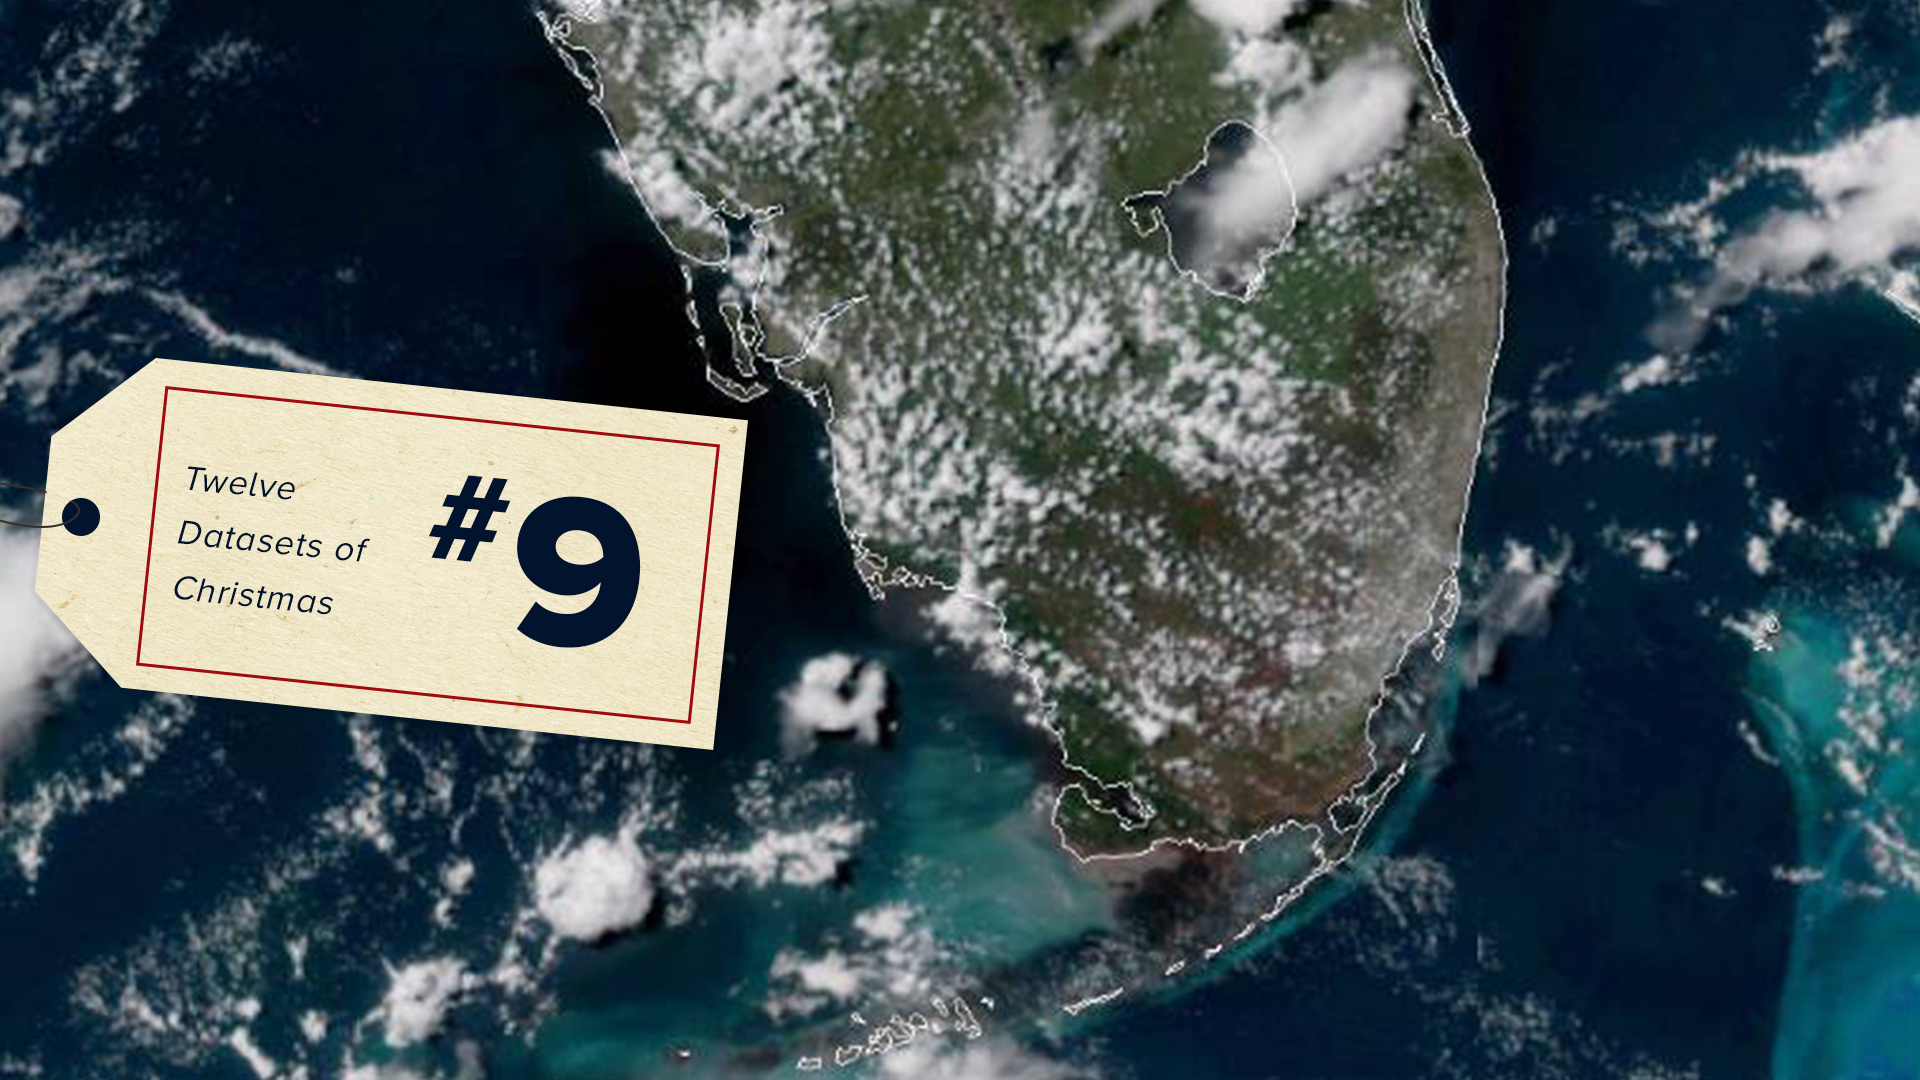 Harmful algal blooms (HAB), which happen when colonies of algae grow out of control, have occured in every U.S. coastal and Great Lakes state. HABs are closely monitored because they can be detrimental to the health of humans and marine life.
NCEI keeps track of reported HABs in the Gulf of Mexico with its Harmful Algal BloomS Observing System (HABSOS), which gives environmental managers, scientists and the public a better idea of where HABs are located and how many are happening at a particular time. This dataset, along with satellite imagery, field observations, models, public health reports and buoy data, helps NOAA issue HAB forecasts for coastal communities.
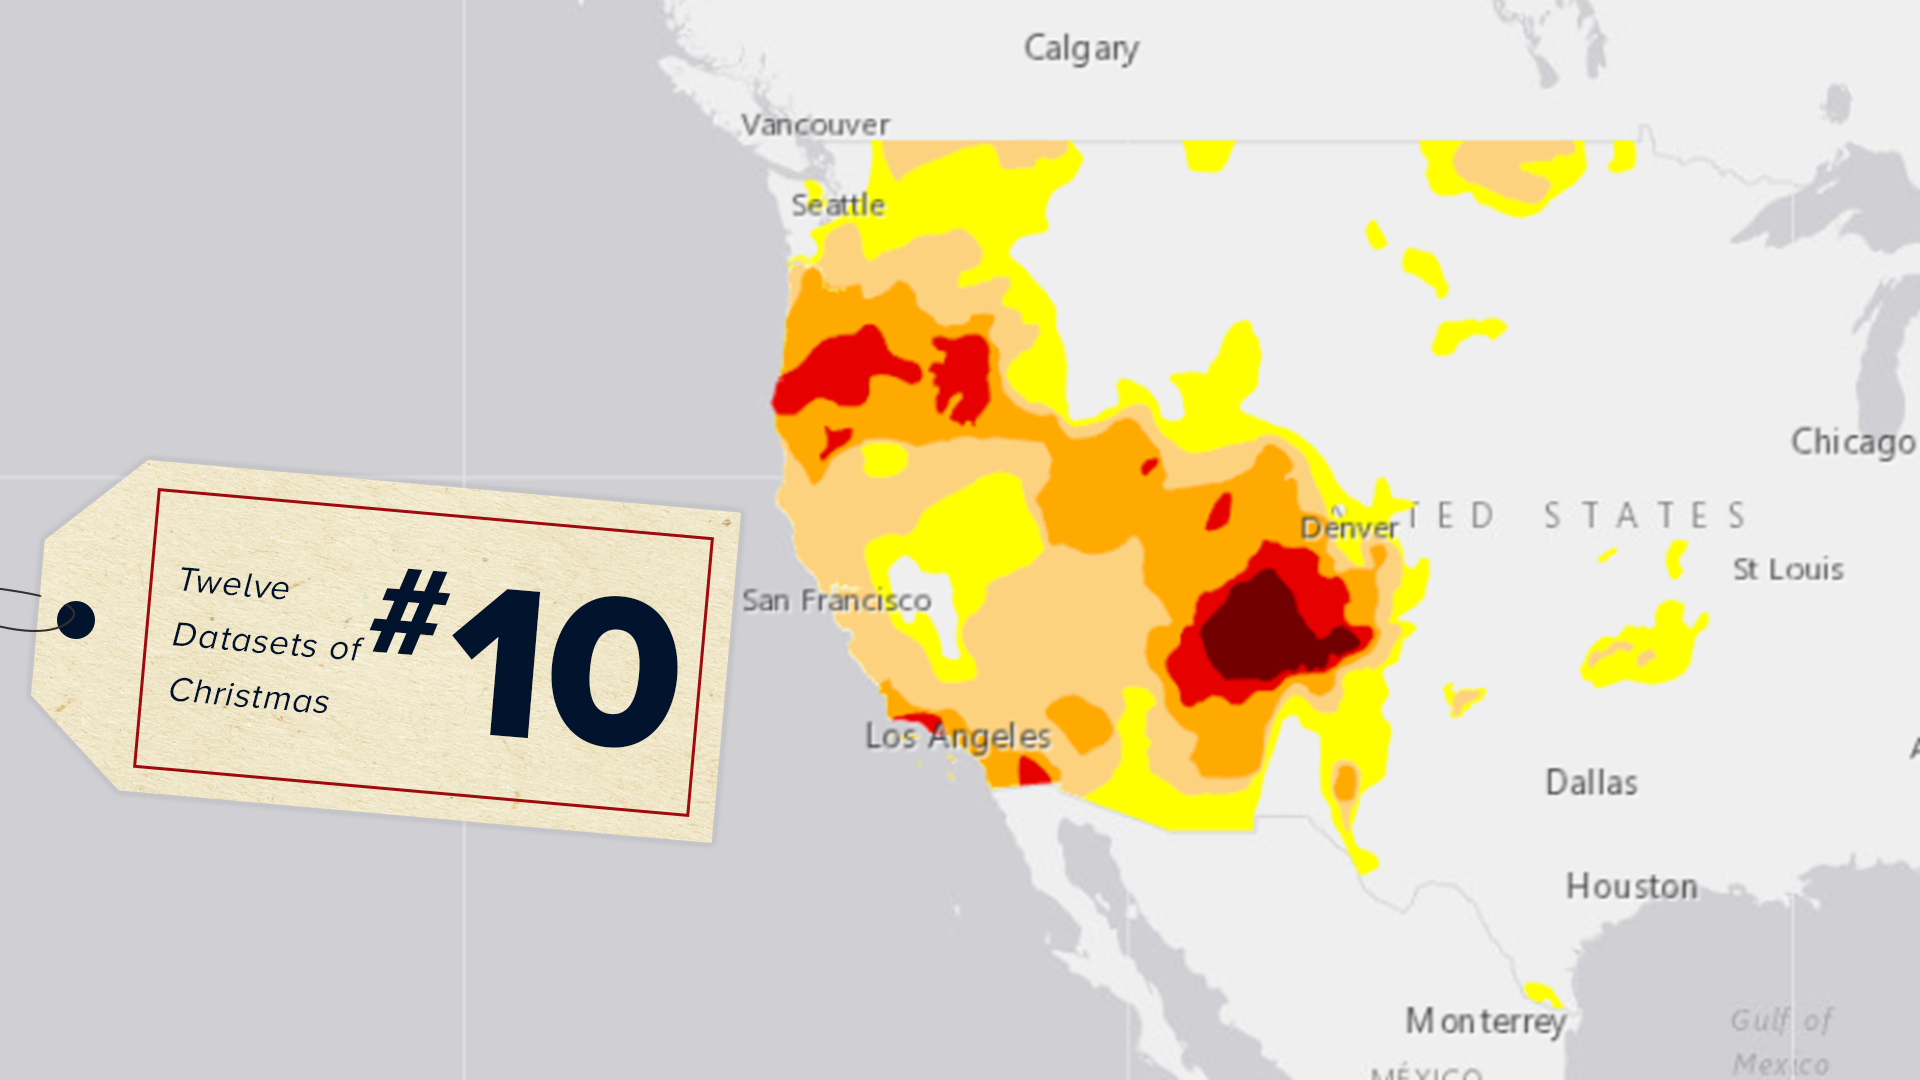 Drought is the second costliest weather disaster in the United States, according to NCEI’s Billion Dollar Disasters calculations. But thanks to data used in the weekly U.S. Drought Monitor (USDM) report, we can better manage the impacts of water shortages.
Ranchers, farmers and federal agencies use the USDM to make timely and critical decisions that can directly affect the success of their operations. Livestock producers monitor drought because it can reduce the quality of pastures. If a drought lasts particularly long and more ranchers are forced to purchase feed for their livestock, the price of feed increases due to high demand. However, the Drought Monitor can help the agricultural sector plan for water shortages that affect livestock and crops.
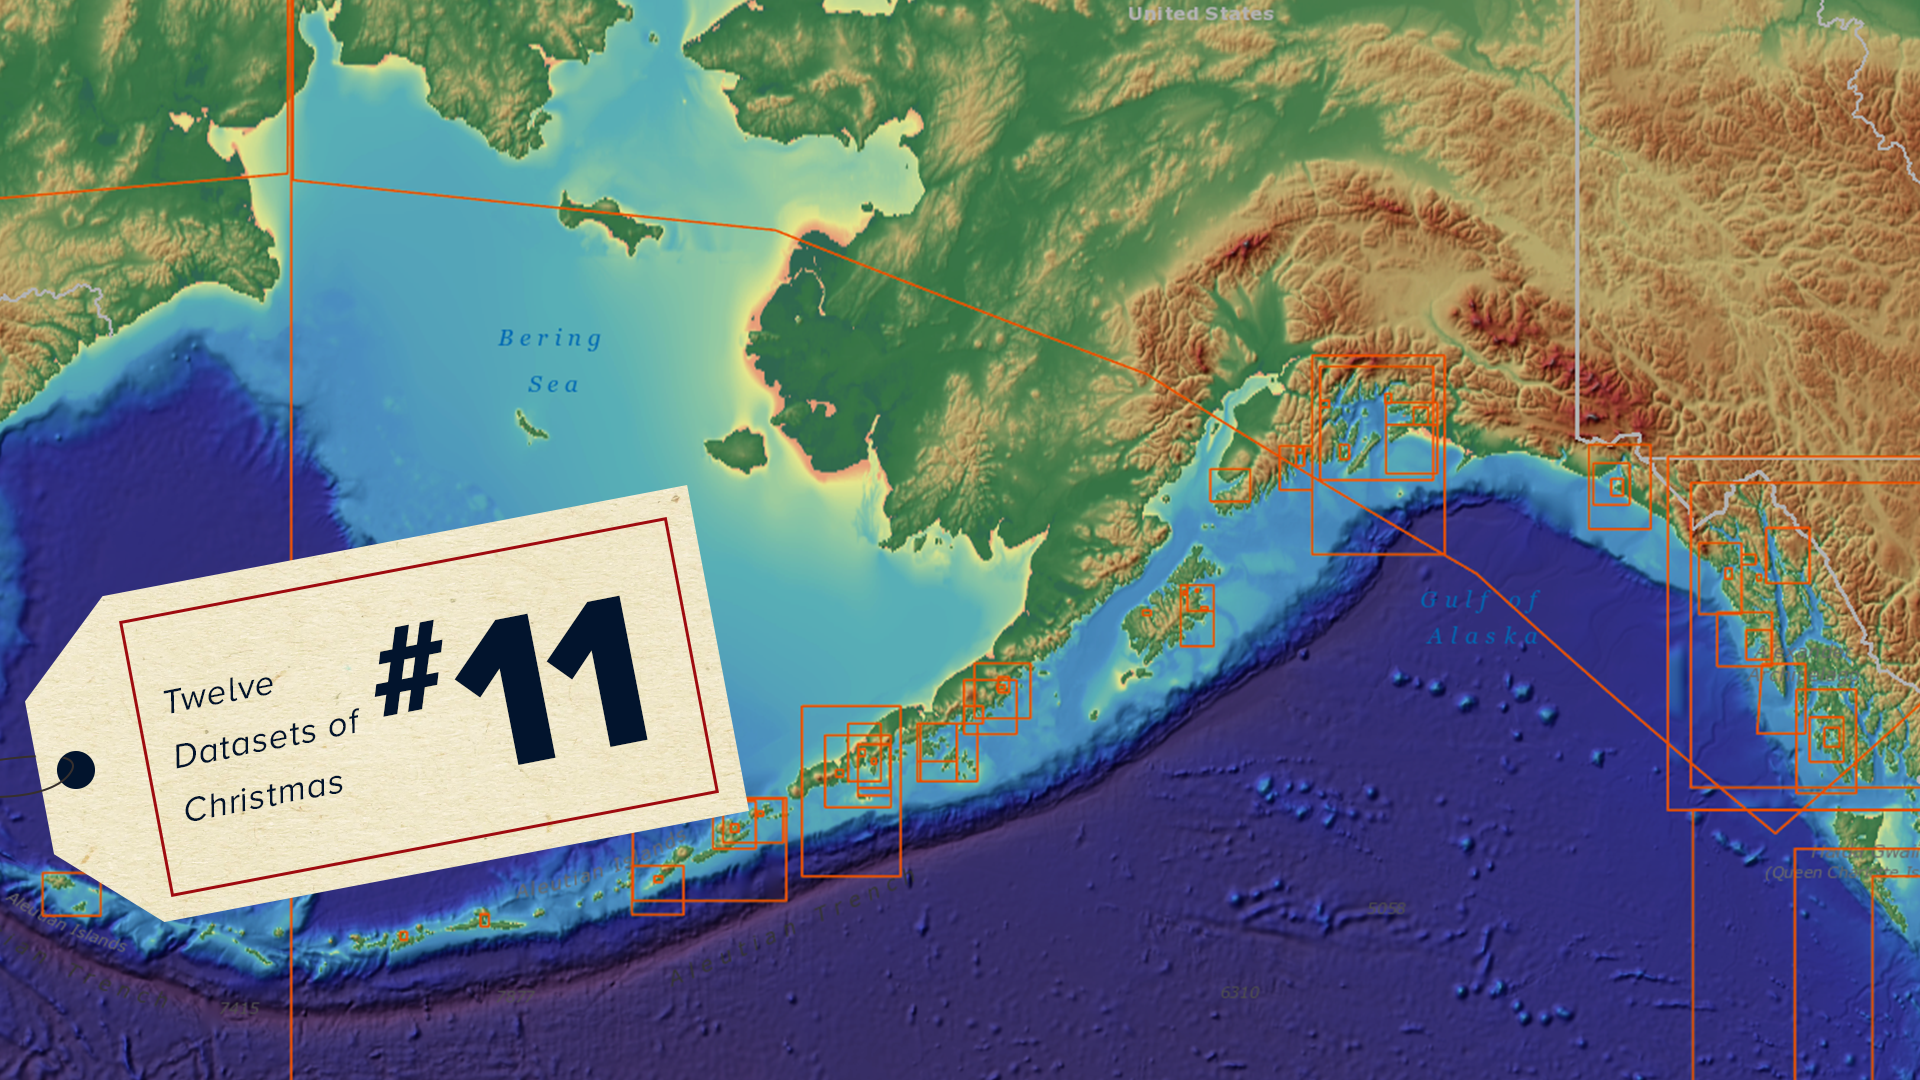 If you’ve ever heard that we know more about the surface of the moon than the ocean floor, it’s true: To date, we’ve mapped less than 20 percent of Earth’s oceans. Even close to our shores, only 50 percent of the world’s coastal waters have ever been surveyed.
NOAA provides a database of digital elevation models (DEMs), which use ocean depth and coastal land elevation data to help us visualize Earth’s land surface and the sea floor in coastal regions. The maps are used to model the impact of coastal flooding from tsunamis, storm surges and sea level rise, and also help us manage coastal habitats and ecosystems.
These models were developed using data from NOAA other federal agencies (including the U.S. Geological Survey and NASA), and all datasets are free and open to the public.
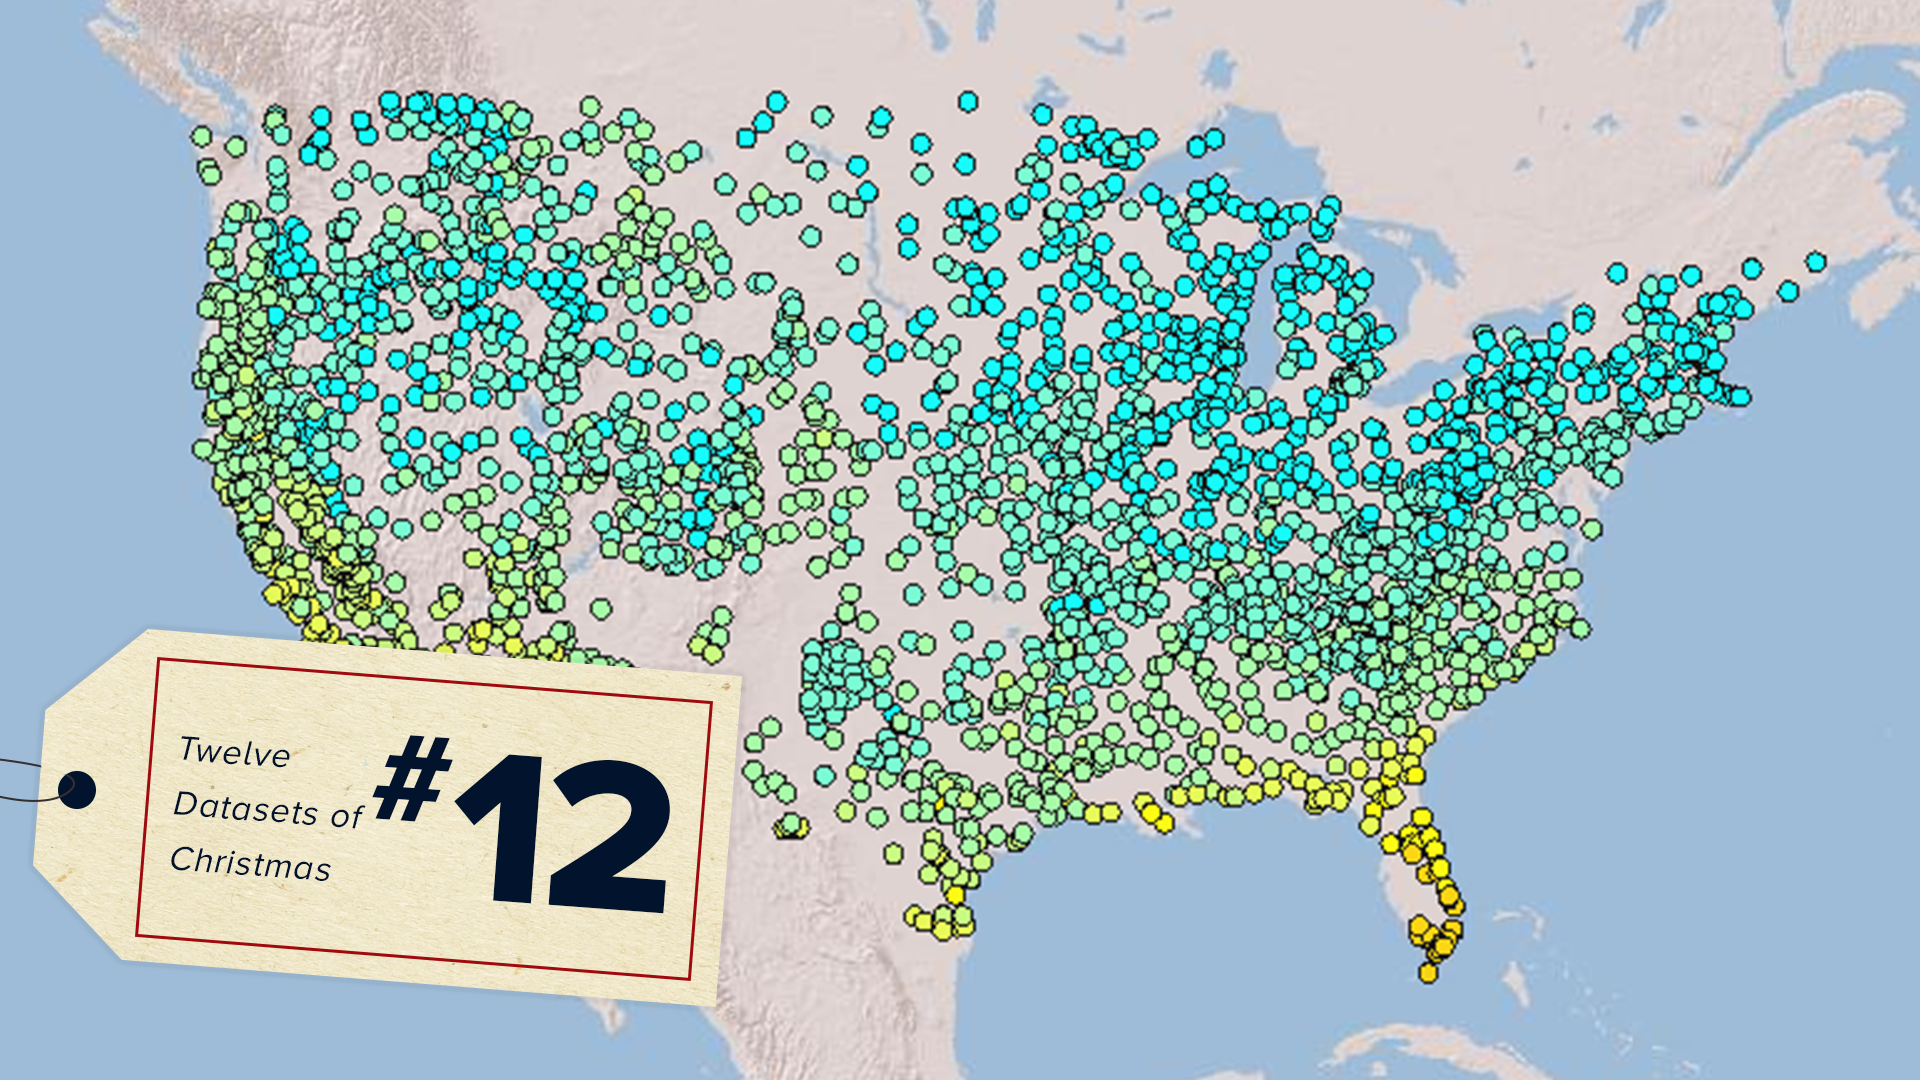 This global database (abbreviated ISD) merges NOAA and U.S. Air Force hourly weather station data from more than 35,000 stations in the U.S. and around the world. Records extend as far back as 1901 and cover all seven continents. Observations such as temperature, precipitation, cloud cover, wind speed, snow depth, and solar radiation are available from more than 14,000 active stations updating daily.
The ISD is used extensively by the utility sector for understanding electricity generation and distribution needs.
Edited for WeatherNation by Meteorologist Mace Michaels
World Magnetic Model
 Earth’s magnetic field has been important to navigation since ancient times. Today, whether we realize it or not, our smartphones rely on magnetic models to get us from point A to point B.
NOAA’s World Magnetic Model (WMM), which is a large-scale representation of the planet’s magnetic field, is used to ensure that both analog and digital magnetic compasses are actually pointing you in the right direction. Satellite data on Earth’s changing magnetic fields help scientists ensure that they are providing the most accurate world magnetic model.
To this day, the WMM is the navigation standard model for the entire U.S. Department of Defense, the North Atlantic Treaty Organization, International Hydrographic Organization, Federal Aviation Administration, consumer electronics (e.g., iOS, Blackberry, Android), and many others.
The Global Historical Climatology Network
Paleoclimate Data
 This may sound a little batty, but bat guano (basically poop that’s accumulated over the years) has helped scientists reconstruct climate conditions from hundreds of years ago.
Paleoclimate scientists, who study substances that accumulate over time, traveled to a place known as Mӑgurici Cave in Romania. A colony of bats has lived there for generations and has left behind droppings on the cave floor for just as long. It may sound gross, but the 9-foot-tall pile of guano that scientists found there was a goldmine in terms of climate data.
Scientists were able to radiocarbon date the guano to determine when certain layers were deposited. Those various layers revealed how temperature, precipitation and the plants growing in the area had changed over hundreds of years.
GOES SUVI Data
 While we know quite a bit about weather here on Earth, there are a lot of questions about space weather that have yet to be answered. The sun is believed to be the main source of space weather, which is why scientists want to understand more about solar activity at different temperatures.
Scientists from NCEI and the Cooperative Institute for Research in Environmental Sciences (CIRES) are working to collect imagery from GOES East’s Solar Ultraviolet Imager (SUVI) instrument, which is a telescope used to monitor solar flares and solar eruptions. These observations can help NOAA’s Space Weather Prediction Centerimprove space weather forecasts and provide early warnings if there are potential impacts to Earth.
OER Video Portal
 This database is a joint initiative between NCEI and the NOAA Office of Ocean Exploration and Research (OER) to archive thousands of hours of video from expeditions conducted aboard the NOAA ship Okeanos Explorer. The underwater footage provides a glimpse of never-before-seen underwater locations, geological features, marine life, and historical artifacts.
When coupled with scientific data, the footage archived in the OER Video Portal can be used to support policy development and resource management decisions.
World Ocean Database
 Did you know NOAA has ocean records dating back to the sailing days of Captain Cook? The World Ocean Database (WOD) contains more than 20,000 datasets measuring sea surface temperature, salinity, nutrients, pH levels, oxygen concentrations, and more. These datasets consist of millions of uniformly formatted records called “profiles,” which are continually updated by about 90 countries around the world. It is the largest publicly available in situ ocean profile database in the world.
The World Ocean Database is widely used by the global oceanography community. Access the data here.
Radar Data
 When a thunderstorm or severe weather strikes, you’ve probably seen those colorful maps that show where the heaviest rain is falling. Thanks to radar (an acronym for radio detection and ranging) we can use radio waves to detect the height, movement and speed of objects – including rain and other precipitation. An antenna transmits pulses of radio waves or microwaves, which bounce off the precipitation in its path, and allow us to measure the intensity of water falling from the sky.
NCEI’s Radar Archive lets you download historical radar data and maps from the Next Generation Weather Radar system (NEXRAD), which are available as a public dataset on Google Cloud. Radar data helps us estimate the location and intensity of rainfall, hail, tornadoes, snowfall and even wind speeds. This information is useful for air traffic control, agriculture, and water management.
U.S. Climate Normals
 Climate normals are long-term averages of historical climate data, such as temperature and precipitation, based on a 30-year reference period (currently 1981–2010). Knowing these averages can tell us how much warmer or cooler, wetter or drier the weather has been lately. This database lets you search more than 9,800 stations across the U.S. to learn about the long-term average climate at any one location and includes a series of interactive maps.
Harmful Algal Blooms Observing System
 Harmful algal blooms (HAB), which happen when colonies of algae grow out of control, have occured in every U.S. coastal and Great Lakes state. HABs are closely monitored because they can be detrimental to the health of humans and marine life.
NCEI keeps track of reported HABs in the Gulf of Mexico with its Harmful Algal BloomS Observing System (HABSOS), which gives environmental managers, scientists and the public a better idea of where HABs are located and how many are happening at a particular time. This dataset, along with satellite imagery, field observations, models, public health reports and buoy data, helps NOAA issue HAB forecasts for coastal communities.
U.S. Drought Monitor
 Drought is the second costliest weather disaster in the United States, according to NCEI’s Billion Dollar Disasters calculations. But thanks to data used in the weekly U.S. Drought Monitor (USDM) report, we can better manage the impacts of water shortages.
Ranchers, farmers and federal agencies use the USDM to make timely and critical decisions that can directly affect the success of their operations. Livestock producers monitor drought because it can reduce the quality of pastures. If a drought lasts particularly long and more ranchers are forced to purchase feed for their livestock, the price of feed increases due to high demand. However, the Drought Monitor can help the agricultural sector plan for water shortages that affect livestock and crops.
Bathymetry Data
 If you’ve ever heard that we know more about the surface of the moon than the ocean floor, it’s true: To date, we’ve mapped less than 20 percent of Earth’s oceans. Even close to our shores, only 50 percent of the world’s coastal waters have ever been surveyed.
NOAA provides a database of digital elevation models (DEMs), which use ocean depth and coastal land elevation data to help us visualize Earth’s land surface and the sea floor in coastal regions. The maps are used to model the impact of coastal flooding from tsunamis, storm surges and sea level rise, and also help us manage coastal habitats and ecosystems.
These models were developed using data from NOAA other federal agencies (including the U.S. Geological Survey and NASA), and all datasets are free and open to the public.
Integrated Surface Database
 This global database (abbreviated ISD) merges NOAA and U.S. Air Force hourly weather station data from more than 35,000 stations in the U.S. and around the world. Records extend as far back as 1901 and cover all seven continents. Observations such as temperature, precipitation, cloud cover, wind speed, snow depth, and solar radiation are available from more than 14,000 active stations updating daily.
The ISD is used extensively by the utility sector for understanding electricity generation and distribution needs.
Edited for WeatherNation by Meteorologist Mace Michaels
All Weather News
More