Where Do We Need Shade? Mapping Urban Heat Islands in Richmond, Virginia
Special Stories
5 Sep 2018 9:41 AM
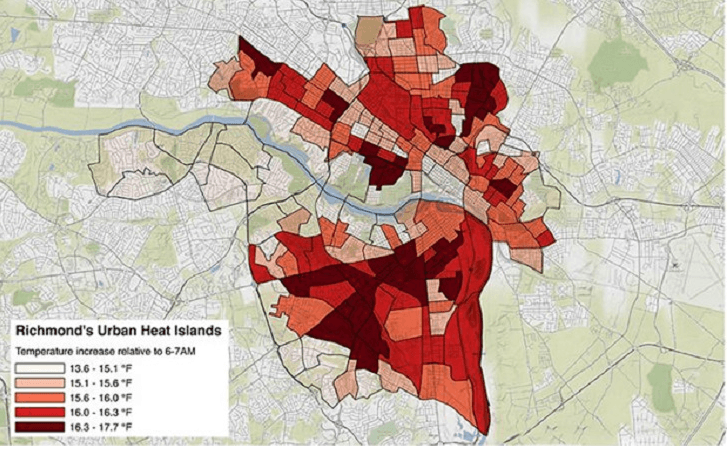
[This map displays the urban heat vulnerability by census block group in Richmond.]
From NOAA by Jeremy Hoffman
Richmond—the capital of Virginia—is situated on the James River amidst the low, rolling hills of the Virginia Piedmont. One of the nation’s oldest cities, Richmond boasts a population of almost 225,000. Walking through this dynamic city yields a wide range of culture, landscape, and temperatures.
Similar to other cities across the mid-Atlantic region, Richmond experiences generally warm and humid summer days. And like other densely populated cities, the city experiences an urban heat island effect: unshaded roads and buildings across the city gain heat through the day and radiate it to the surroundings, increasing air temperature. As a result, highly developed areas experience warmer temperatures than surrounding areas.
While the urban heat island effect is generally described as a city being warmer than the surrounding rural areas, heat intensity can also vary from neighborhood to neighborhood within a city. For example, dark surfaces such as asphalt absorb more heat than lighter surfaces, and built materials such as bricks and concrete absorb more heat than grass and vegetation. This means that some sections of a city will face higher temperatures on hot days than others.
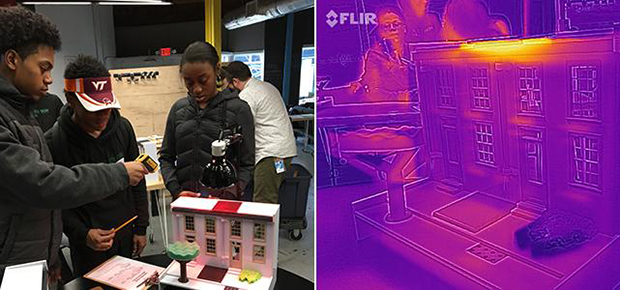
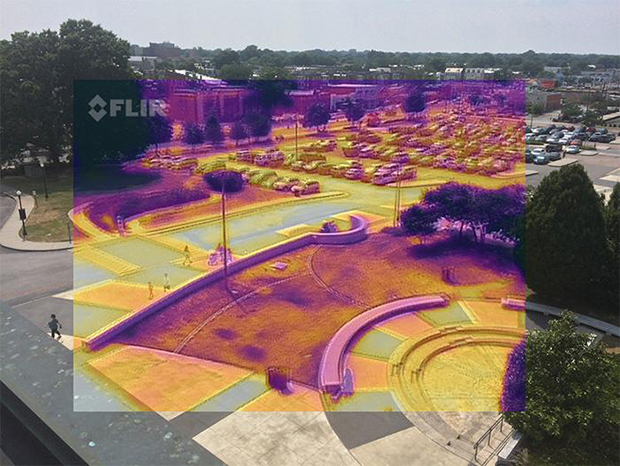 [The inset image, taken with a forward looking infrared (FLIR) camera, shows heat and is overlain on a regular photograph for context. In the FLIR image, lighter or brighter colors indicate warmer areas, while darker areas are cooler.]
Excessive heat is recognized as the greatest weather-related cause of death in the United States (for more information, visit the Extreme Heat—NIHHIS and National Integrated Heat Health Information System pages). On these hotter days, Richmond hospitals see an increase in heat-related emergency room visits.
To identify which Richmond neighborhoods get the hottest during heat waves, and how excessive heat might affect the neighborhoods’ most vulnerable residents, researchers needed to come up with a way to check local temperatures—block by block—across the city.
[The inset image, taken with a forward looking infrared (FLIR) camera, shows heat and is overlain on a regular photograph for context. In the FLIR image, lighter or brighter colors indicate warmer areas, while darker areas are cooler.]
Excessive heat is recognized as the greatest weather-related cause of death in the United States (for more information, visit the Extreme Heat—NIHHIS and National Integrated Heat Health Information System pages). On these hotter days, Richmond hospitals see an increase in heat-related emergency room visits.
To identify which Richmond neighborhoods get the hottest during heat waves, and how excessive heat might affect the neighborhoods’ most vulnerable residents, researchers needed to come up with a way to check local temperatures—block by block—across the city.
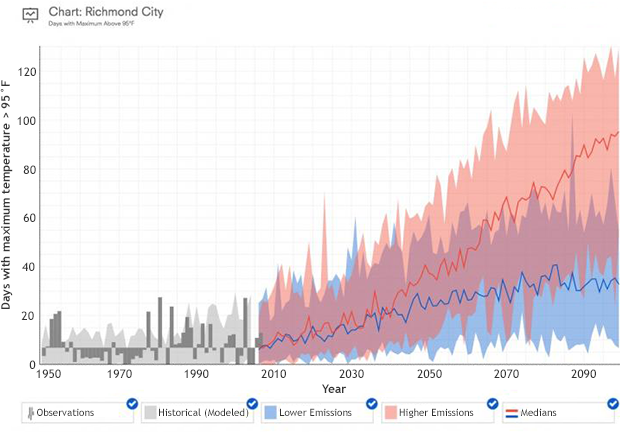 [This graph from the Climate Explorer shows observed and projected annual number of days above 95°F in Richmond. To explore similar data in your location, launch the Climate Explorer tool.]
To assess urban heat in Richmond using methods developed by Shandas and his team at Portland State, they recruited citizen-scientists from several local organizations: students from the University of Richmond and Virginia Commonwealth University; the Virginia Academy of Science; the City of Richmond’s Sustainability Office; and Groundwork RVA, a Richmond nonprofit organization that engages young people with environmental and social issues in their communities.
On July 13, 2017, in the midst of Richmond's first major heat wave of the summer, 15 teams of volunteers spread out through the city in cars and on bikes equipped with simple hand-made devices. Each device was designed to measure air temperature and mark time and location as it was moved along. By recording the temperature every second of each hour-long ride, and plotting those temperatures on a map, data from the devices could be used to generate a map of temperatures along each route over the entire city. Riders and drivers rolled through the heat on their assigned routes three times that day: at 6:00 am, at 3:00 pm, and again at 7:00 pm.
All temperature and location data collected by the teams were fed into an open-source software package developed by Shandas’ team at Portland State. Processing the data this way allows researchers to relate different types of land use to air temperatures, even across areas that weren't directly measured.
[This graph from the Climate Explorer shows observed and projected annual number of days above 95°F in Richmond. To explore similar data in your location, launch the Climate Explorer tool.]
To assess urban heat in Richmond using methods developed by Shandas and his team at Portland State, they recruited citizen-scientists from several local organizations: students from the University of Richmond and Virginia Commonwealth University; the Virginia Academy of Science; the City of Richmond’s Sustainability Office; and Groundwork RVA, a Richmond nonprofit organization that engages young people with environmental and social issues in their communities.
On July 13, 2017, in the midst of Richmond's first major heat wave of the summer, 15 teams of volunteers spread out through the city in cars and on bikes equipped with simple hand-made devices. Each device was designed to measure air temperature and mark time and location as it was moved along. By recording the temperature every second of each hour-long ride, and plotting those temperatures on a map, data from the devices could be used to generate a map of temperatures along each route over the entire city. Riders and drivers rolled through the heat on their assigned routes three times that day: at 6:00 am, at 3:00 pm, and again at 7:00 pm.
All temperature and location data collected by the teams were fed into an open-source software package developed by Shandas’ team at Portland State. Processing the data this way allows researchers to relate different types of land use to air temperatures, even across areas that weren't directly measured.
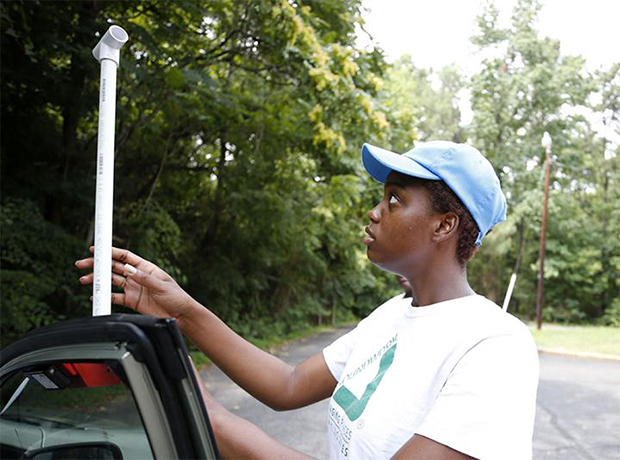 [A youth volunteer from Groundwork RVA attaches a sensor unit onto a car.]
The map below shows differences of up to 16°F across Richmond’s neighborhoods during the hottest part of the day. This means that when a heavily shaded neighborhood in Richmond experiences an afternoon temperature of 87°F, it might reach 103°F in a more urbanized neighborhood in the same city. The data also revealed that warmer areas experienced a greater difference between morning and afternoon temperatures than did cooler areas.
Averaging measurements over census block groups and comparing the results with maps of land use showed that Richmond's warmest neighborhoods were generally those with the highest areas of impermeable surfaces and the lowest areas of tree canopy. These neighborhoods can sometimes be home to families with income levels below the poverty line—who may be more vulnerable to heat issues if they lack air conditioning. Not surprisingly, a review of locations where emergency responders typically respond to heat-related calls for help indicates that they are happening in these hottest areas, where people are most vulnerable.
To quantify levels of urban heat vulnerability in different neighborhoods, researchers combined a range of factors with various weights into an index. Based on measurements of temperature, tree canopy, and concentration of impervious surfaces, and including census data on income levels, they defined a quantitative index that can help identify neighborhoods where residents may be at risk. Areas with a below-average index score show where adaptive action to decrease vulnerability to excessive heat may be most effective. Adaptive actions to consider in these areas might include planting more trees, creating artificial shade structures, or a longer-term strategy of changing building construction requirements.
[A youth volunteer from Groundwork RVA attaches a sensor unit onto a car.]
The map below shows differences of up to 16°F across Richmond’s neighborhoods during the hottest part of the day. This means that when a heavily shaded neighborhood in Richmond experiences an afternoon temperature of 87°F, it might reach 103°F in a more urbanized neighborhood in the same city. The data also revealed that warmer areas experienced a greater difference between morning and afternoon temperatures than did cooler areas.
Averaging measurements over census block groups and comparing the results with maps of land use showed that Richmond's warmest neighborhoods were generally those with the highest areas of impermeable surfaces and the lowest areas of tree canopy. These neighborhoods can sometimes be home to families with income levels below the poverty line—who may be more vulnerable to heat issues if they lack air conditioning. Not surprisingly, a review of locations where emergency responders typically respond to heat-related calls for help indicates that they are happening in these hottest areas, where people are most vulnerable.
To quantify levels of urban heat vulnerability in different neighborhoods, researchers combined a range of factors with various weights into an index. Based on measurements of temperature, tree canopy, and concentration of impervious surfaces, and including census data on income levels, they defined a quantitative index that can help identify neighborhoods where residents may be at risk. Areas with a below-average index score show where adaptive action to decrease vulnerability to excessive heat may be most effective. Adaptive actions to consider in these areas might include planting more trees, creating artificial shade structures, or a longer-term strategy of changing building construction requirements.
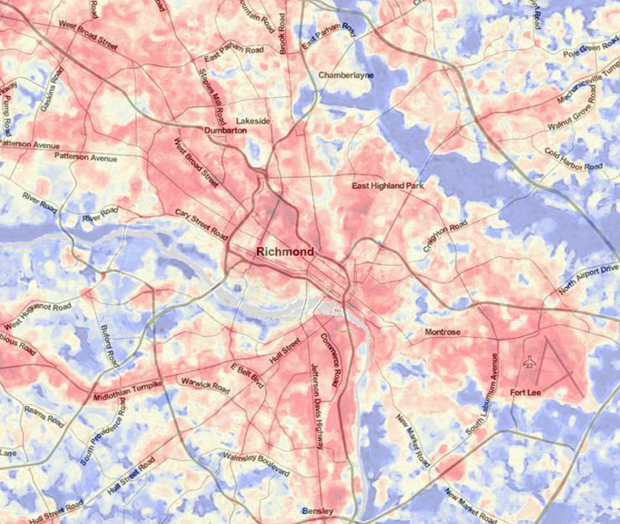 [This map displays temperature data in Richmond from 3:00–4:00 pm on July 13, showing variable heat levels within the city depending on land use.]
 [Students use model homes to investigate differential heating in various surfaces.]
With this hazard and vulnerability information, the next stage of this project—following the Steps to Resilience—will examine mitigation scenarios for providing cool locations in new and existing developments within the hottest parts of the city. The alternative development scenarios can be coupled with other priorities to cool neighborhoods, and ultimately save infrastructure and lives.
Data from this project are currently being used to inform planning phase discussions about Richmond 300, a citywide master plan update; RVA Green 2050, a greenhouse gas emissions reduction plan; and the implementation of RVAH2O, a watershed management program focused on reducing stormwater runoff. Relevant city departments are also committing to collaborations with the Museum for ongoing climate resilience education initiatives and proposals.
With projections of warming summers, the effects of urban heat islands on communities will likely be a growing concern across the country. Richmond’s Urban Heat Vulnerability assessment can be replicated in other locations: it used data records from the National Land Cover Database and the U.S. Census Bureau’s American Community Survey, data available for nearly every city in the United States, and processed that data using open source code in R, a free statistical computation environment.
[Students use model homes to investigate differential heating in various surfaces.]
With this hazard and vulnerability information, the next stage of this project—following the Steps to Resilience—will examine mitigation scenarios for providing cool locations in new and existing developments within the hottest parts of the city. The alternative development scenarios can be coupled with other priorities to cool neighborhoods, and ultimately save infrastructure and lives.
Data from this project are currently being used to inform planning phase discussions about Richmond 300, a citywide master plan update; RVA Green 2050, a greenhouse gas emissions reduction plan; and the implementation of RVAH2O, a watershed management program focused on reducing stormwater runoff. Relevant city departments are also committing to collaborations with the Museum for ongoing climate resilience education initiatives and proposals.
With projections of warming summers, the effects of urban heat islands on communities will likely be a growing concern across the country. Richmond’s Urban Heat Vulnerability assessment can be replicated in other locations: it used data records from the National Land Cover Database and the U.S. Census Bureau’s American Community Survey, data available for nearly every city in the United States, and processed that data using open source code in R, a free statistical computation environment.
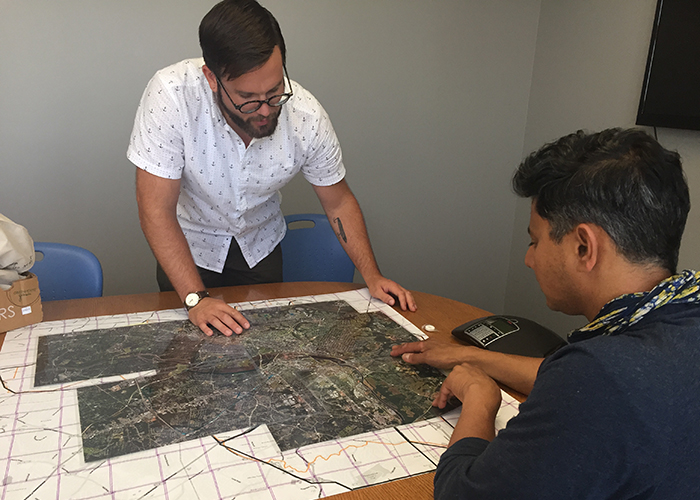 [Jeremy Hoffman, a climate and earth scientist at the Science Museum of Virginia, left, and Vivek Shandas, a professor of urban studies and planning at Portland State University, designed the routes that citizen scientists used to collect heat data for mapping Richmond’s heat islands last summer. Photo courtesy of Jeremy Hoffman.]
All of these elements—from active participation of local citizen-scientists to using open-source software to collect and model data—make the heat mapping research in Richmond applicable to other cities across the United States.
The project has continued this summer in the Baltimore and Washington, D.C. areas. Data has been collected on multiple weeks to study the urban heat island affect in those metropolitan cities.
Edited for WeatherNation by Meteorologist Mace Michaels
[Jeremy Hoffman, a climate and earth scientist at the Science Museum of Virginia, left, and Vivek Shandas, a professor of urban studies and planning at Portland State University, designed the routes that citizen scientists used to collect heat data for mapping Richmond’s heat islands last summer. Photo courtesy of Jeremy Hoffman.]
All of these elements—from active participation of local citizen-scientists to using open-source software to collect and model data—make the heat mapping research in Richmond applicable to other cities across the United States.
The project has continued this summer in the Baltimore and Washington, D.C. areas. Data has been collected on multiple weeks to study the urban heat island affect in those metropolitan cities.
Edited for WeatherNation by Meteorologist Mace Michaels
[The inset image, taken with a forward looking infrared (FLIR) camera, shows heat and is overlain on a regular photograph for context. In the FLIR image, lighter or brighter colors indicate warmer areas, while darker areas are cooler.]
Excessive heat is recognized as the greatest weather-related cause of death in the United States (for more information, visit the Extreme Heat—NIHHIS and National Integrated Heat Health Information System pages). On these hotter days, Richmond hospitals see an increase in heat-related emergency room visits.
To identify which Richmond neighborhoods get the hottest during heat waves, and how excessive heat might affect the neighborhoods’ most vulnerable residents, researchers needed to come up with a way to check local temperatures—block by block—across the city.
Mapping heat islands
Dr. Jeremy Hoffman and Dr. Eugene Maurakis, scientists with the Science Museum of Virginia in Richmond, and Dr. Vivek Shandas, a professor of urban studies and planning at Portland State University, collaborated with Richmond community members, universities, and nonprofits to explore the city’s heat island effect.
[This graph from the Climate Explorer shows observed and projected annual number of days above 95°F in Richmond. To explore similar data in your location, launch the Climate Explorer tool.]
To assess urban heat in Richmond using methods developed by Shandas and his team at Portland State, they recruited citizen-scientists from several local organizations: students from the University of Richmond and Virginia Commonwealth University; the Virginia Academy of Science; the City of Richmond’s Sustainability Office; and Groundwork RVA, a Richmond nonprofit organization that engages young people with environmental and social issues in their communities.
On July 13, 2017, in the midst of Richmond's first major heat wave of the summer, 15 teams of volunteers spread out through the city in cars and on bikes equipped with simple hand-made devices. Each device was designed to measure air temperature and mark time and location as it was moved along. By recording the temperature every second of each hour-long ride, and plotting those temperatures on a map, data from the devices could be used to generate a map of temperatures along each route over the entire city. Riders and drivers rolled through the heat on their assigned routes three times that day: at 6:00 am, at 3:00 pm, and again at 7:00 pm.
All temperature and location data collected by the teams were fed into an open-source software package developed by Shandas’ team at Portland State. Processing the data this way allows researchers to relate different types of land use to air temperatures, even across areas that weren't directly measured.
[A youth volunteer from Groundwork RVA attaches a sensor unit onto a car.]
The map below shows differences of up to 16°F across Richmond’s neighborhoods during the hottest part of the day. This means that when a heavily shaded neighborhood in Richmond experiences an afternoon temperature of 87°F, it might reach 103°F in a more urbanized neighborhood in the same city. The data also revealed that warmer areas experienced a greater difference between morning and afternoon temperatures than did cooler areas.
Averaging measurements over census block groups and comparing the results with maps of land use showed that Richmond's warmest neighborhoods were generally those with the highest areas of impermeable surfaces and the lowest areas of tree canopy. These neighborhoods can sometimes be home to families with income levels below the poverty line—who may be more vulnerable to heat issues if they lack air conditioning. Not surprisingly, a review of locations where emergency responders typically respond to heat-related calls for help indicates that they are happening in these hottest areas, where people are most vulnerable.
To quantify levels of urban heat vulnerability in different neighborhoods, researchers combined a range of factors with various weights into an index. Based on measurements of temperature, tree canopy, and concentration of impervious surfaces, and including census data on income levels, they defined a quantitative index that can help identify neighborhoods where residents may be at risk. Areas with a below-average index score show where adaptive action to decrease vulnerability to excessive heat may be most effective. Adaptive actions to consider in these areas might include planting more trees, creating artificial shade structures, or a longer-term strategy of changing building construction requirements.
[This map displays temperature data in Richmond from 3:00–4:00 pm on July 13, showing variable heat levels within the city depending on land use.]
A community concern
Many of the volunteers who participated in the heat mapping project also plan to be involved in bringing the findings to the public. Project participants are eager to take the next step by reaching out to neighborhoods where residents may be vulnerable to excessive heat events to help them develop tailored adaptation plans. Groundwork RVA Green Team members—comprising local youth—have gained first-hand experience in understanding the way different surfaces absorb heat. In a project dubbed “Throwing Shade in RVA” using model homes in the Franklin Institute’s Ready Row Home exhibit, students used heat sensors and forward looking infrared (FLIR) cameras to measure and visualize heating differences among surfaces of various colors. Focusing on potential solutions that would incorporate the concept of green infrastructure, students designed a shade structure. The Throwing Shade project was partially funded by NOAA's Office of Education Environmental Literacy Program, and the Franklin Institute's Ready Row Home exhibit is provided through the Climate & Urban Systems Partnership, funded by the National Science Foundation.Community-scale adaptation
The ultimate goal of the heat mapping project is to promote the development of community-scale adaptation, and the limited reach of the study is what makes it unique. Satellites can provide a picture of urban heat islands the size of cities and on city surfaces, but those images can't show variations in air temperatures across neighborhoods or on the streets. Conditions in the places where human activity takes place is what matters most in this project. Keeping a strong focus on the human element—on volunteer citizen-scientists, on cars and bikes, in their own city—resulted in a human-relevant and detailed dataset that’s not available from other sources.
[Students use model homes to investigate differential heating in various surfaces.]
With this hazard and vulnerability information, the next stage of this project—following the Steps to Resilience—will examine mitigation scenarios for providing cool locations in new and existing developments within the hottest parts of the city. The alternative development scenarios can be coupled with other priorities to cool neighborhoods, and ultimately save infrastructure and lives.
Data from this project are currently being used to inform planning phase discussions about Richmond 300, a citywide master plan update; RVA Green 2050, a greenhouse gas emissions reduction plan; and the implementation of RVAH2O, a watershed management program focused on reducing stormwater runoff. Relevant city departments are also committing to collaborations with the Museum for ongoing climate resilience education initiatives and proposals.
With projections of warming summers, the effects of urban heat islands on communities will likely be a growing concern across the country. Richmond’s Urban Heat Vulnerability assessment can be replicated in other locations: it used data records from the National Land Cover Database and the U.S. Census Bureau’s American Community Survey, data available for nearly every city in the United States, and processed that data using open source code in R, a free statistical computation environment.
[Jeremy Hoffman, a climate and earth scientist at the Science Museum of Virginia, left, and Vivek Shandas, a professor of urban studies and planning at Portland State University, designed the routes that citizen scientists used to collect heat data for mapping Richmond’s heat islands last summer. Photo courtesy of Jeremy Hoffman.]
All of these elements—from active participation of local citizen-scientists to using open-source software to collect and model data—make the heat mapping research in Richmond applicable to other cities across the United States.
The project has continued this summer in the Baltimore and Washington, D.C. areas. Data has been collected on multiple weeks to study the urban heat island affect in those metropolitan cities.
Edited for WeatherNation by Meteorologist Mace MichaelsAll Weather News
More
Tropical Storm Chantal Forms This Morning
Tropical Storm Chantal has formed, with winds
5 Jul 2025 4:35 PM

Catastrophic Flooding in the Texas Hill Country
Multiple Flash Flood Emergencies were issued
5 Jul 2025 4:35 PM


Severe Storms in the Midwest Continue To Spoil the Holiday Weekend
NORTHERN PLAINS - A frontal system continues
5 Jul 2025 8:30 AM

Near Seasonal Temperatures for Many Come July 4th!
AAA is expecting over 70 million travelers to
4 Jul 2025 10:15 AM


Northwest Heat Met With Thunderstorm Risk
NORTHWEST - Today, portions of Montana are un
3 Jul 2025 12:00 AM