NASA Calculated Heavy Rainfall Leading to California Mudslides
Special Stories
19 Jan 2018 9:43 AM
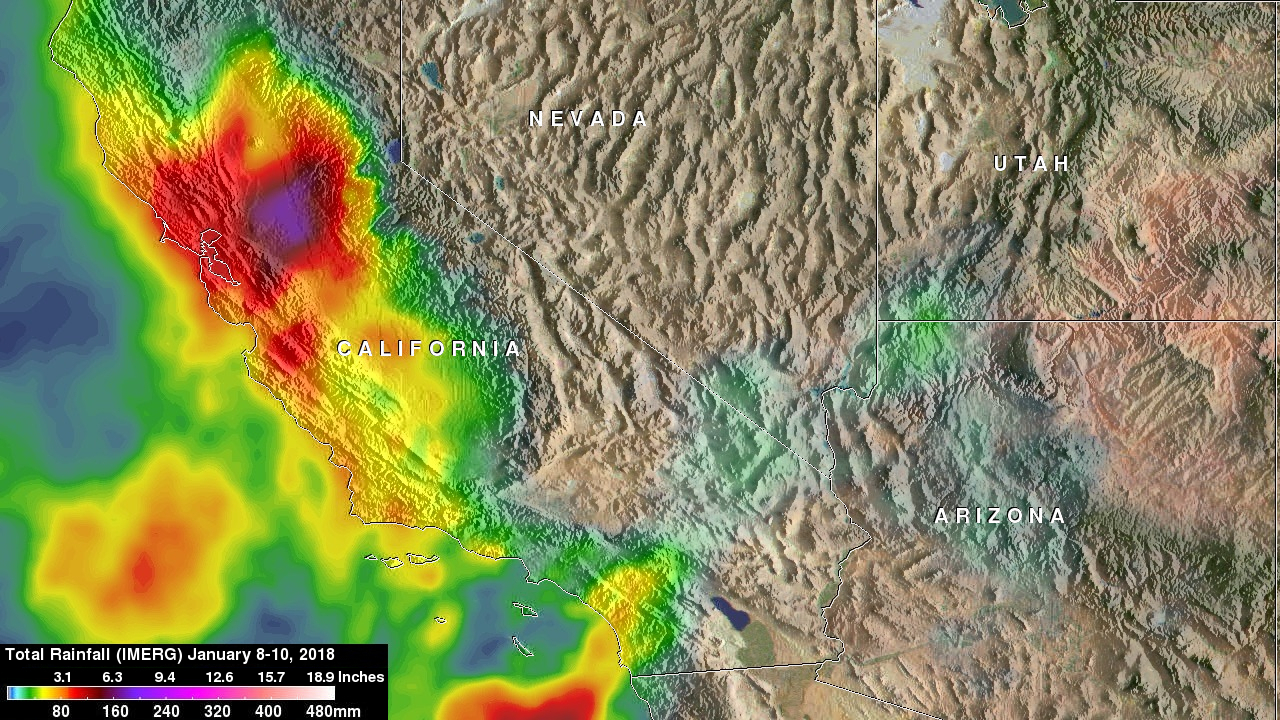
[NASA's IMERG analysis of Jan 8 through 10 revealed that the heaviest rainfall occurred over the Sacramento Valley where over 8 inches were indicated. A rainfall total of 5 inches was reported in Ventura County. Credits: NASA/JAXA/Hal Pierce]
From NASA
Winter rains falling on recently burned ground triggered the deadly mudslides in Santa Barbara County, California on earlier this month. NASA calculated the amount of rain fall between January 8 and 10 and used this data to predicted what areas have the highest potential for landslides.
At NASA's Goddard Space Flight Center in Greenbelt, Maryland, a landslide potential map was generated by the global Landslide Hazard Assessment for Situational Awareness (LHASA) model, a model that combines precipitation data from the Global Precipitation Measurement or GPM mission satellite with a global landslide susceptibility map. LHASA gives a broad overview of landslide hazard in nearly real time, but site-specific information should be obtained prior to emergency operations or building projects.
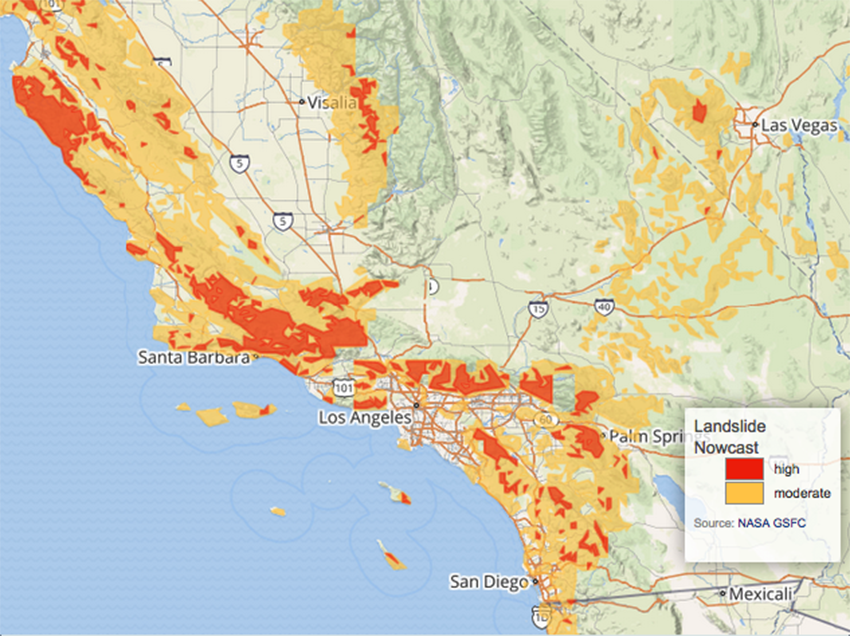 [The landslide potential map was generated by the global Landslide Hazard Assessment for Situational Awareness (LHASA) model. LHASA gives a broad overview of landslide hazard in nearly real time. Credits: NASA]
At least 17 residents of southern California have been killed by the deadly mudslides. A storm moving in from the Pacific Ocean dropped heavy rain over soil that was laid bare by last month's wild fires. Heavy rainfall loosened surface sediments in Santa Barbara County early Tuesday, Jan. 9 caused deadly mudslides. According to the California Department of Transportation parts of US 101, a major highway connecting northern and southern California, was been closed because of mud and debris.
NASA's GPM or Global Precipitation Measurement mission satellite provides information on precipitation from its orbit in space. GPM is a joint mission between NASA and the Japan Aerospace Exploration Agency or JAXA. GPM also utilizes a constellation of other satellites to provide a global analysis of precipitation that are used in rainfall calculations.
https://twitter.com/WeatherNation/status/954137127758979072
At NASA Goddard, a rainfall analysis was constructed using NASA's Integrated Multi-satellitE Retrievals for GPM (IMERG) data. Precipitation data acquired from satellites in the GPM Constellation during the period from January 8 to 10 were used in creating a rainfall accumulation map. The analysis showed the heavy rainfall that occurred over California during the past three days.
The IMERG analysis revealed that the heaviest rainfall occurred over the Sacramento Valley where over 8 inches were indicated. Southern California had heavy rainfall but the effects of the drenching rain was magnified by the bare soil left by last month's wildfires. A rainfall total of 5 inches was reported in Ventura County.
[The landslide potential map was generated by the global Landslide Hazard Assessment for Situational Awareness (LHASA) model. LHASA gives a broad overview of landslide hazard in nearly real time. Credits: NASA]
At least 17 residents of southern California have been killed by the deadly mudslides. A storm moving in from the Pacific Ocean dropped heavy rain over soil that was laid bare by last month's wild fires. Heavy rainfall loosened surface sediments in Santa Barbara County early Tuesday, Jan. 9 caused deadly mudslides. According to the California Department of Transportation parts of US 101, a major highway connecting northern and southern California, was been closed because of mud and debris.
NASA's GPM or Global Precipitation Measurement mission satellite provides information on precipitation from its orbit in space. GPM is a joint mission between NASA and the Japan Aerospace Exploration Agency or JAXA. GPM also utilizes a constellation of other satellites to provide a global analysis of precipitation that are used in rainfall calculations.
https://twitter.com/WeatherNation/status/954137127758979072
At NASA Goddard, a rainfall analysis was constructed using NASA's Integrated Multi-satellitE Retrievals for GPM (IMERG) data. Precipitation data acquired from satellites in the GPM Constellation during the period from January 8 to 10 were used in creating a rainfall accumulation map. The analysis showed the heavy rainfall that occurred over California during the past three days.
The IMERG analysis revealed that the heaviest rainfall occurred over the Sacramento Valley where over 8 inches were indicated. Southern California had heavy rainfall but the effects of the drenching rain was magnified by the bare soil left by last month's wildfires. A rainfall total of 5 inches was reported in Ventura County.
 For information from Santa Barbara County, visit: https://www.countyofsb.org/ and for information about the road closures, visit the California Department of Transportation: http://www.dot.ca.gov/
Edited for WeatherNation by Meteorologist Mace Michaels
For information from Santa Barbara County, visit: https://www.countyofsb.org/ and for information about the road closures, visit the California Department of Transportation: http://www.dot.ca.gov/
Edited for WeatherNation by Meteorologist Mace Michaels
[The landslide potential map was generated by the global Landslide Hazard Assessment for Situational Awareness (LHASA) model. LHASA gives a broad overview of landslide hazard in nearly real time. Credits: NASA]
At least 17 residents of southern California have been killed by the deadly mudslides. A storm moving in from the Pacific Ocean dropped heavy rain over soil that was laid bare by last month's wild fires. Heavy rainfall loosened surface sediments in Santa Barbara County early Tuesday, Jan. 9 caused deadly mudslides. According to the California Department of Transportation parts of US 101, a major highway connecting northern and southern California, was been closed because of mud and debris.
NASA's GPM or Global Precipitation Measurement mission satellite provides information on precipitation from its orbit in space. GPM is a joint mission between NASA and the Japan Aerospace Exploration Agency or JAXA. GPM also utilizes a constellation of other satellites to provide a global analysis of precipitation that are used in rainfall calculations.
https://twitter.com/WeatherNation/status/954137127758979072
At NASA Goddard, a rainfall analysis was constructed using NASA's Integrated Multi-satellitE Retrievals for GPM (IMERG) data. Precipitation data acquired from satellites in the GPM Constellation during the period from January 8 to 10 were used in creating a rainfall accumulation map. The analysis showed the heavy rainfall that occurred over California during the past three days.
The IMERG analysis revealed that the heaviest rainfall occurred over the Sacramento Valley where over 8 inches were indicated. Southern California had heavy rainfall but the effects of the drenching rain was magnified by the bare soil left by last month's wildfires. A rainfall total of 5 inches was reported in Ventura County.
For information from Santa Barbara County, visit: https://www.countyofsb.org/ and for information about the road closures, visit the California Department of Transportation: http://www.dot.ca.gov/
Edited for WeatherNation by Meteorologist Mace MichaelsAll Weather News
More
Severe Storms Target the Midwest to the Northeast
UPPER MIDWEST - Dangerous tornadoes have alre
28 Jul 2026 1:45 AM

Tropics: Fausto Heads towards Hawaii; Genevieve Cat 4 Hurricane
PacificHurricane Fausto continues to track we
28 Jul 2026 1:45 AM


Southeast Flood Risk Lingers Near Stalled Front
A stalled boundary over the Southeast will ke
25 Jul 2026 10:55 AM

Another Round of Storms Targets the Northeast
Tuesday brought severe weather again across p
23 Jul 2026 1:15 AM

Another Round of Severe Weather for the Upper Midwest and Great Lakes
The upper-level low train continues to keep t
21 Jul 2026 1:45 AM