A Guide to Understanding Satellite Images of Hurricanes
Special Stories
23 Oct 2019 2:00 AM
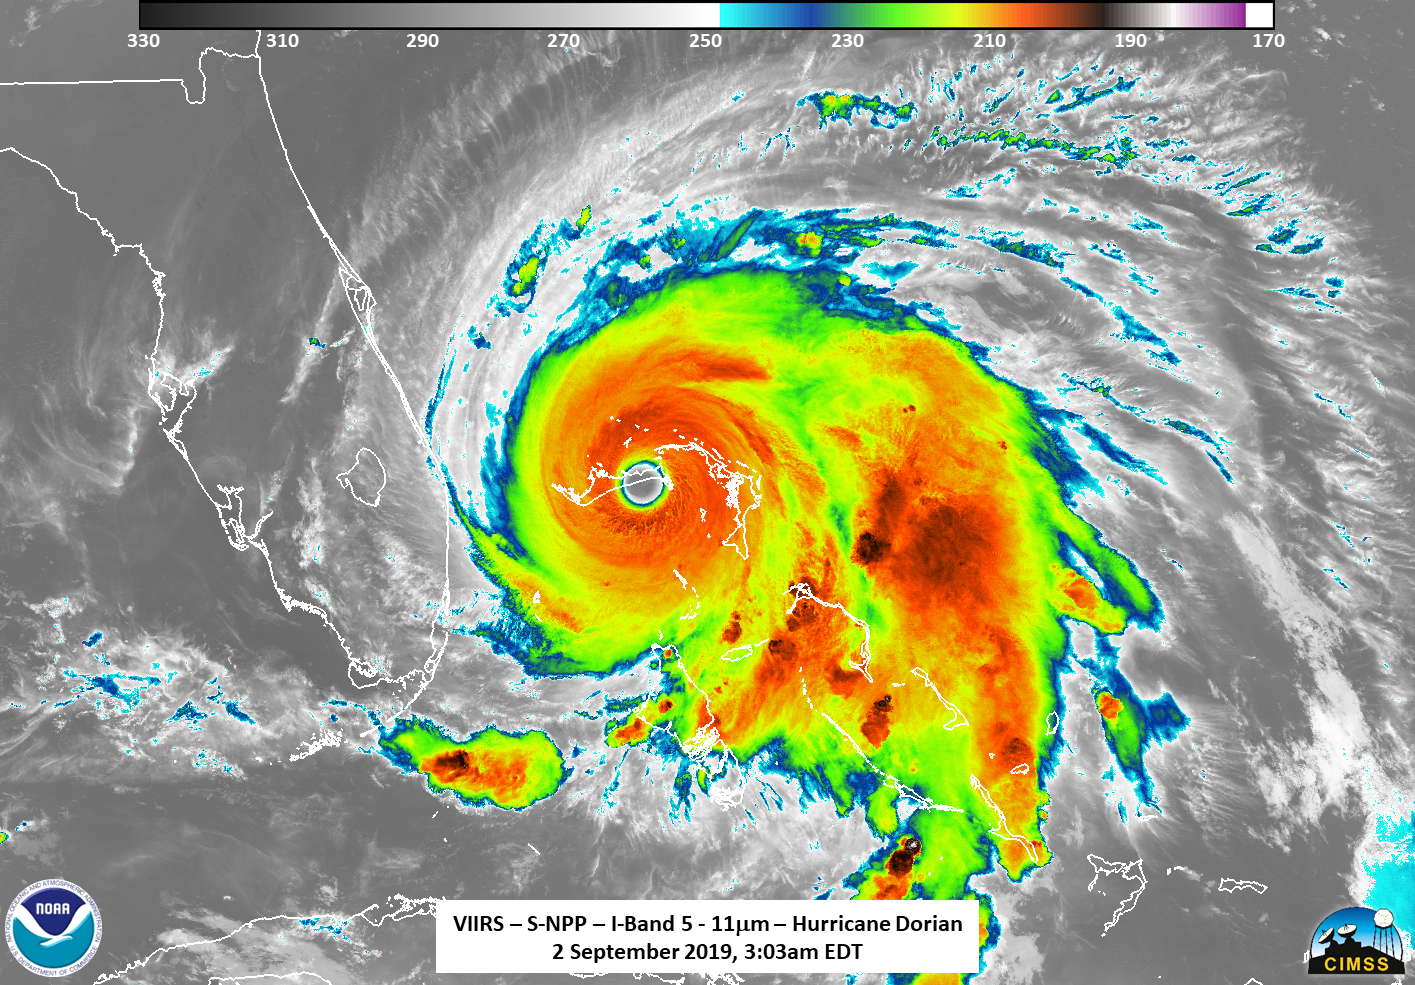
[NOAA] On the morning of September 2, 2019, as a devastating Hurricane Dorian made landfall over three islands in the Bahamas, delivering torrential rain and sustained winds of 185 miles per hour, the VIIRS instruments on the NOAA-20 and NASA-NOAA Suomi-NPP (S-NPP) satellites captured infrared pictures from above. These images, caught at 2:13 am ET and 3:03 am ET respectively, showed a circular eye inside a nearly perfectly symmetrical Category-5 storm.
 The world watched that week as Dorian slammed into the Bahamas and then stalled for more than 36 hours, leaving at least 61 people dead and 70,000 homeless. It was the strongest storm on record to hit the island nation.
During a hurricane, instruments on NOAA-20 and S-NPP capture data twice a day. These data are converted into brightly colored pictures that reveal the structure, intensity and temperature of a storm, along with other features, such as lightning and gravity waves.
NOAA’s GOES East and West satellites also show the storm’s evolution by measuring infrared and visible radiation from the atmosphere and surface in real-time. These measurements tell us about wind at various levels in the atmosphere, sea surface temperatures and cloud properties.
“The imagery is fundamental to locating where the storm is, knowing what direction it’s moving and estimating its strength,” said Mark DeMaria, technology and science branch chief at NOAA’s National Hurricane Center in Miami, Fla.
During major storms, it’s common for these images to circulate on social media and surface in news articles and on television reports. But without the trained eye of a meteorologist, it can be a challenge for most people to know what to make of them. Using a series of images from Hurricane Dorian, we’ve created this guide.
The world watched that week as Dorian slammed into the Bahamas and then stalled for more than 36 hours, leaving at least 61 people dead and 70,000 homeless. It was the strongest storm on record to hit the island nation.
During a hurricane, instruments on NOAA-20 and S-NPP capture data twice a day. These data are converted into brightly colored pictures that reveal the structure, intensity and temperature of a storm, along with other features, such as lightning and gravity waves.
NOAA’s GOES East and West satellites also show the storm’s evolution by measuring infrared and visible radiation from the atmosphere and surface in real-time. These measurements tell us about wind at various levels in the atmosphere, sea surface temperatures and cloud properties.
“The imagery is fundamental to locating where the storm is, knowing what direction it’s moving and estimating its strength,” said Mark DeMaria, technology and science branch chief at NOAA’s National Hurricane Center in Miami, Fla.
During major storms, it’s common for these images to circulate on social media and surface in news articles and on television reports. But without the trained eye of a meteorologist, it can be a challenge for most people to know what to make of them. Using a series of images from Hurricane Dorian, we’ve created this guide.
 “If you start to see that more uniform “donut shape” in the clouds suddenly shift to being sort of a crescent shape, that’s usually an indication that the wind shear is increasing,” Braun said.
At the time the Sept. 6 image above was taken, the storm was experiencing an increase in wind shear and crossing into cooler waters, Straka said. You can see a ragged eye and a drop in symmetry compared to the earlier image.
A hurricane that encounters strong shear can drop in intensity by as much as 35 mph or more in the span of a day. This is known as rapid weakening. That decrease can be equivalent to one or more categories on the Saffir-Simpson hurricane intensity scale, Braun said.
But the opposite is also true. A jump in 35 mph or more in less than 24 hours is considered rapid intensification. “What most often leads to rapid intensification is movement of a storm over a deep layer of warm waters, and a decrease in wind shear,” Braun said.
With Dorian, rapid intensification occurred twice: Once between Aug 30 and 31, when winds jumped from 105 mph to 140 mph. And then it happened again the next day. On Sept 1, the same day the storm made landfall on Grand Bahama Island, winds surged from 150 mph to 185 mph in only nine hours.
One of the most surprising aspects of Dorian, DeMaria said, was its ability to maintain its strength while stalled over the Bahamas.
“That is very unusual because stationary or very slow moving tropical cyclones usually mix with the upper ocean, cooling the sea surface temperature, which leads to weakening,” he said. “Dorian was able to maintain category 5 intensity while it was stationary.”
“If you start to see that more uniform “donut shape” in the clouds suddenly shift to being sort of a crescent shape, that’s usually an indication that the wind shear is increasing,” Braun said.
At the time the Sept. 6 image above was taken, the storm was experiencing an increase in wind shear and crossing into cooler waters, Straka said. You can see a ragged eye and a drop in symmetry compared to the earlier image.
A hurricane that encounters strong shear can drop in intensity by as much as 35 mph or more in the span of a day. This is known as rapid weakening. That decrease can be equivalent to one or more categories on the Saffir-Simpson hurricane intensity scale, Braun said.
But the opposite is also true. A jump in 35 mph or more in less than 24 hours is considered rapid intensification. “What most often leads to rapid intensification is movement of a storm over a deep layer of warm waters, and a decrease in wind shear,” Braun said.
With Dorian, rapid intensification occurred twice: Once between Aug 30 and 31, when winds jumped from 105 mph to 140 mph. And then it happened again the next day. On Sept 1, the same day the storm made landfall on Grand Bahama Island, winds surged from 150 mph to 185 mph in only nine hours.
One of the most surprising aspects of Dorian, DeMaria said, was its ability to maintain its strength while stalled over the Bahamas.
“That is very unusual because stationary or very slow moving tropical cyclones usually mix with the upper ocean, cooling the sea surface temperature, which leads to weakening,” he said. “Dorian was able to maintain category 5 intensity while it was stationary.”
 In its early stages, a storm is less defined, consisting mostly of cloud cover and no obvious eye. But as wind speeds rise, you start getting a stronger, rising motion in the growing wall of clouds that forms around the eye.
In the lower atmosphere, known as the troposphere, air gets colder with height until it reaches the stratosphere, where the trend reverses and air begins warming with height. Inside a thunderstorm, air rises, as long as it is warmer than the colder, denser air around it, until it reaches an equilibrium and then begins spreading outward.
That outward-spreading air causes surrounding air to sink, both inside and outside of the eye wall. And as the air inside the eye sinks, it dries and warms, evaporating the clouds and clearing out the center.
“So it becomes this loop, where the air coming in near the surface accelerates the spinning winds, drives a stronger vertical circulation, increases the sinking motion in the eye, increases the warming, and further clears out the eye,” Braun said. “When you get a major storm like Dorian, eventually you get to the point where it’s so strong and it’s driving such strong, sinking motion in the eye, that you get the really well-defined eye in satellite imagery.
Since circulation surrounding the eye is an indicator of the storm’s strength, Straka said it’s also important to pay attention to whether the eye is exposed. “If it’s exposed, that means there’s dry air in it, and it could be weakening,” Straka said. Dry air saps the storm of the moisture it needs to thrive.
In its early stages, a storm is less defined, consisting mostly of cloud cover and no obvious eye. But as wind speeds rise, you start getting a stronger, rising motion in the growing wall of clouds that forms around the eye.
In the lower atmosphere, known as the troposphere, air gets colder with height until it reaches the stratosphere, where the trend reverses and air begins warming with height. Inside a thunderstorm, air rises, as long as it is warmer than the colder, denser air around it, until it reaches an equilibrium and then begins spreading outward.
That outward-spreading air causes surrounding air to sink, both inside and outside of the eye wall. And as the air inside the eye sinks, it dries and warms, evaporating the clouds and clearing out the center.
“So it becomes this loop, where the air coming in near the surface accelerates the spinning winds, drives a stronger vertical circulation, increases the sinking motion in the eye, increases the warming, and further clears out the eye,” Braun said. “When you get a major storm like Dorian, eventually you get to the point where it’s so strong and it’s driving such strong, sinking motion in the eye, that you get the really well-defined eye in satellite imagery.
Since circulation surrounding the eye is an indicator of the storm’s strength, Straka said it’s also important to pay attention to whether the eye is exposed. “If it’s exposed, that means there’s dry air in it, and it could be weakening,” Straka said. Dry air saps the storm of the moisture it needs to thrive.
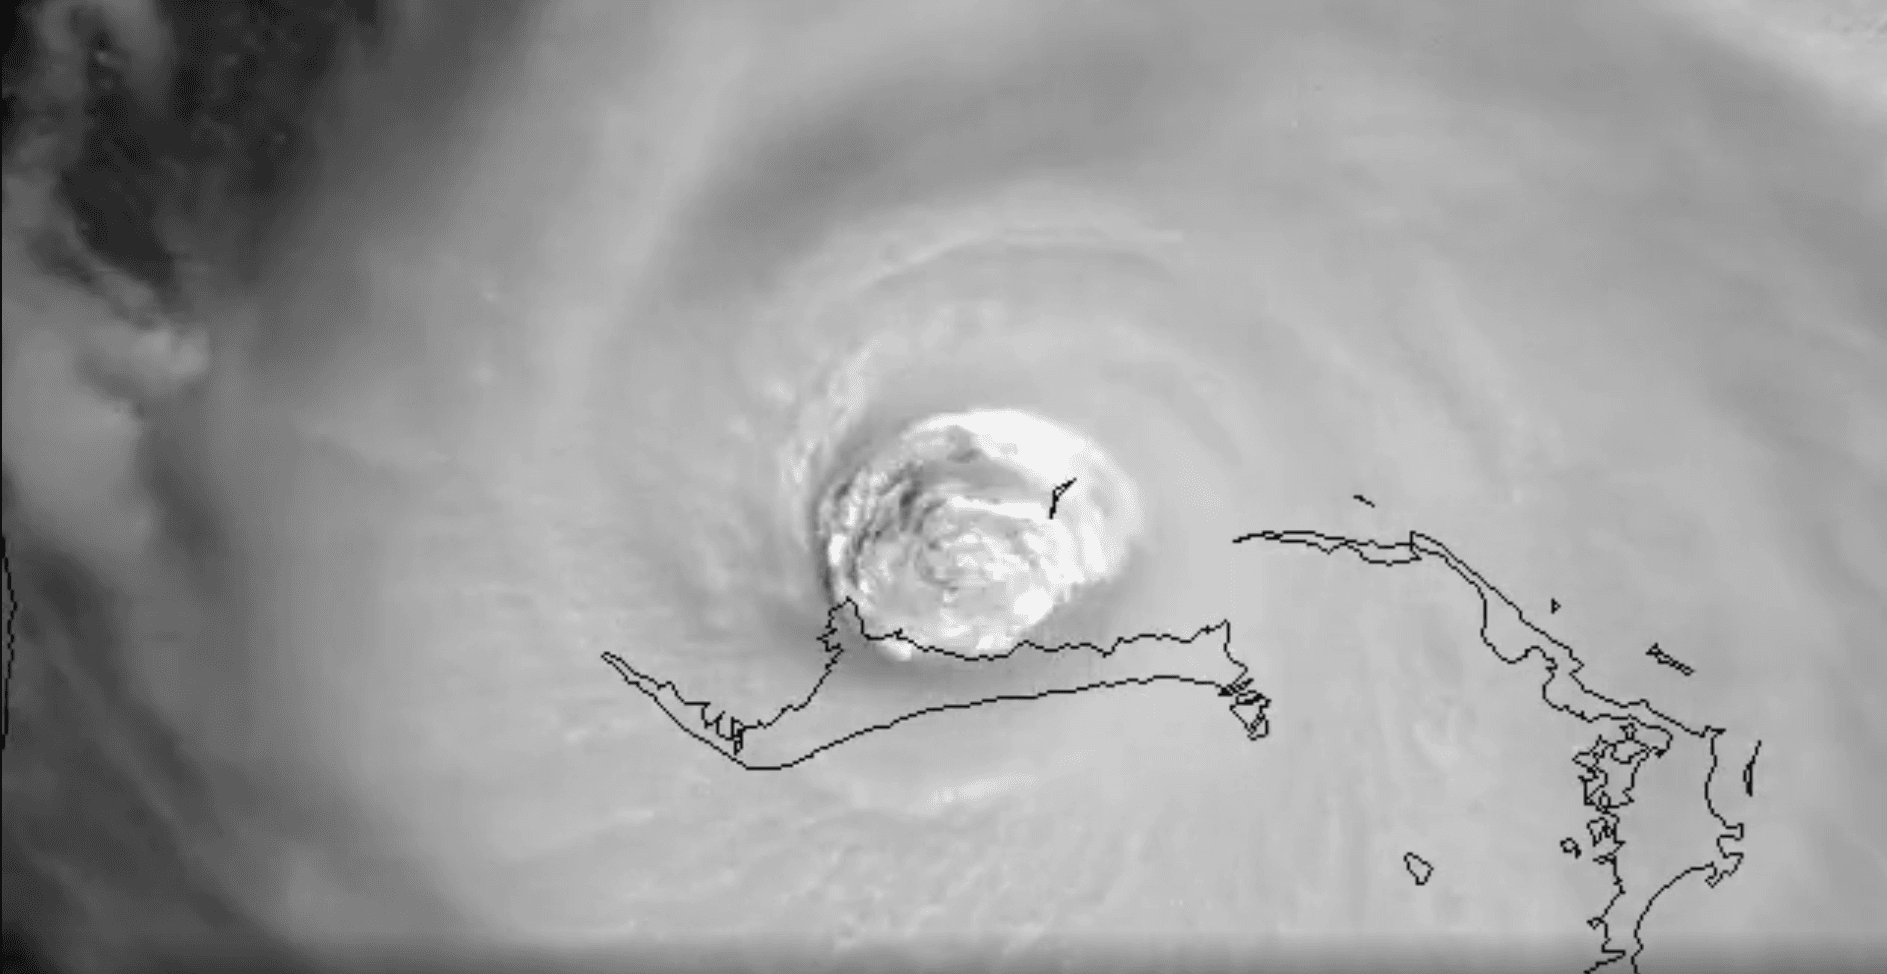
 When a storm’s eye is obscured by clouds, meteorologists use microwave imagery to see the eye, because the microwave can penetrate the clouds. See, for example, this image, captured from the Advanced Microwave Scanning Radiometer, or AMSR2 instrument, aboard JAXA’s GCOM-W1 satellite. “Microwave imagery is very important because it provides early information on whether a tropical storm is intensifying,” said Mitch Goldberg, NOAA program scientist for the Joint Polar Satellite System.
 Gravity waves, (not to be confused with ripples in space-time known as “gravitational waves”) distribute energy and momentum throughout the atmosphere. The more intense the storm, the greater the amount of energy that is transferred. These waves exist all the time, even on clear days, and waves in the troposphere can often be seen in the infrared and visible imagery. However, strong convection from storms can cause a bunch of energy to be released, which is then transferred to the upper atmosphere.
The most intense storms (as well as violent volcanic eruptions) have enough force to generate mesospheric gravity waves, noted in the image above. These are gravity waves near the mesopause, the boundary between the mesosphere and the thermosphere, where Earth’s atmosphere meets space.
Strong storms with a well-defined eye can easily be tracked in the GOES visible imagery during the day and infrared imagery at night. However, weaker storms don’t always have an eye and are more difficult to track, especially at night, when the visible imagery from GOES is not available. The Day/Night band can detect very small amounts of visible radiation, such as that reflected from moonlight at night. Thus, VIIRS can also help forecasters determine the storm’s center at night for these weaker storms, DeMaria said.
“Knowing where the center is, that’s the starting point for our forecast,” he said.
Gravity waves, (not to be confused with ripples in space-time known as “gravitational waves”) distribute energy and momentum throughout the atmosphere. The more intense the storm, the greater the amount of energy that is transferred. These waves exist all the time, even on clear days, and waves in the troposphere can often be seen in the infrared and visible imagery. However, strong convection from storms can cause a bunch of energy to be released, which is then transferred to the upper atmosphere.
The most intense storms (as well as violent volcanic eruptions) have enough force to generate mesospheric gravity waves, noted in the image above. These are gravity waves near the mesopause, the boundary between the mesosphere and the thermosphere, where Earth’s atmosphere meets space.
Strong storms with a well-defined eye can easily be tracked in the GOES visible imagery during the day and infrared imagery at night. However, weaker storms don’t always have an eye and are more difficult to track, especially at night, when the visible imagery from GOES is not available. The Day/Night band can detect very small amounts of visible radiation, such as that reflected from moonlight at night. Thus, VIIRS can also help forecasters determine the storm’s center at night for these weaker storms, DeMaria said.
“Knowing where the center is, that’s the starting point for our forecast,” he said.
 Colder cloud-top temperatures often indicate that the clouds are deep and that the thunderstorm is intense. It’s typical to see colder temperatures in the eye wall and warmer temperatures around the edges of the storm.
Color, like shape, also often corresponds with wind speeds. It can provide clues about the health of the storm’s convection, Straka said. Black and red, marked above, means the clouds are cold and the convection runs deep. In other words, these colors indicate more intense thunderstorms.
Colder cloud-top temperatures often indicate that the clouds are deep and that the thunderstorm is intense. It’s typical to see colder temperatures in the eye wall and warmer temperatures around the edges of the storm.
Color, like shape, also often corresponds with wind speeds. It can provide clues about the health of the storm’s convection, Straka said. Black and red, marked above, means the clouds are cold and the convection runs deep. In other words, these colors indicate more intense thunderstorms.
The world watched that week as Dorian slammed into the Bahamas and then stalled for more than 36 hours, leaving at least 61 people dead and 70,000 homeless. It was the strongest storm on record to hit the island nation.
During a hurricane, instruments on NOAA-20 and S-NPP capture data twice a day. These data are converted into brightly colored pictures that reveal the structure, intensity and temperature of a storm, along with other features, such as lightning and gravity waves.
NOAA’s GOES East and West satellites also show the storm’s evolution by measuring infrared and visible radiation from the atmosphere and surface in real-time. These measurements tell us about wind at various levels in the atmosphere, sea surface temperatures and cloud properties.
“The imagery is fundamental to locating where the storm is, knowing what direction it’s moving and estimating its strength,” said Mark DeMaria, technology and science branch chief at NOAA’s National Hurricane Center in Miami, Fla.
During major storms, it’s common for these images to circulate on social media and surface in news articles and on television reports. But without the trained eye of a meteorologist, it can be a challenge for most people to know what to make of them. Using a series of images from Hurricane Dorian, we’ve created this guide.
Hurricane 101
First, some basics on hurricanes. A tropical cyclone, known as a hurricane in the Atlantic, a typhoon in the Pacific and a cyclone in the southern hemisphere and Indian Oceans, typically begins as a cluster of thunderstorms that form over the ocean. As it strengthens, drawing energy from warm ocean water and warm, moist air, it begins to organize and rotate. The warm air rises high into the atmosphere, where it condenses into liquid and freezes to ice, forming giant rain-producing clouds. When winds form a closed circle with speeds exceeding 39 miles per hour, the cluster of storms becomes a tropical storm. At 74 mph, it officially becomes a hurricane, one of the most violent storms on Earth. A hurricane’s eye is its clear center, and the calmest part of the storm. The eye is surrounded by a wall of deep clouds and deadly winds. Rotation around a central core corresponds with the eye wall and spiral rain bands, said William Straka III, a researcher for the Cooperative Institute for Meteorological Satellite Studies at the University of Wisconsin-Madison. “So essentially, the convection surrounding the circulation acts as the engine that sustains a hurricane.”
The shape
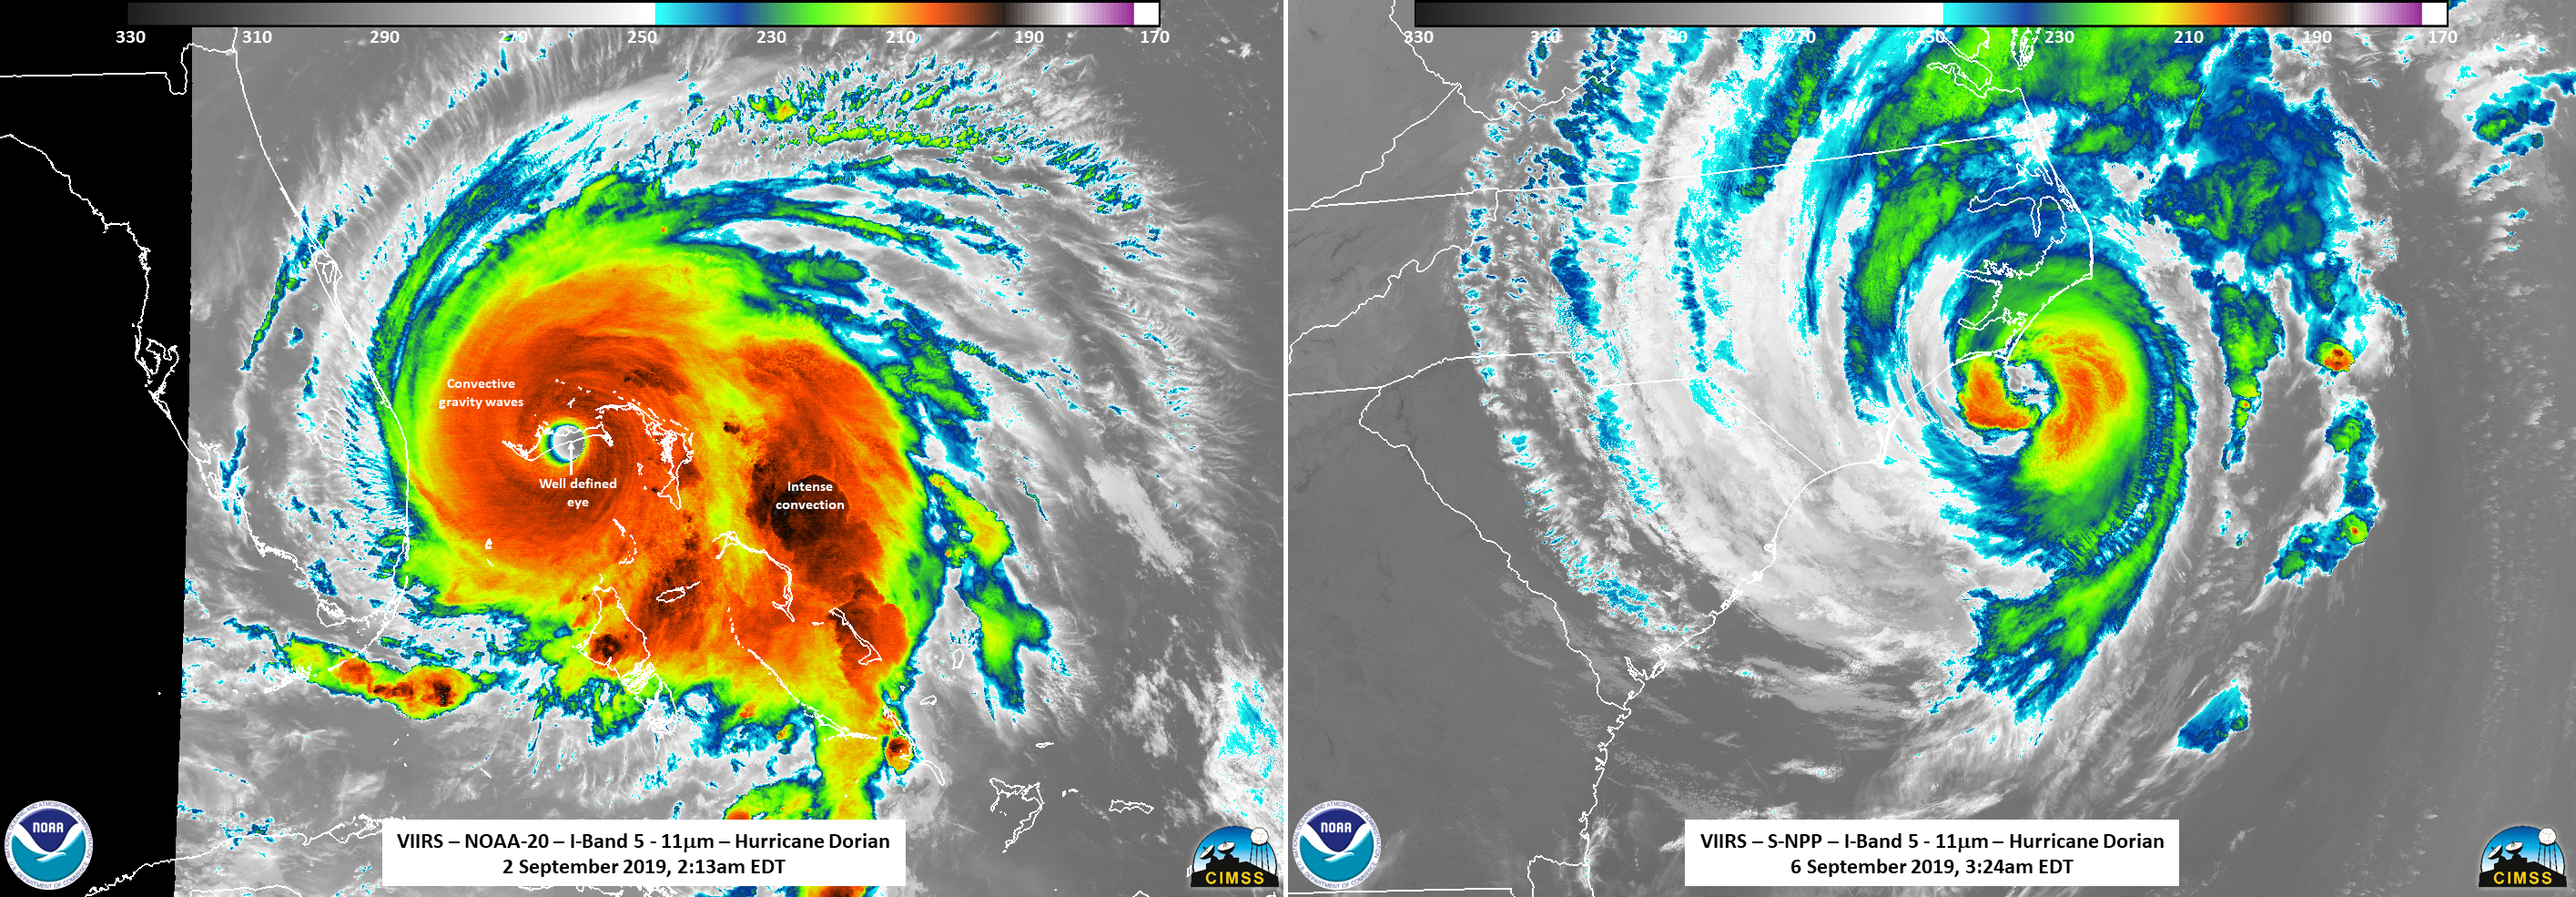
The first thing that Rob Gutro, meteorologist and deputy news chief at NASA, looks at is the hurricane’s shape. The most powerful hurricanes, like Dorian on Sept. 2 above, have a round, almost circular shape. Think of a storm as a rotating stack of tires in the atmosphere, spun by winds, said Gutro, who also maintains the "Hurricanes and Tropical Storms" section of NASA's website. If wind shear — that’s a change in wind speed with height — pushes harder against the top of the tire stack than the bottom, that’s going to upset the stack of tires, causing it to lean over and wobble. “When wind shear affects a storm, it distorts the storm, and the storm can start to weaken,” Gutro said. When wind shear is minimal, storms tend to be more symmetric, said Scott Braun, a research meteorologist with NASA’s Goddard Space Flight Center in Greenbelt, Md. But when wind shear increases and the storm starts to tilt, thunderstorm activity gets pushed to one side. Compare, for example, these side-by-side images of Dorian from Sept 2 (left) and Sept 6 (right.)
“If you start to see that more uniform “donut shape” in the clouds suddenly shift to being sort of a crescent shape, that’s usually an indication that the wind shear is increasing,” Braun said.
At the time the Sept. 6 image above was taken, the storm was experiencing an increase in wind shear and crossing into cooler waters, Straka said. You can see a ragged eye and a drop in symmetry compared to the earlier image.
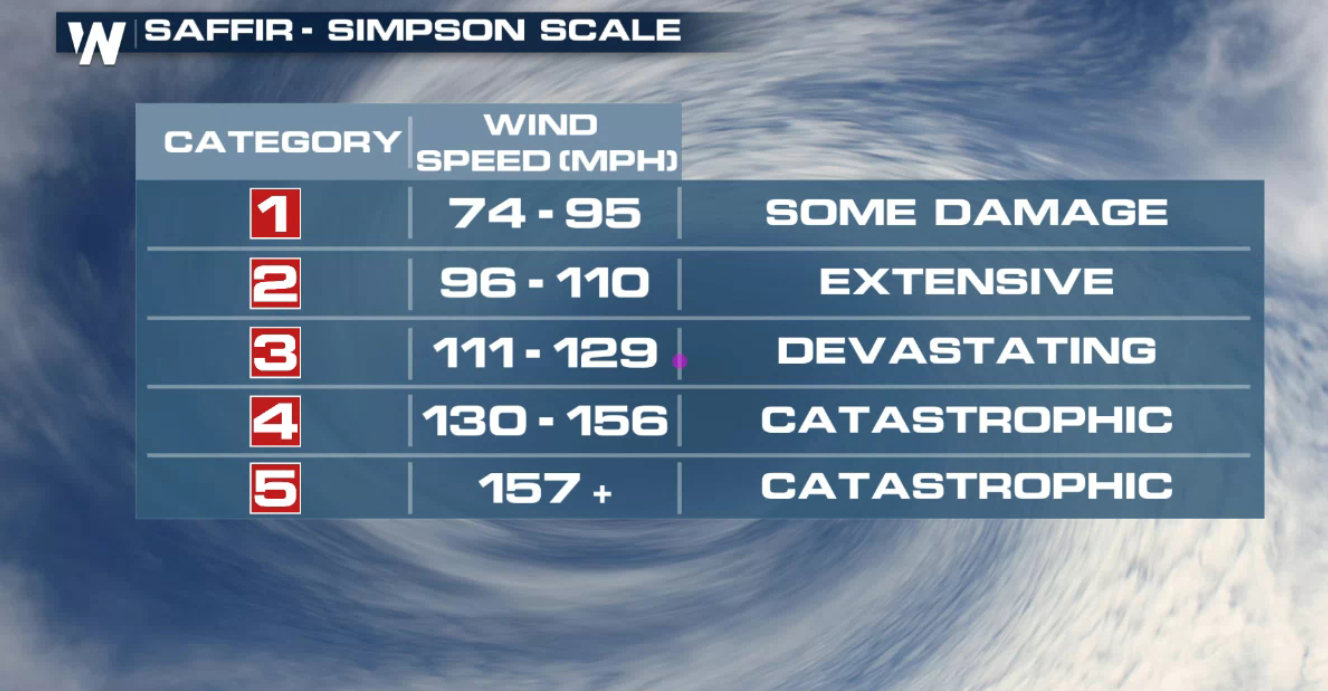
A hurricane that encounters strong shear can drop in intensity by as much as 35 mph or more in the span of a day. This is known as rapid weakening. That decrease can be equivalent to one or more categories on the Saffir-Simpson hurricane intensity scale, Braun said.
But the opposite is also true. A jump in 35 mph or more in less than 24 hours is considered rapid intensification. “What most often leads to rapid intensification is movement of a storm over a deep layer of warm waters, and a decrease in wind shear,” Braun said.
With Dorian, rapid intensification occurred twice: Once between Aug 30 and 31, when winds jumped from 105 mph to 140 mph. And then it happened again the next day. On Sept 1, the same day the storm made landfall on Grand Bahama Island, winds surged from 150 mph to 185 mph in only nine hours.
One of the most surprising aspects of Dorian, DeMaria said, was its ability to maintain its strength while stalled over the Bahamas.
“That is very unusual because stationary or very slow moving tropical cyclones usually mix with the upper ocean, cooling the sea surface temperature, which leads to weakening,” he said. “Dorian was able to maintain category 5 intensity while it was stationary.”
The eye
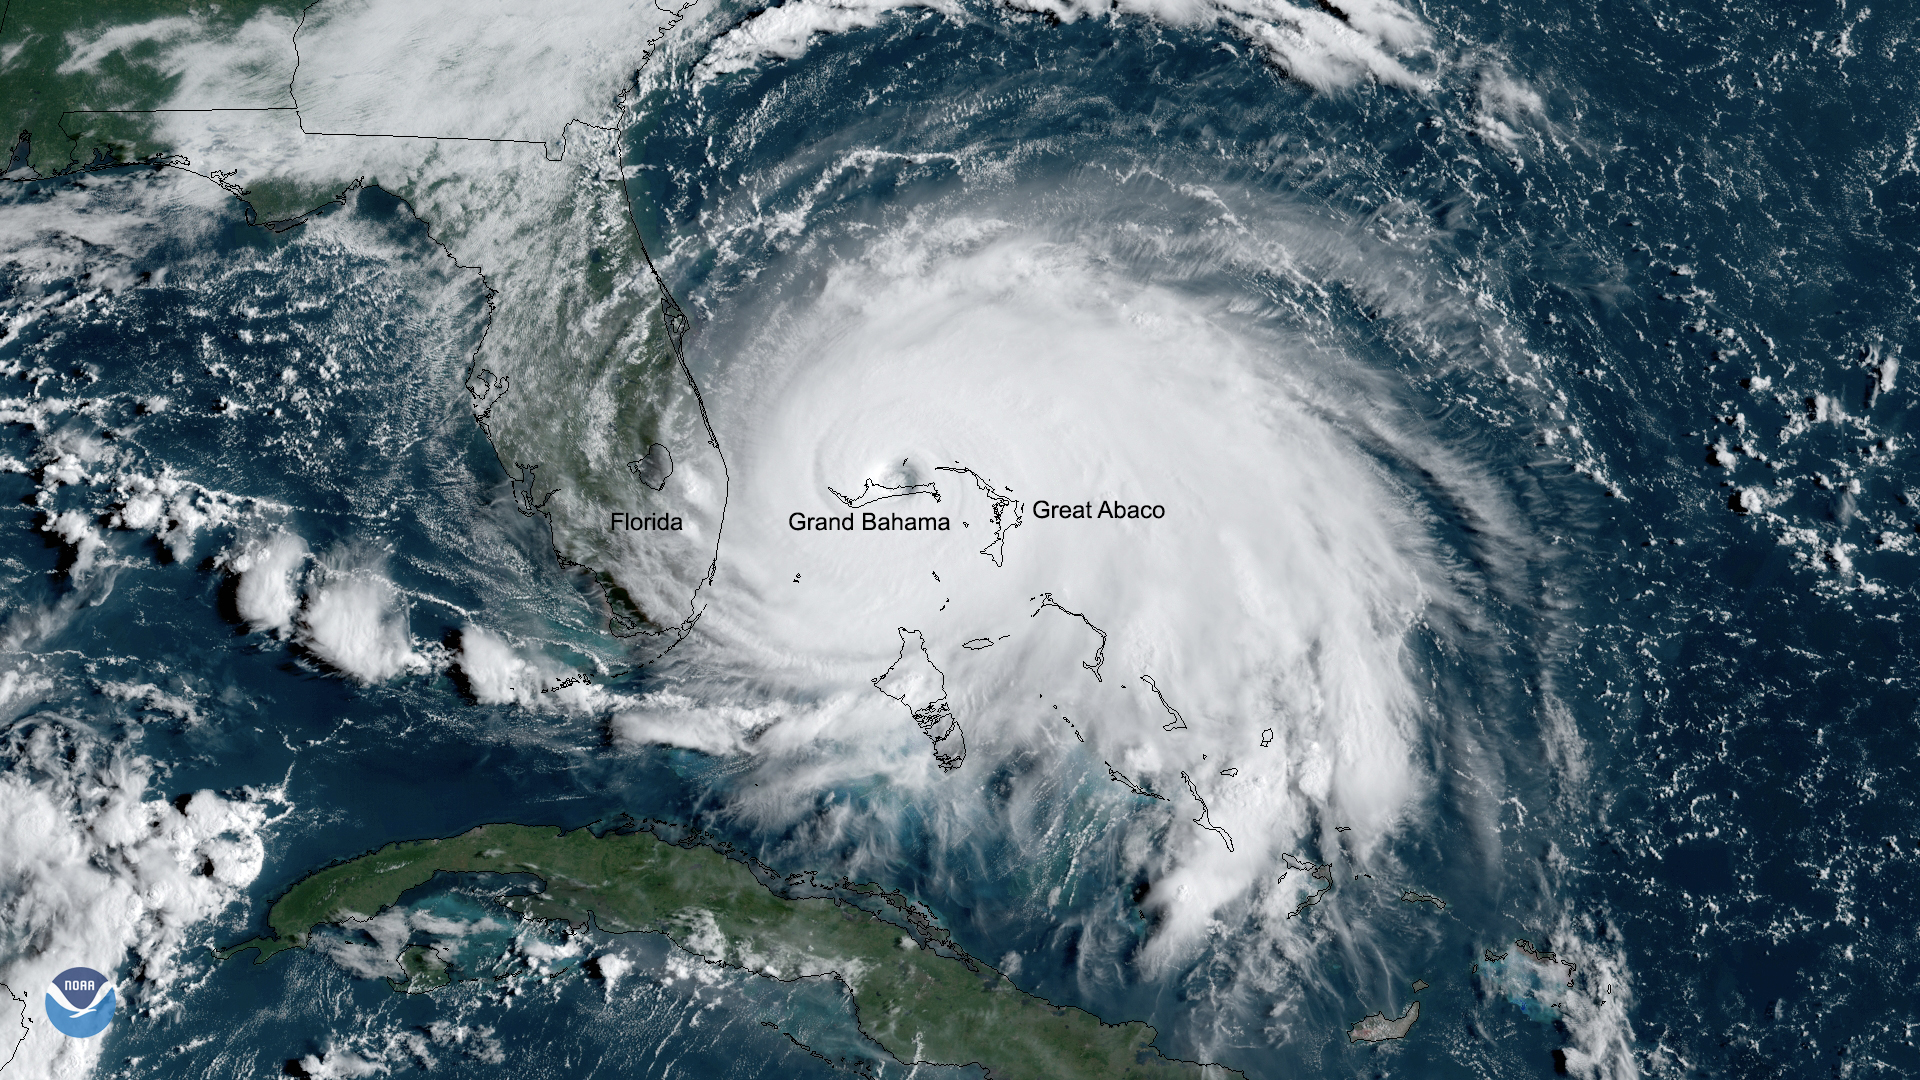
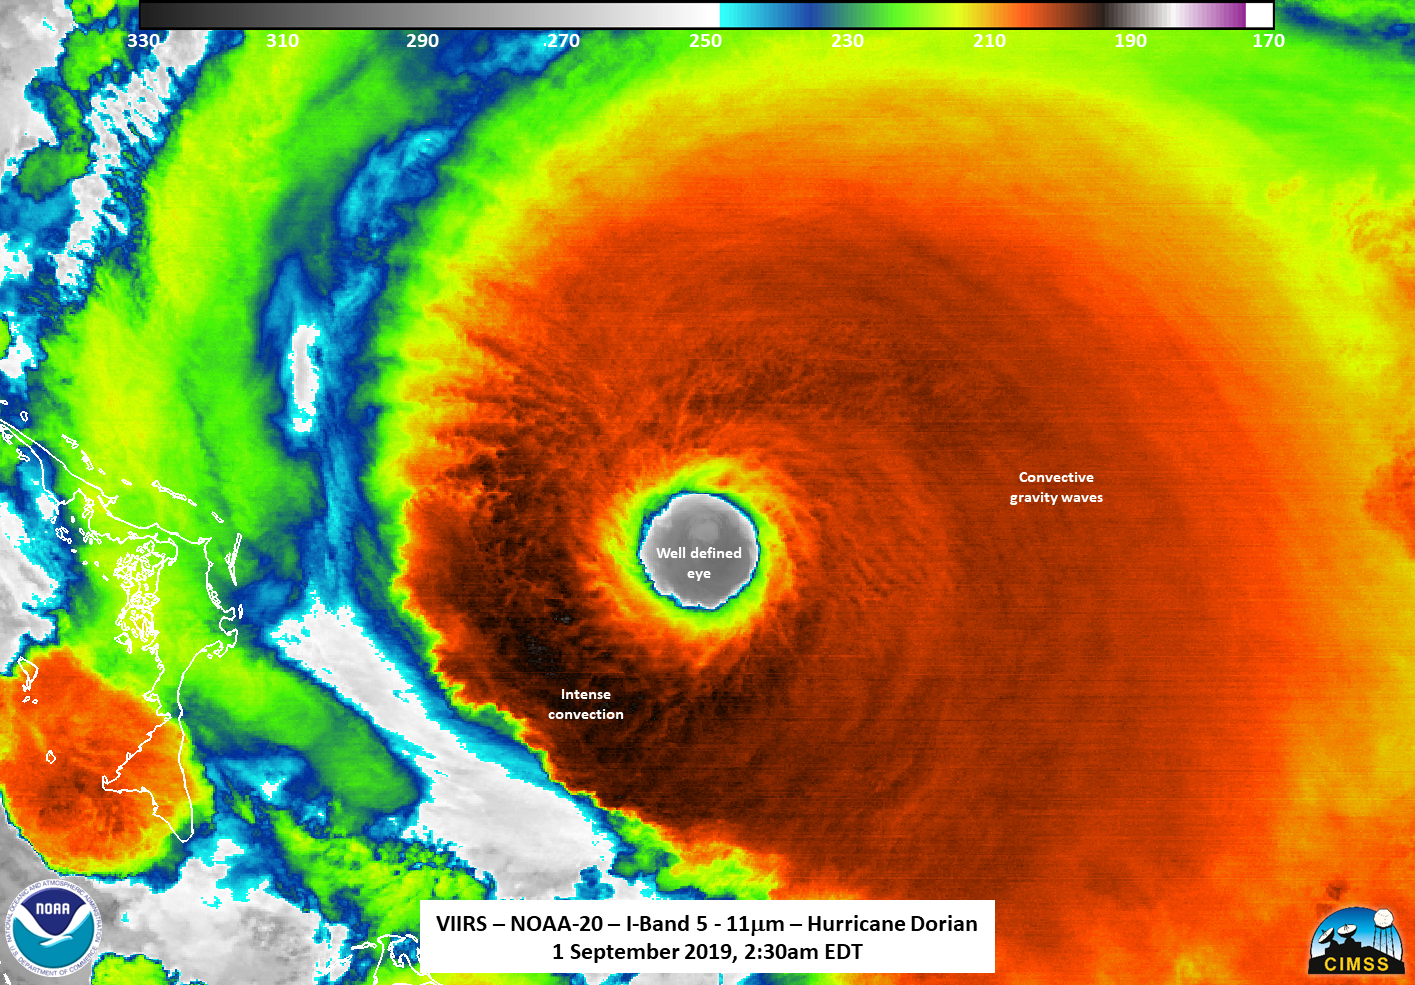
Braun also pays close attention to the formation of a well-defined eye, another indicator of the storm’s power. See the unmistakable eye of Dorian below, on Sept 1.
In its early stages, a storm is less defined, consisting mostly of cloud cover and no obvious eye. But as wind speeds rise, you start getting a stronger, rising motion in the growing wall of clouds that forms around the eye.
In the lower atmosphere, known as the troposphere, air gets colder with height until it reaches the stratosphere, where the trend reverses and air begins warming with height. Inside a thunderstorm, air rises, as long as it is warmer than the colder, denser air around it, until it reaches an equilibrium and then begins spreading outward.
That outward-spreading air causes surrounding air to sink, both inside and outside of the eye wall. And as the air inside the eye sinks, it dries and warms, evaporating the clouds and clearing out the center.
“So it becomes this loop, where the air coming in near the surface accelerates the spinning winds, drives a stronger vertical circulation, increases the sinking motion in the eye, increases the warming, and further clears out the eye,” Braun said. “When you get a major storm like Dorian, eventually you get to the point where it’s so strong and it’s driving such strong, sinking motion in the eye, that you get the really well-defined eye in satellite imagery.
Since circulation surrounding the eye is an indicator of the storm’s strength, Straka said it’s also important to pay attention to whether the eye is exposed. “If it’s exposed, that means there’s dry air in it, and it could be weakening,” Straka said. Dry air saps the storm of the moisture it needs to thrive.
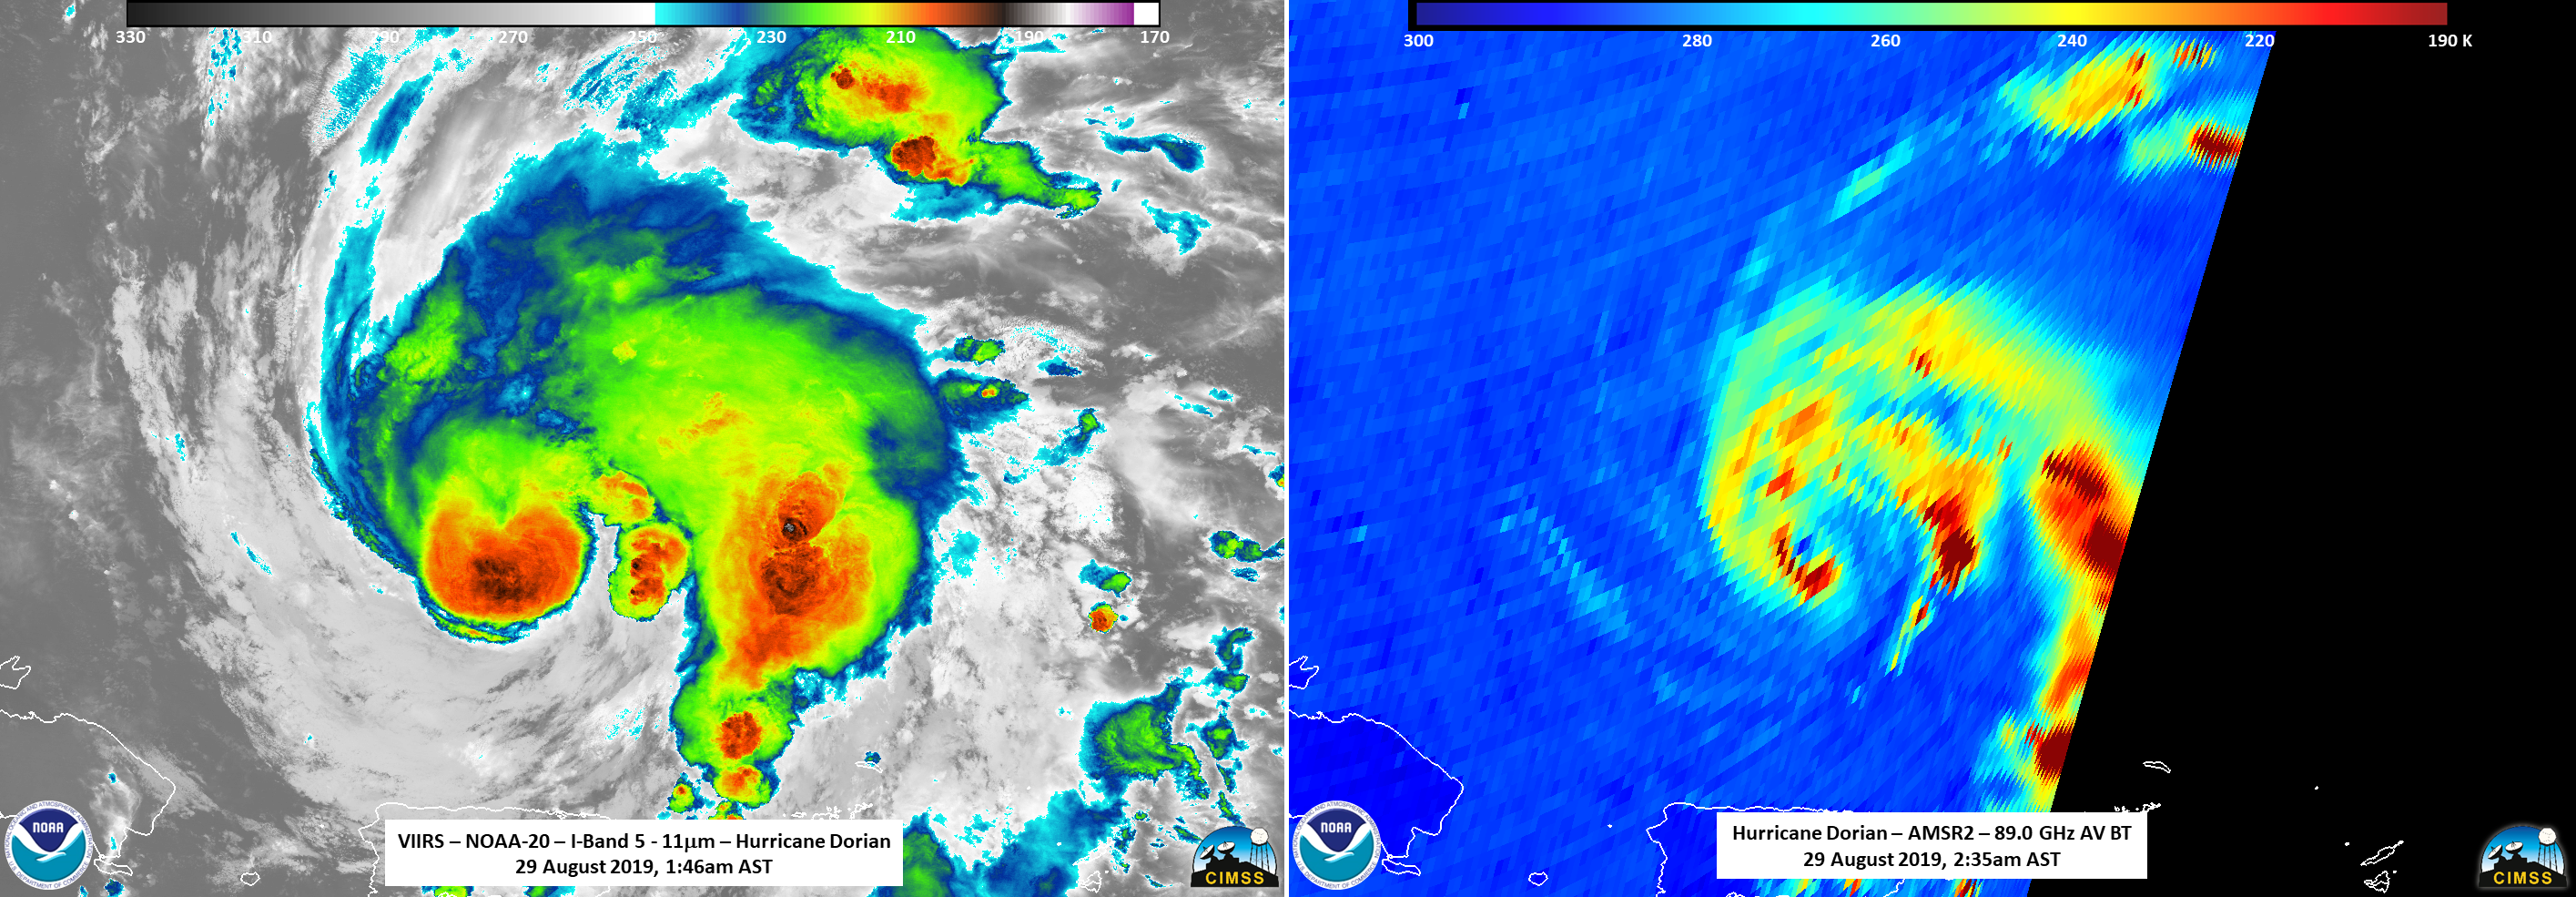
When a storm’s eye is obscured by clouds, meteorologists use microwave imagery to see the eye, because the microwave can penetrate the clouds. See, for example, this image, captured from the Advanced Microwave Scanning Radiometer, or AMSR2 instrument, aboard JAXA’s GCOM-W1 satellite. “Microwave imagery is very important because it provides early information on whether a tropical storm is intensifying,” said Mitch Goldberg, NOAA program scientist for the Joint Polar Satellite System.
Lightning and gravity waves
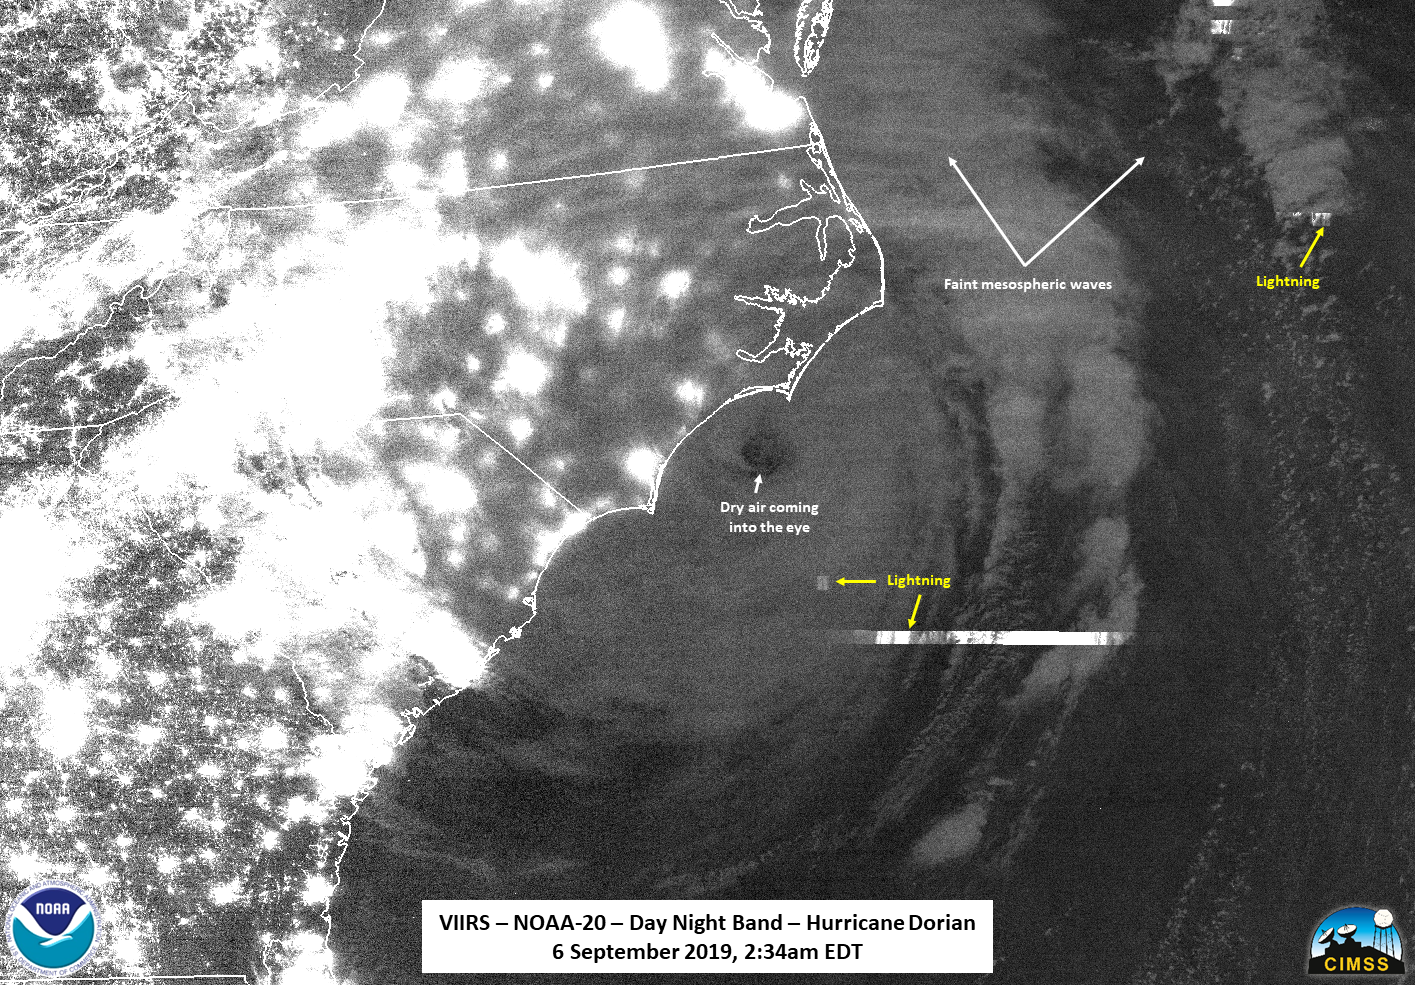
The GOES satellites have a Geostationary Lightning Mapper (GLM), the first of its kind, which maps lightning activity in hurricanes. This device provides continuous observations of total lightning, both inside and below clouds, and can help forecasters predict rapid intensification of hurricanes as far as 24 hours ahead of time. See, for example, this loop from GOES East, captured on the morning of Sept 1. https://www.youtube.com/watch?v=k74PtXTfJhY VIIRS has a channel, known as the “Day/Night Band,” which provides a snapshot of night lights, as well as lightning and gravity waves from various altitudes.
Gravity waves, (not to be confused with ripples in space-time known as “gravitational waves”) distribute energy and momentum throughout the atmosphere. The more intense the storm, the greater the amount of energy that is transferred. These waves exist all the time, even on clear days, and waves in the troposphere can often be seen in the infrared and visible imagery. However, strong convection from storms can cause a bunch of energy to be released, which is then transferred to the upper atmosphere.
The most intense storms (as well as violent volcanic eruptions) have enough force to generate mesospheric gravity waves, noted in the image above. These are gravity waves near the mesopause, the boundary between the mesosphere and the thermosphere, where Earth’s atmosphere meets space.
Strong storms with a well-defined eye can easily be tracked in the GOES visible imagery during the day and infrared imagery at night. However, weaker storms don’t always have an eye and are more difficult to track, especially at night, when the visible imagery from GOES is not available. The Day/Night band can detect very small amounts of visible radiation, such as that reflected from moonlight at night. Thus, VIIRS can also help forecasters determine the storm’s center at night for these weaker storms, DeMaria said.
“Knowing where the center is, that’s the starting point for our forecast,” he said.
Color and temperature
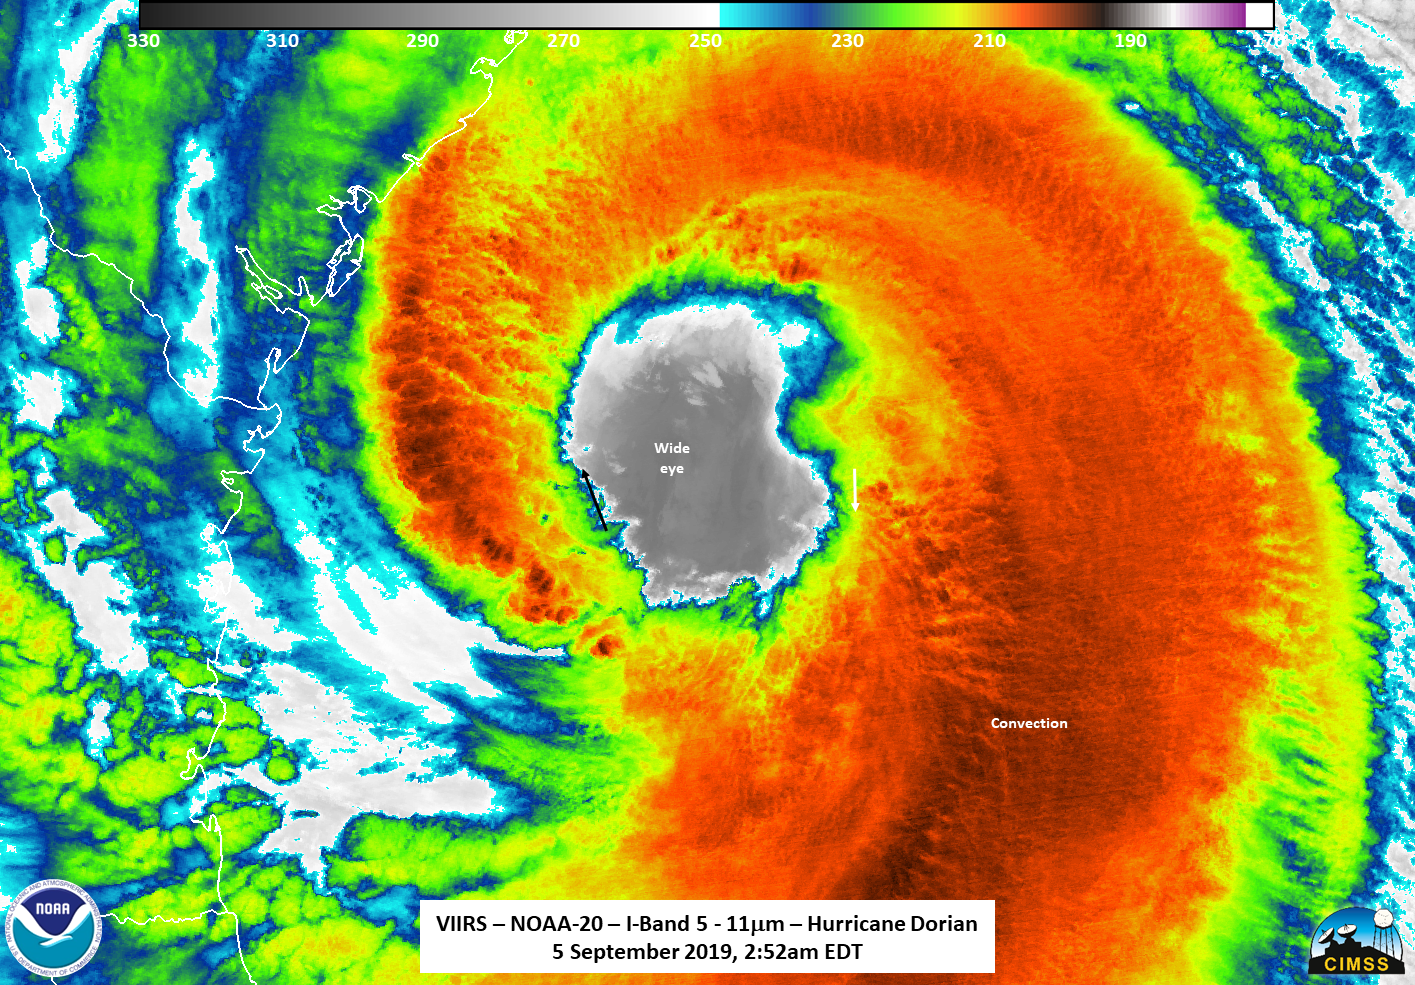
Color in these images is an indicator of the temperature at the very top of the clouds. The colors are a little counterintuitive, since we typically associate red with hot and blue with cold. If you look at the key on top of this Sept. 5 image of Dorian below, you can see that blue is warmest; red is cooler, black is coldest.
Colder cloud-top temperatures often indicate that the clouds are deep and that the thunderstorm is intense. It’s typical to see colder temperatures in the eye wall and warmer temperatures around the edges of the storm.
Color, like shape, also often corresponds with wind speeds. It can provide clues about the health of the storm’s convection, Straka said. Black and red, marked above, means the clouds are cold and the convection runs deep. In other words, these colors indicate more intense thunderstorms.
Storm evolution
https://www.youtube.com/watch?v=e3g7NpCkZMM Knowing how the storm changes over time is another critical component to understanding it. And that’s something you need geostationary satellites like GOES to observe. See, for example, this timelapse video above from GOES East that begins on Aug. 29, 2019 — the day after Dorian became a hurricane — and continues through Sept. 3, 2019. That is when the dangerous storm began to pull away from the Bahamas and head for the U.S. mainland. Of everything that he monitors, Braun says he especially pays attention to this trend in temperatures as the storm evolves. “If the temperatures are getting colder over time, you know those thunderstorms are getting stronger and deeper,” Braun said. “And if they’re warming over time, it might indicate that they’re starting to dissipate. That tells us what might be going on in terms of the behavior of the storm.”All Weather News
More
Severe Storms For the East Coast Through Tuesday
Frontal systems have been crossing the northe
30 Jun 2025 9:00 PM

Severe Weather Threat Continues in the Midwest
It has been an active, severe season across t
30 Jun 2025 9:00 PM


Hurricane Center Monitoring Florida for Tropical Development
Residents and visitors to the Southeast will
30 Jun 2025 3:05 PM

Where Rain Could Dampen Holiday Travel Plans
AAA is expecting over 70 million travelers to
30 Jun 2025 3:00 PM

Barry Makes Landfall, Watching Flossie Next
While the Eastern Pacific has made most of th
30 Jun 2025 10:50 AM

Thunderstorms Possible in the Southeast Overnight
SOUTHEAST - Strong thunderstorms have develop
28 Jun 2025 2:40 AM