A New Understanding of Soil Moisture

From Soil Moisture Data to Information
Soil moisture data can provide early warning of an emerging drought or saturated soils that can increase the likelihood of floods. However, turning these data into actionable information is challenging. That is partly because context matters for soil moisture data—a lot. As with temperatures, soil moisture conditions vary by region, season, and time of day, but they also depend on soil type, land cover, and local elevations and slopes. Soil moisture values can also vary significantly over short distances. As a result, getting an accurate picture of what constitutes normal conditions at a given site, and whether conditions are currently drier or wetter than normal, requires more than just current values of absolute (“volumetric”) soil moisture.
 To address this challenge, scientists from the CISESS and NCEI are using high-quality soil moisture data from USCRN to produce a new standardized hourly soil moisture dataset. A new paper in the Journal of Applied Meteorology and Climatology documented their findings.
The term “standardized” refers to using statistical techniques to transform raw data into more useful metrics by comparing individual observations against longer-term historical conditions. For example, while a low absolute soil moisture value might indicate normal conditions if observed in the dry Southwest, the same value might suggest extreme drought conditions if observed in a wetter part of the country. Standardized soil moisture metrics transform those values into percentiles or deviations from normal to help decision makers understand how current conditions compare to historical conditions at a given time and place.
Generating a Climatology
The first step is developing an accurate record of historical conditions at each station, referred to as a climatology. Climate researchers typically use 30-year averages to produce a climatology, but USCRN stations only have soil moisture for the last seven to nine years, depending on the station. To produce more robust historical information from these smaller datasets, the researchers turned to statistical sampling techniques to increase the effective number of observations. They then tested the results against longer-term data (ten years or more per station) from the USDA Soil Climate Analysis Network (SCAN). Using a Monte Carlo approach, the researchers found that it was possible to reproduce a long-term (ten or more years of data) soil moisture climatology with as few as five years of data. As a result, it is possible to estimate soil climatologies at USCRN stations and derive soil moisture anomalies.
Evaluating Standardization Methods
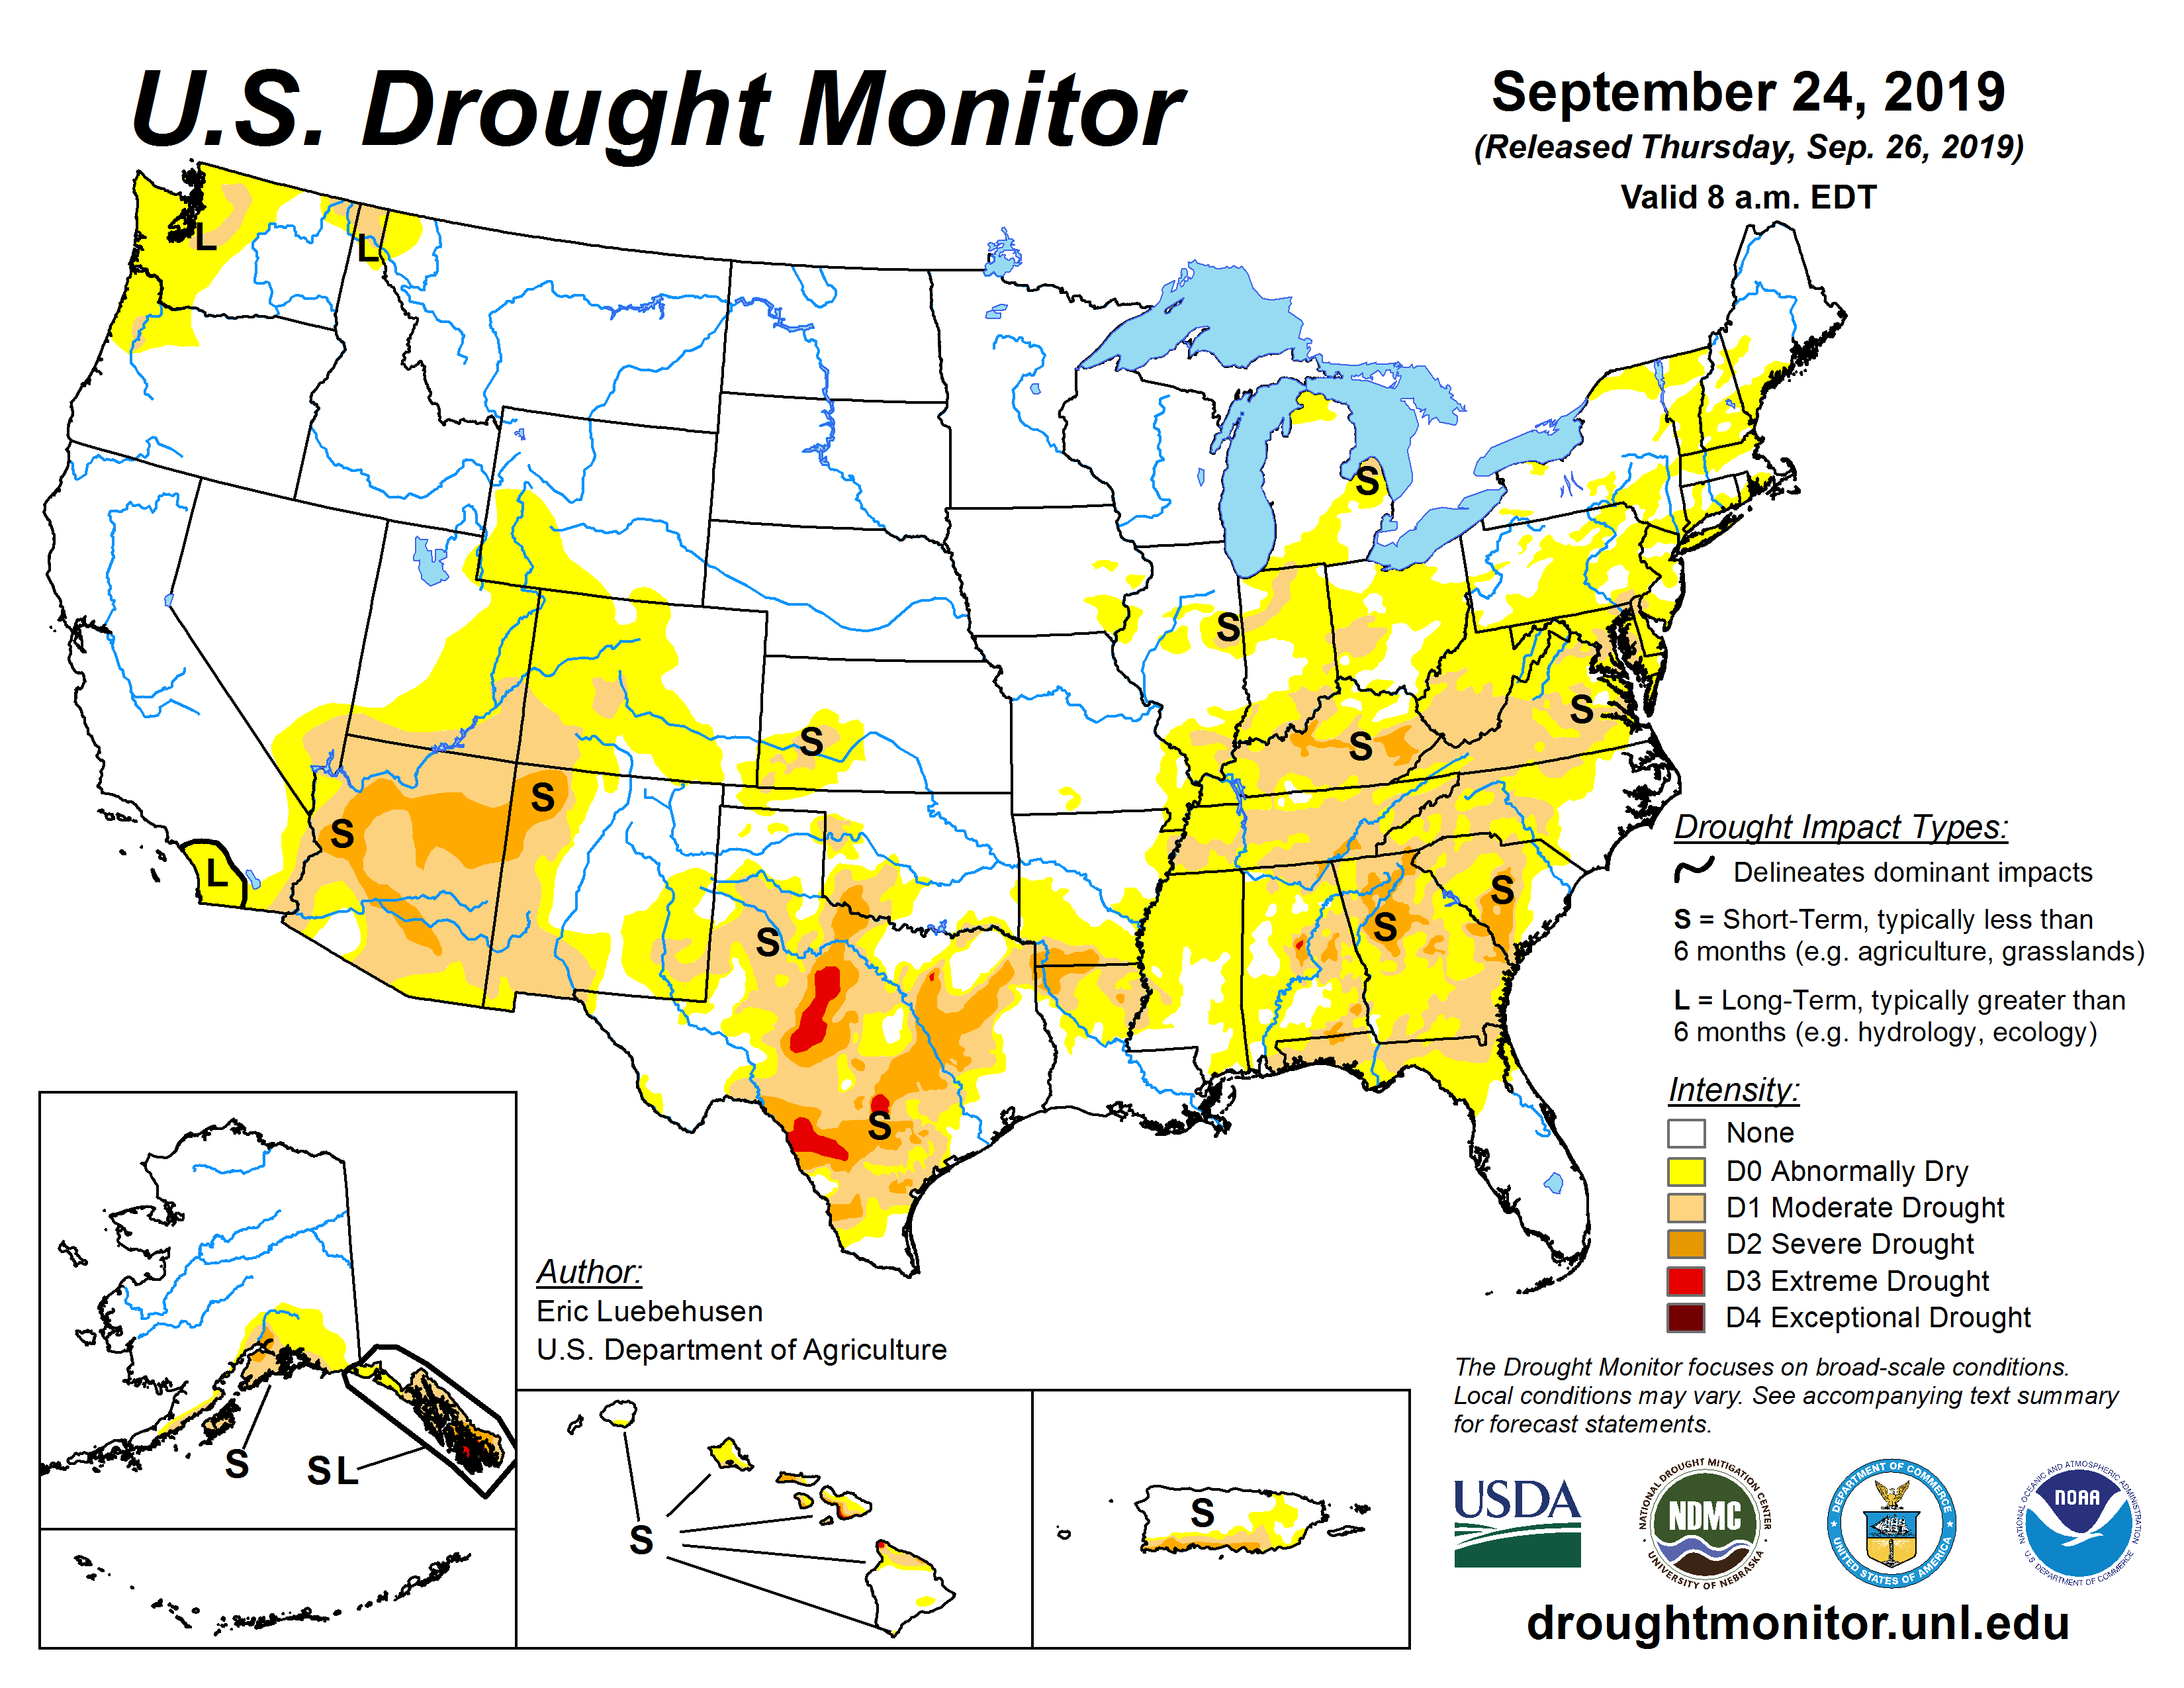
The authors then explored several standardization methods, which involved computing differences (anomalies) between the raw volumetric data and either the mean or median values from the climatology. Percentiles were then generated for the anomaly metrics as well as the volumetric data. The most promising metric was the standardized median anomaly (denoted as STA in the paper).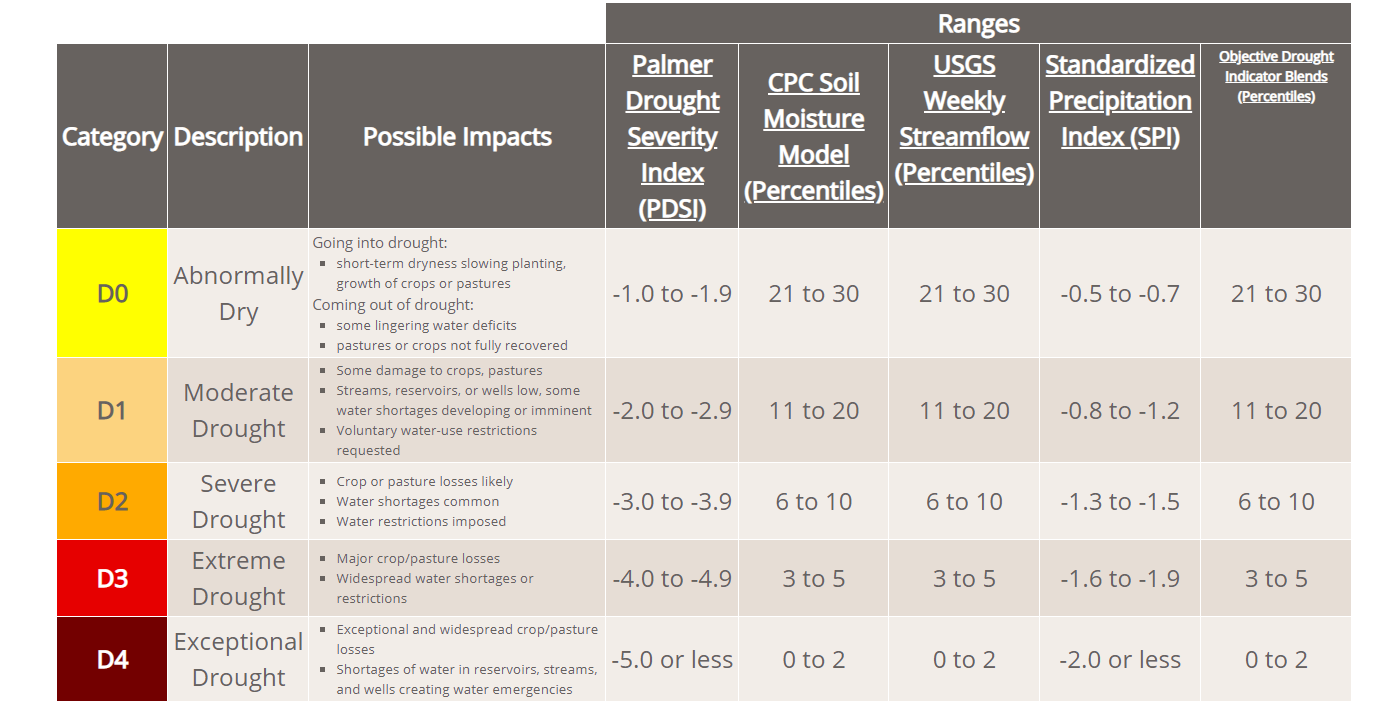 The final step was comparing these various standardized metrics with the drought categories reported by the U.S. Drought Monitor (USDM), both overall and at a few selected case study sites. The USDM drought categories range from no drought to D0 for abnormally dry and D1 through D4 for moderate, severe, extreme, and exceptional drought, respectively. The USDM is updated weekly, so comparisons were done using seven-day averages of the standardized soil moisture data.
Overall, the standardized median anomaly metric (denoted as STA in the paper) provided the best agreement with the USDM categories and offered a clearer indication than other measures of both improving and worsening conditions. The standardized metrics were also less sensitive to soil type than the raw volumetric measurements.
A Case Study in Nebraska
An evaluation of the onset of drought in Whitman, NE, in 2012 demonstrated the value of the standardized percentile measures for providing early indications of changing conditions. The authors noted: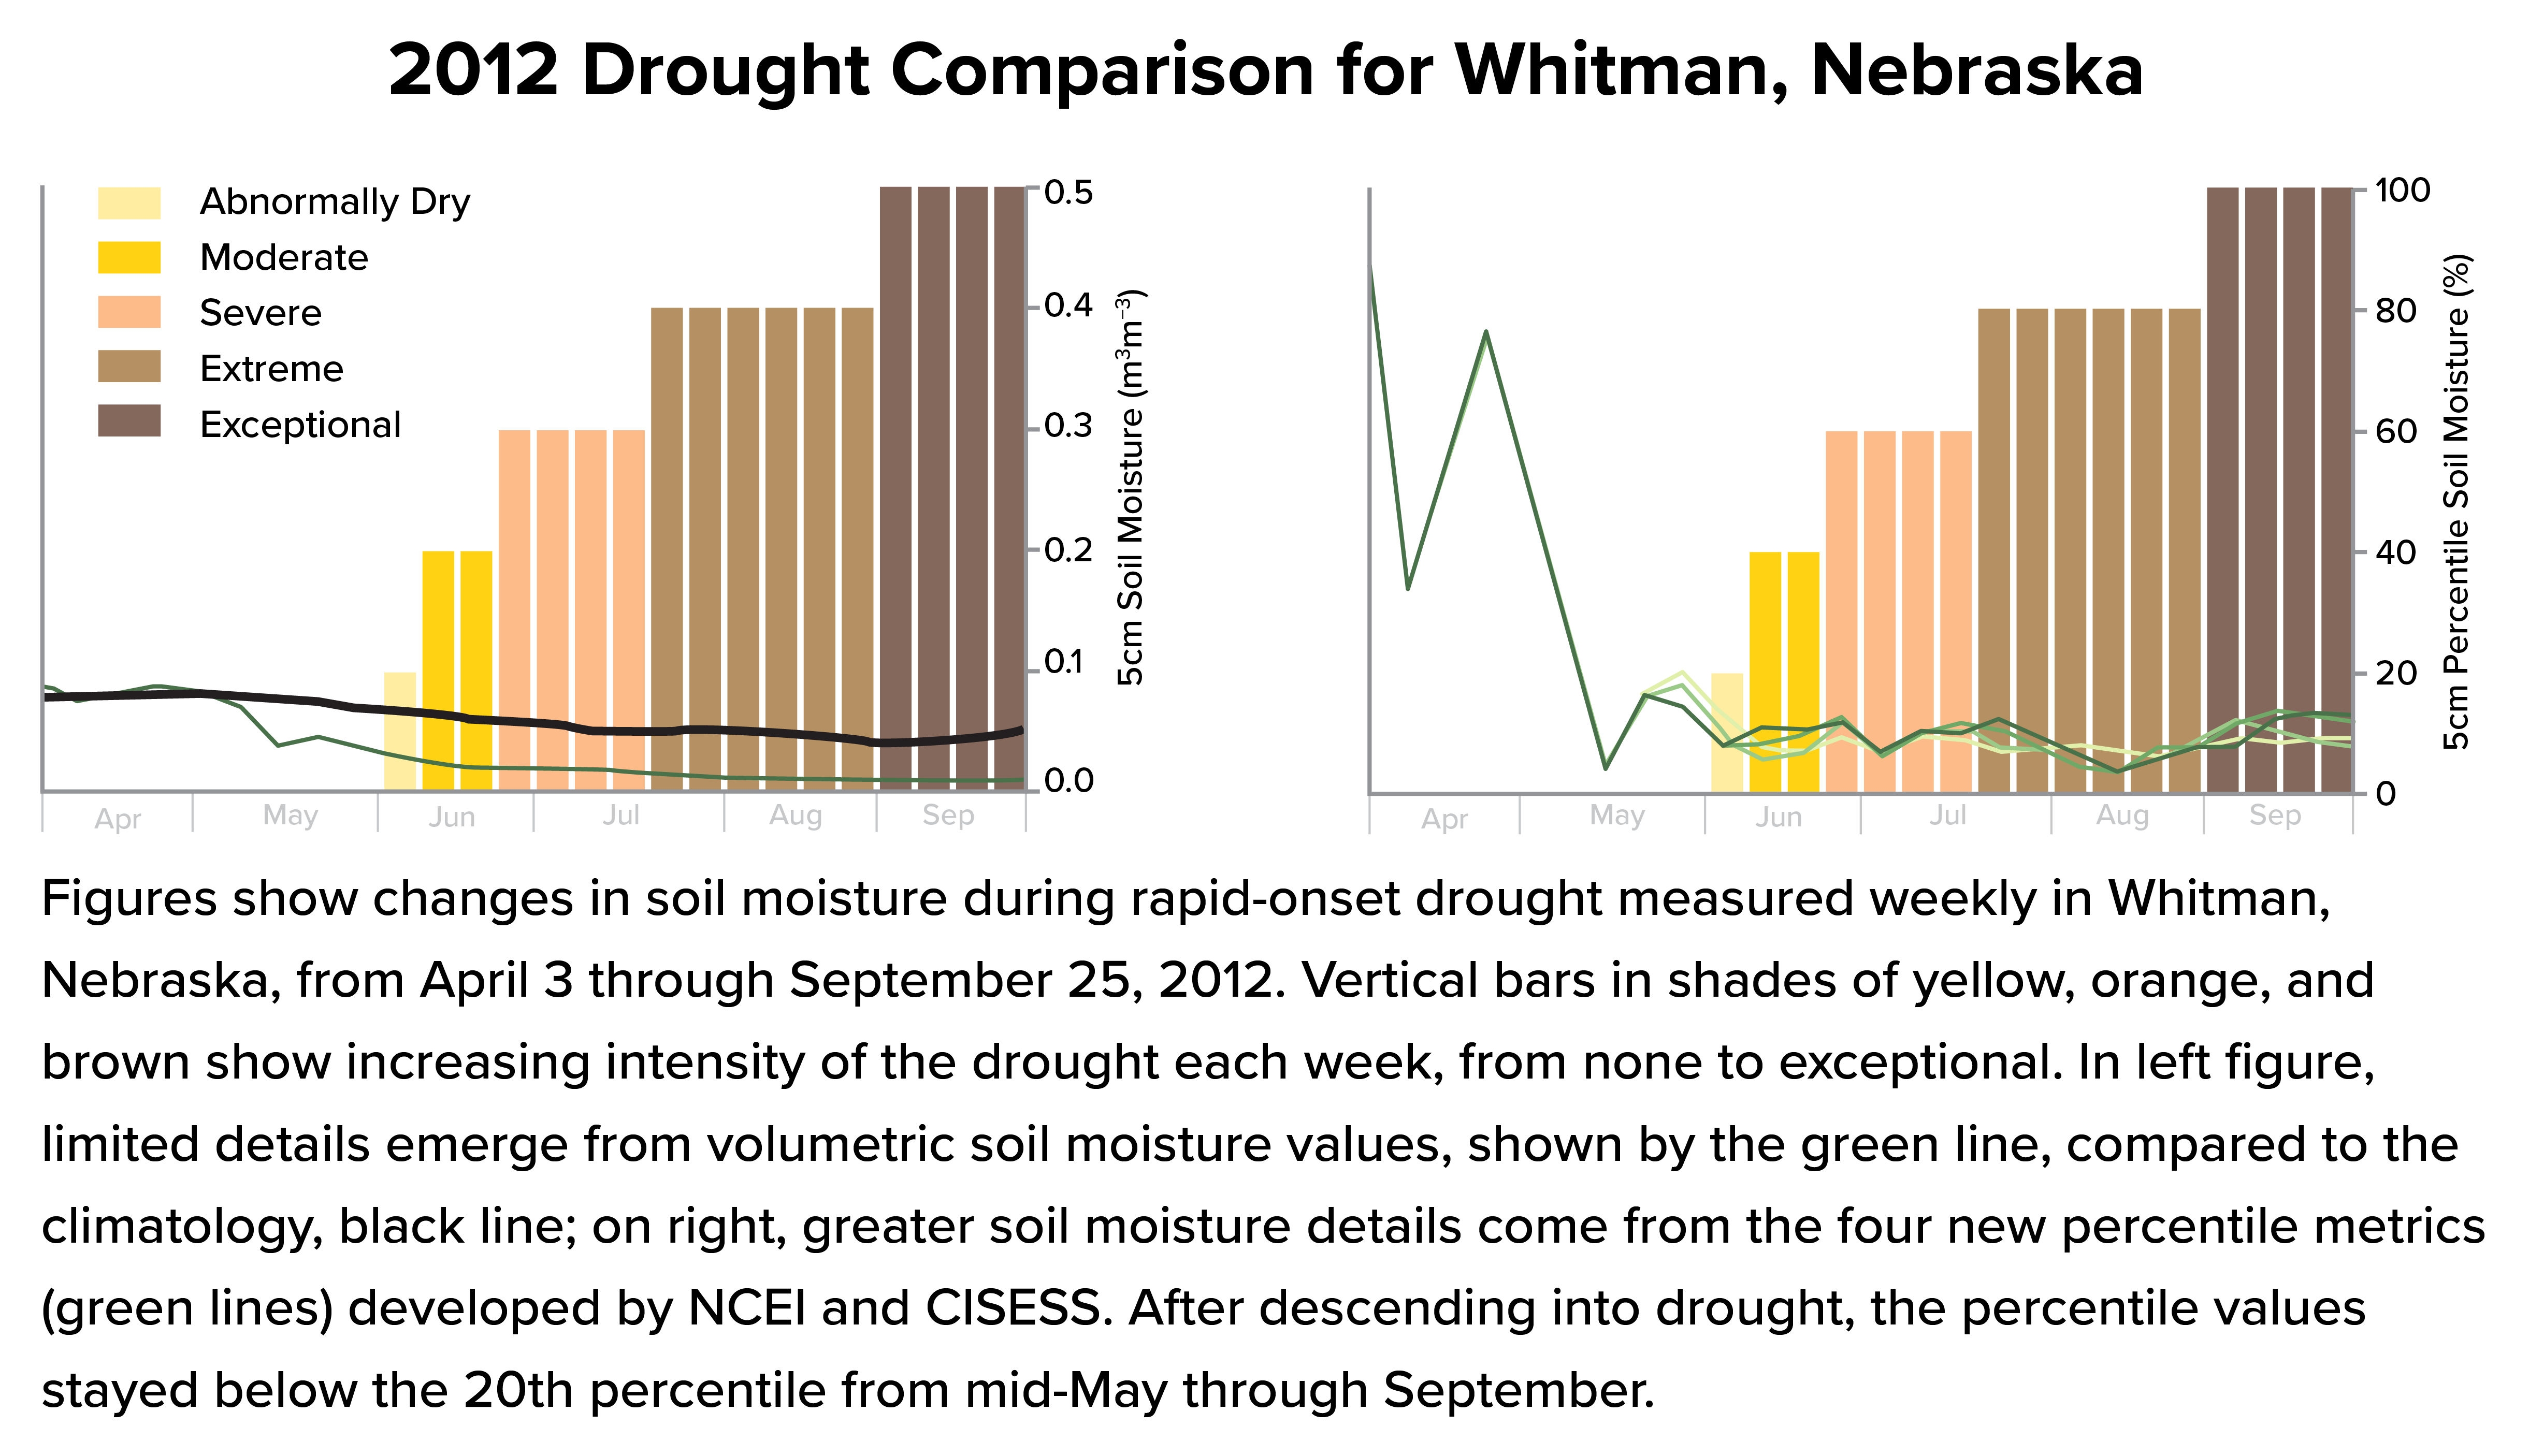 “Without some background knowledge of central Nebraska’s sandy soils, the importance of the small 0.05 m3m−3 drop in volumetric soil moisture could have been overlooked by decision makers unfamiliar with local conditions. For this reason, the standardized soil moisture metrics provided information that is more comparable over time and geography concerning the severity of drought conditions than volumetric soil moisture alone.”
They also found that counts of percentile threshold exceedance were particularly useful for indicating drought severity.
“Without some background knowledge of central Nebraska’s sandy soils, the importance of the small 0.05 m3m−3 drop in volumetric soil moisture could have been overlooked by decision makers unfamiliar with local conditions. For this reason, the standardized soil moisture metrics provided information that is more comparable over time and geography concerning the severity of drought conditions than volumetric soil moisture alone.”
They also found that counts of percentile threshold exceedance were particularly useful for indicating drought severity.


