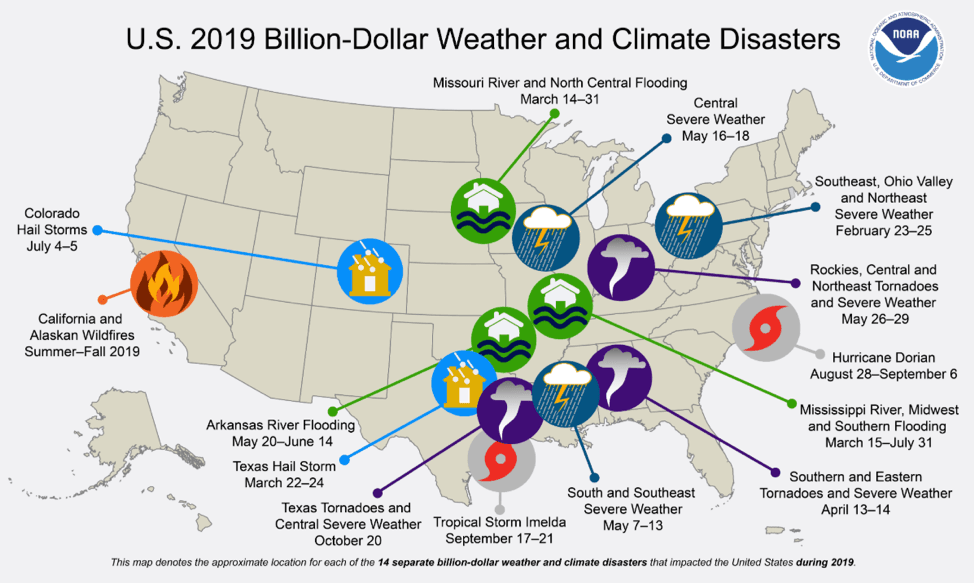
Billion-Dollar Weather Disasters in Seasonal Context
Special Stories
8 May 2020 2:00 AM
[Written by NOAA] A new climatology tool help provide context to the long-term seasonal frequency of billion-dollar weather and climate disasters across the United States and its regions.
NCEI tracks U.S. weather and climate events that have significant economic and societal impacts and provides quarterly summaries of these events. Since 1980, the United States has sustained 265 weather and climate disasters where the overall damage costs per event reached or exceeded $1 billion (including adjustments based on the Consumer Price Index, as of April 2020). The cumulative cost for these 265 events exceeds $1.775 trillion.
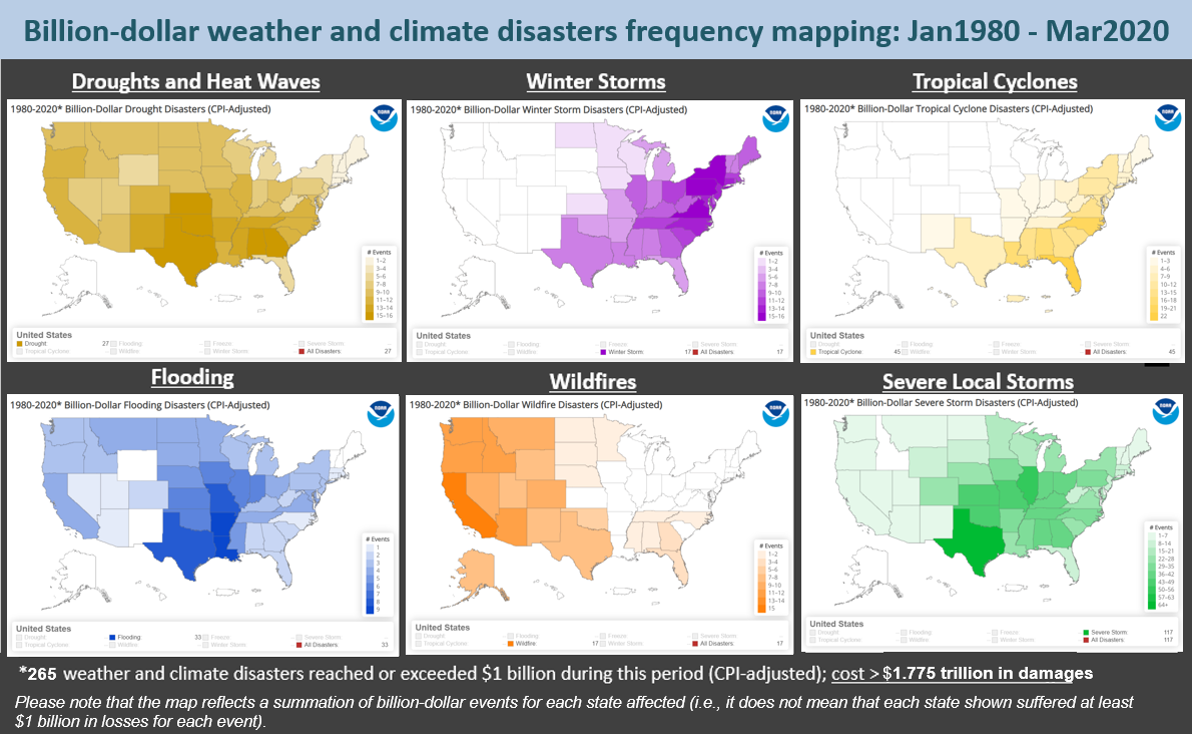 [Maps show the number of times each state has been affected by each of six types of billion-dollar weather and climate disasters from January 1980 through March 2020. Note that each state did not necessarily experience the full billion-dollar cost for an event to be counted; it only needed to be part of a regional event that caused one billion dollars or more in direct damages. Courtesy of NOAA NCEI]
A new NCEI tool is designed to help users investigate the climatological (long-term) frequency of these events across the Nation and its regions. The climatology provides visualization tools, such as graphs and figures, for several regions and all U.S. states. This can be a useful way for decision-makers to utilize historical data to understand which types of large events typically occur at what times of year, by region. The information also raises awareness of the potential for multiple, cascading hazards, which historically can occur from season to season.
[Maps show the number of times each state has been affected by each of six types of billion-dollar weather and climate disasters from January 1980 through March 2020. Note that each state did not necessarily experience the full billion-dollar cost for an event to be counted; it only needed to be part of a regional event that caused one billion dollars or more in direct damages. Courtesy of NOAA NCEI]
A new NCEI tool is designed to help users investigate the climatological (long-term) frequency of these events across the Nation and its regions. The climatology provides visualization tools, such as graphs and figures, for several regions and all U.S. states. This can be a useful way for decision-makers to utilize historical data to understand which types of large events typically occur at what times of year, by region. The information also raises awareness of the potential for multiple, cascading hazards, which historically can occur from season to season.
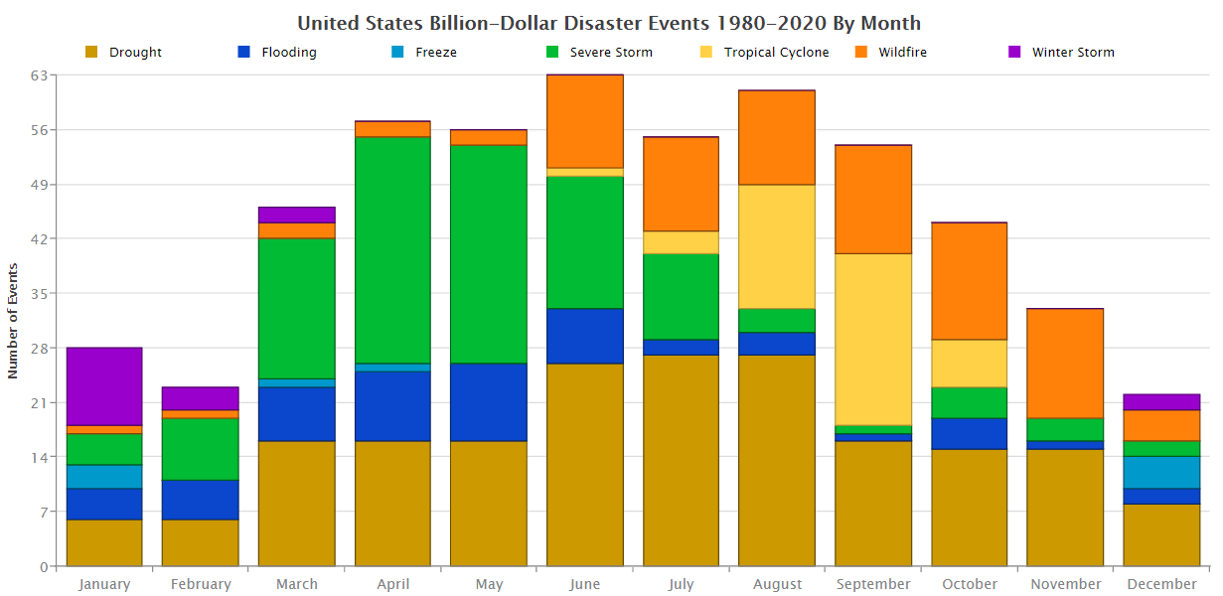 [Number of billion-dollar disaster events by month and by hazard type for the United States since 1980. The chart reflects the total duration of billion-dollar disasters events using begin-date and end-date; therefore, an event can span multiple months. Courtesy of NOAA NCEI.]
During the spring months, there is also the potential for major river flooding (shown above in dark blue). U.S. springtime flooding from snowmelt and/or heavy rainfall is a persistent hazard that affects many towns and agriculture regions within the Missouri and Mississippi River basins, among others. NOAA’s 2020 spring flood forecast offers perspective on how the risk of flood may unfold as it did in 2019, when river flooding damaged communities across numerous states.
During the fall season, Gulf and Atlantic coast states must be vigilant about hurricane season, particularly during August and September (shown above in yellow). Hurricanes are the most destructive and costly billion-dollar disasters—totaling damage losses near $1 trillion since 1980. For example, in 2016–2018, the U.S. was impacted by six separate billion-dollar hurricanes (Matthew, Harvey, Irma, Maria, Florence, and Michael) with an inflation-adjusted loss total of $339.2 billion and 3,318 fatalities. As a comparison, the United States also experienced a series of active hurricane seasons from 2003–2005 where nine separate billion-dollar hurricanes (Isabel, Charley, Frances, Ivan, Jeanne, Dennis, Katrina, Rita, and Wilma) made landfall, with an inflation-adjusted loss total of $307.5 billion and 2,225 fatalities.
Lastly, the peak of the Western U.S. wildfire season occurs during the fall months of September, October, and November (shown above in orange). California, Oregon, and Washington often face wildfire risk and related poor air quality for weeks to months. Western wildfire risk is also becoming more hazardous, as 15 of the 20 largest California wildfires (in acreage) and 15 of the 20 most destructive wildfires (buildings destroyed) have occurred since the year 2000.
[Number of billion-dollar disaster events by month and by hazard type for the United States since 1980. The chart reflects the total duration of billion-dollar disasters events using begin-date and end-date; therefore, an event can span multiple months. Courtesy of NOAA NCEI.]
During the spring months, there is also the potential for major river flooding (shown above in dark blue). U.S. springtime flooding from snowmelt and/or heavy rainfall is a persistent hazard that affects many towns and agriculture regions within the Missouri and Mississippi River basins, among others. NOAA’s 2020 spring flood forecast offers perspective on how the risk of flood may unfold as it did in 2019, when river flooding damaged communities across numerous states.
During the fall season, Gulf and Atlantic coast states must be vigilant about hurricane season, particularly during August and September (shown above in yellow). Hurricanes are the most destructive and costly billion-dollar disasters—totaling damage losses near $1 trillion since 1980. For example, in 2016–2018, the U.S. was impacted by six separate billion-dollar hurricanes (Matthew, Harvey, Irma, Maria, Florence, and Michael) with an inflation-adjusted loss total of $339.2 billion and 3,318 fatalities. As a comparison, the United States also experienced a series of active hurricane seasons from 2003–2005 where nine separate billion-dollar hurricanes (Isabel, Charley, Frances, Ivan, Jeanne, Dennis, Katrina, Rita, and Wilma) made landfall, with an inflation-adjusted loss total of $307.5 billion and 2,225 fatalities.
Lastly, the peak of the Western U.S. wildfire season occurs during the fall months of September, October, and November (shown above in orange). California, Oregon, and Washington often face wildfire risk and related poor air quality for weeks to months. Western wildfire risk is also becoming more hazardous, as 15 of the 20 largest California wildfires (in acreage) and 15 of the 20 most destructive wildfires (buildings destroyed) have occurred since the year 2000.
 [New charts from NCEI raise awareness of the potential for multiple, cascading hazards, which historically can occur from season to season. Courtesy of NOAA NCEI.]
As noted in the Climate Science Special Report of the Fourth National Climate Assessment, "The physical and socioeconomic impacts of compound extreme events (such as simultaneous heat and drought, wildfires associated with hot and dry conditions, or flooding associated with high precipitation on top of snow or waterlogged ground) can be greater than the sum of the parts.”
In addition to the climatology, NCEI also offers interactive state-level disaster frequency and cost charts for the last 40 years, from 1980 to present. This includes all 50 states, Puerto Rico, and the U.S. Virgin Islands.
[New charts from NCEI raise awareness of the potential for multiple, cascading hazards, which historically can occur from season to season. Courtesy of NOAA NCEI.]
As noted in the Climate Science Special Report of the Fourth National Climate Assessment, "The physical and socioeconomic impacts of compound extreme events (such as simultaneous heat and drought, wildfires associated with hot and dry conditions, or flooding associated with high precipitation on top of snow or waterlogged ground) can be greater than the sum of the parts.”
In addition to the climatology, NCEI also offers interactive state-level disaster frequency and cost charts for the last 40 years, from 1980 to present. This includes all 50 states, Puerto Rico, and the U.S. Virgin Islands.
[Maps show the number of times each state has been affected by each of six types of billion-dollar weather and climate disasters from January 1980 through March 2020. Note that each state did not necessarily experience the full billion-dollar cost for an event to be counted; it only needed to be part of a regional event that caused one billion dollars or more in direct damages. Courtesy of NOAA NCEI]
A new NCEI tool is designed to help users investigate the climatological (long-term) frequency of these events across the Nation and its regions. The climatology provides visualization tools, such as graphs and figures, for several regions and all U.S. states. This can be a useful way for decision-makers to utilize historical data to understand which types of large events typically occur at what times of year, by region. The information also raises awareness of the potential for multiple, cascading hazards, which historically can occur from season to season.
Understanding Hazards by Event Type
NCEI’s 40-year climatology of U.S. billion-dollar disasters offers a more detailed view of risk from extreme events, which are often seasonal in nature. For example, during the spring through early summer, severe storms, including tornadoes, hail, and high winds, often occur in the United States. The billion-dollar threshold events of this type are denoted in green in the figure below. They typically occur in, but aren’t limited to, the Plains, Midwest, and Southeast.
[Number of billion-dollar disaster events by month and by hazard type for the United States since 1980. The chart reflects the total duration of billion-dollar disasters events using begin-date and end-date; therefore, an event can span multiple months. Courtesy of NOAA NCEI.]
During the spring months, there is also the potential for major river flooding (shown above in dark blue). U.S. springtime flooding from snowmelt and/or heavy rainfall is a persistent hazard that affects many towns and agriculture regions within the Missouri and Mississippi River basins, among others. NOAA’s 2020 spring flood forecast offers perspective on how the risk of flood may unfold as it did in 2019, when river flooding damaged communities across numerous states.
During the fall season, Gulf and Atlantic coast states must be vigilant about hurricane season, particularly during August and September (shown above in yellow). Hurricanes are the most destructive and costly billion-dollar disasters—totaling damage losses near $1 trillion since 1980. For example, in 2016–2018, the U.S. was impacted by six separate billion-dollar hurricanes (Matthew, Harvey, Irma, Maria, Florence, and Michael) with an inflation-adjusted loss total of $339.2 billion and 3,318 fatalities. As a comparison, the United States also experienced a series of active hurricane seasons from 2003–2005 where nine separate billion-dollar hurricanes (Isabel, Charley, Frances, Ivan, Jeanne, Dennis, Katrina, Rita, and Wilma) made landfall, with an inflation-adjusted loss total of $307.5 billion and 2,225 fatalities.
Lastly, the peak of the Western U.S. wildfire season occurs during the fall months of September, October, and November (shown above in orange). California, Oregon, and Washington often face wildfire risk and related poor air quality for weeks to months. Western wildfire risk is also becoming more hazardous, as 15 of the 20 largest California wildfires (in acreage) and 15 of the 20 most destructive wildfires (buildings destroyed) have occurred since the year 2000.
Understanding Hazards by Frequency
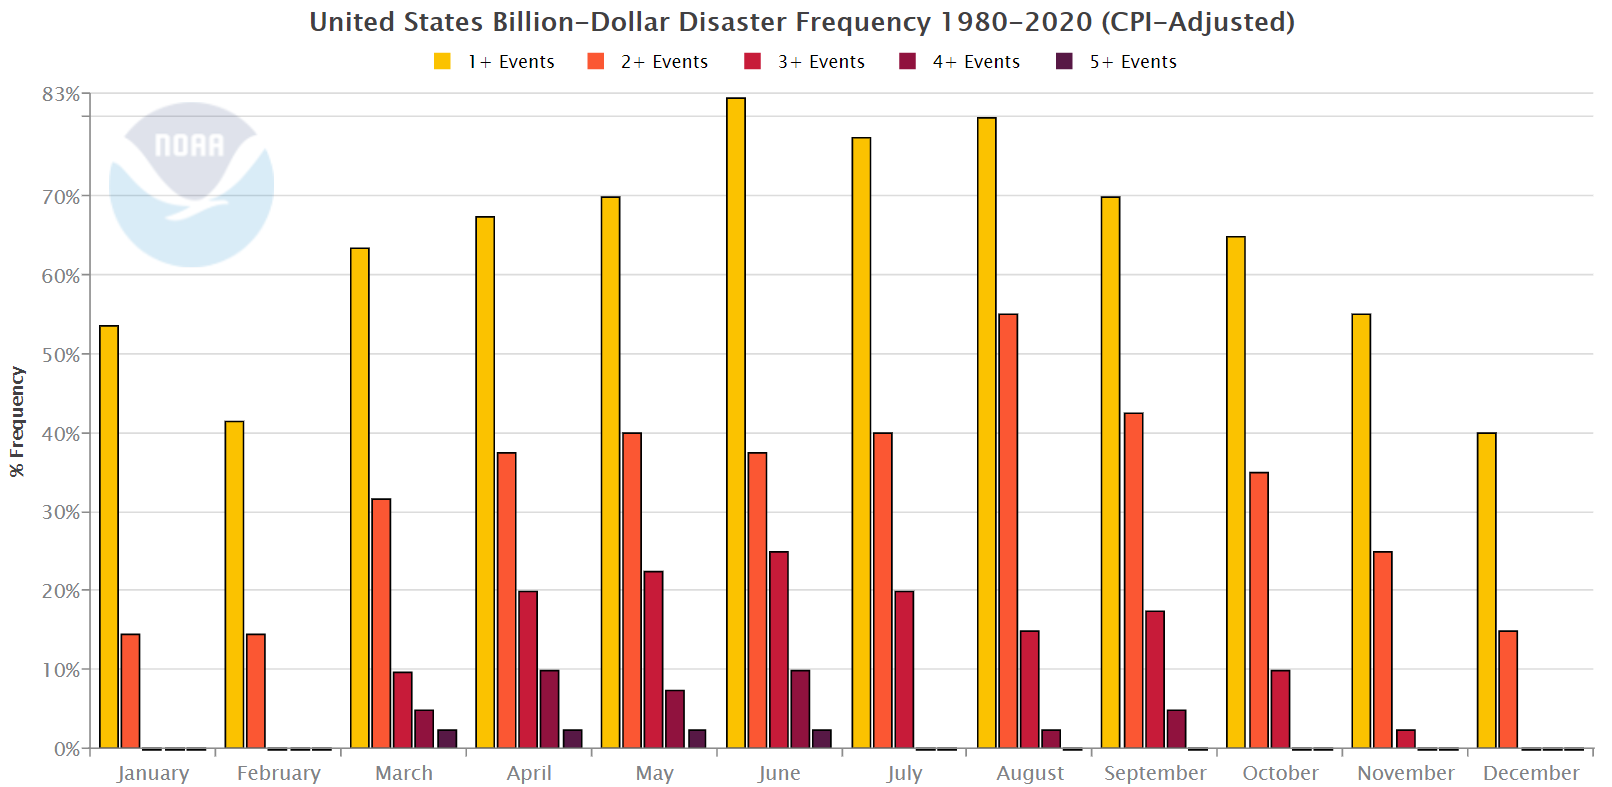
Each U.S. region faces a unique combination of recurring hazards, as billion-dollar disaster events have affected every state since 1980. In the figure below, the frequency of billion-dollar disasters differs across the calendar. The bars show how often and how many simultaneous events occur across the country. For example, more than 80% of Junes since 1980 have had at least one active billion-dollar disaster, while nearly a quarter (25%) of Junes have at least three active such events.
[New charts from NCEI raise awareness of the potential for multiple, cascading hazards, which historically can occur from season to season. Courtesy of NOAA NCEI.]
As noted in the Climate Science Special Report of the Fourth National Climate Assessment, "The physical and socioeconomic impacts of compound extreme events (such as simultaneous heat and drought, wildfires associated with hot and dry conditions, or flooding associated with high precipitation on top of snow or waterlogged ground) can be greater than the sum of the parts.”
In addition to the climatology, NCEI also offers interactive state-level disaster frequency and cost charts for the last 40 years, from 1980 to present. This includes all 50 states, Puerto Rico, and the U.S. Virgin Islands.All Weather News
More

Flooding, Severe Storms Target the Midwest Again
After an active week of storms across the nor
1 Aug 2026 1:40 AM


After Reaching Category 5, Genevieve Weakens in the Pacific
PacificFausto is now a post-tropical cyclone.
31 Jul 2026 1:30 AM

Flooding Risk Increases as Heavy Rain Targets the Tri-State Area
Tuesday, heavy rainfall moved across the Nort
30 Jul 2026 12:25 AM

Severe Weather: Energy From the Midwest Now in the Southeast
UPPER MIDWEST - Through Monday, dangerous tor
29 Jul 2026 10:30 PM