Buoy Data and Tsunami Preparedness
NCEI Archives Ocean Observations from DART®
Working in conjunction with several organizations, NCEI compiles a historical record of ocean changes from sensors and buoys positioned in the ocean. The data help scientists and researchers understand the nature of tsunamis. A fleet of 39 DART® buoys, which stands for Deep-ocean Assessment and Reporting of Tsunamis, comprise the frontline of tsunami detection and observations for the Nation. NCEI archives data from these buoys that researchers use to write assessments and develop models that enhance prediction capabilities. Since 2001, NCEI has archived information from DART® and coastal tide gauge stations as part of its collection of natural hazards data. DART® data help improve coastal resiliency to one of the deadliest hazards on the planet. Since the beginning of the 19th century, tsunami events have caused more than 700 deaths and nearly $2 billion in economic losses to U.S. coastal states and territories. [Map of DART® buoy locations. Red diamonds indicate U.S. buoys. Courtesy of NOAA National Data Buoy Center.]
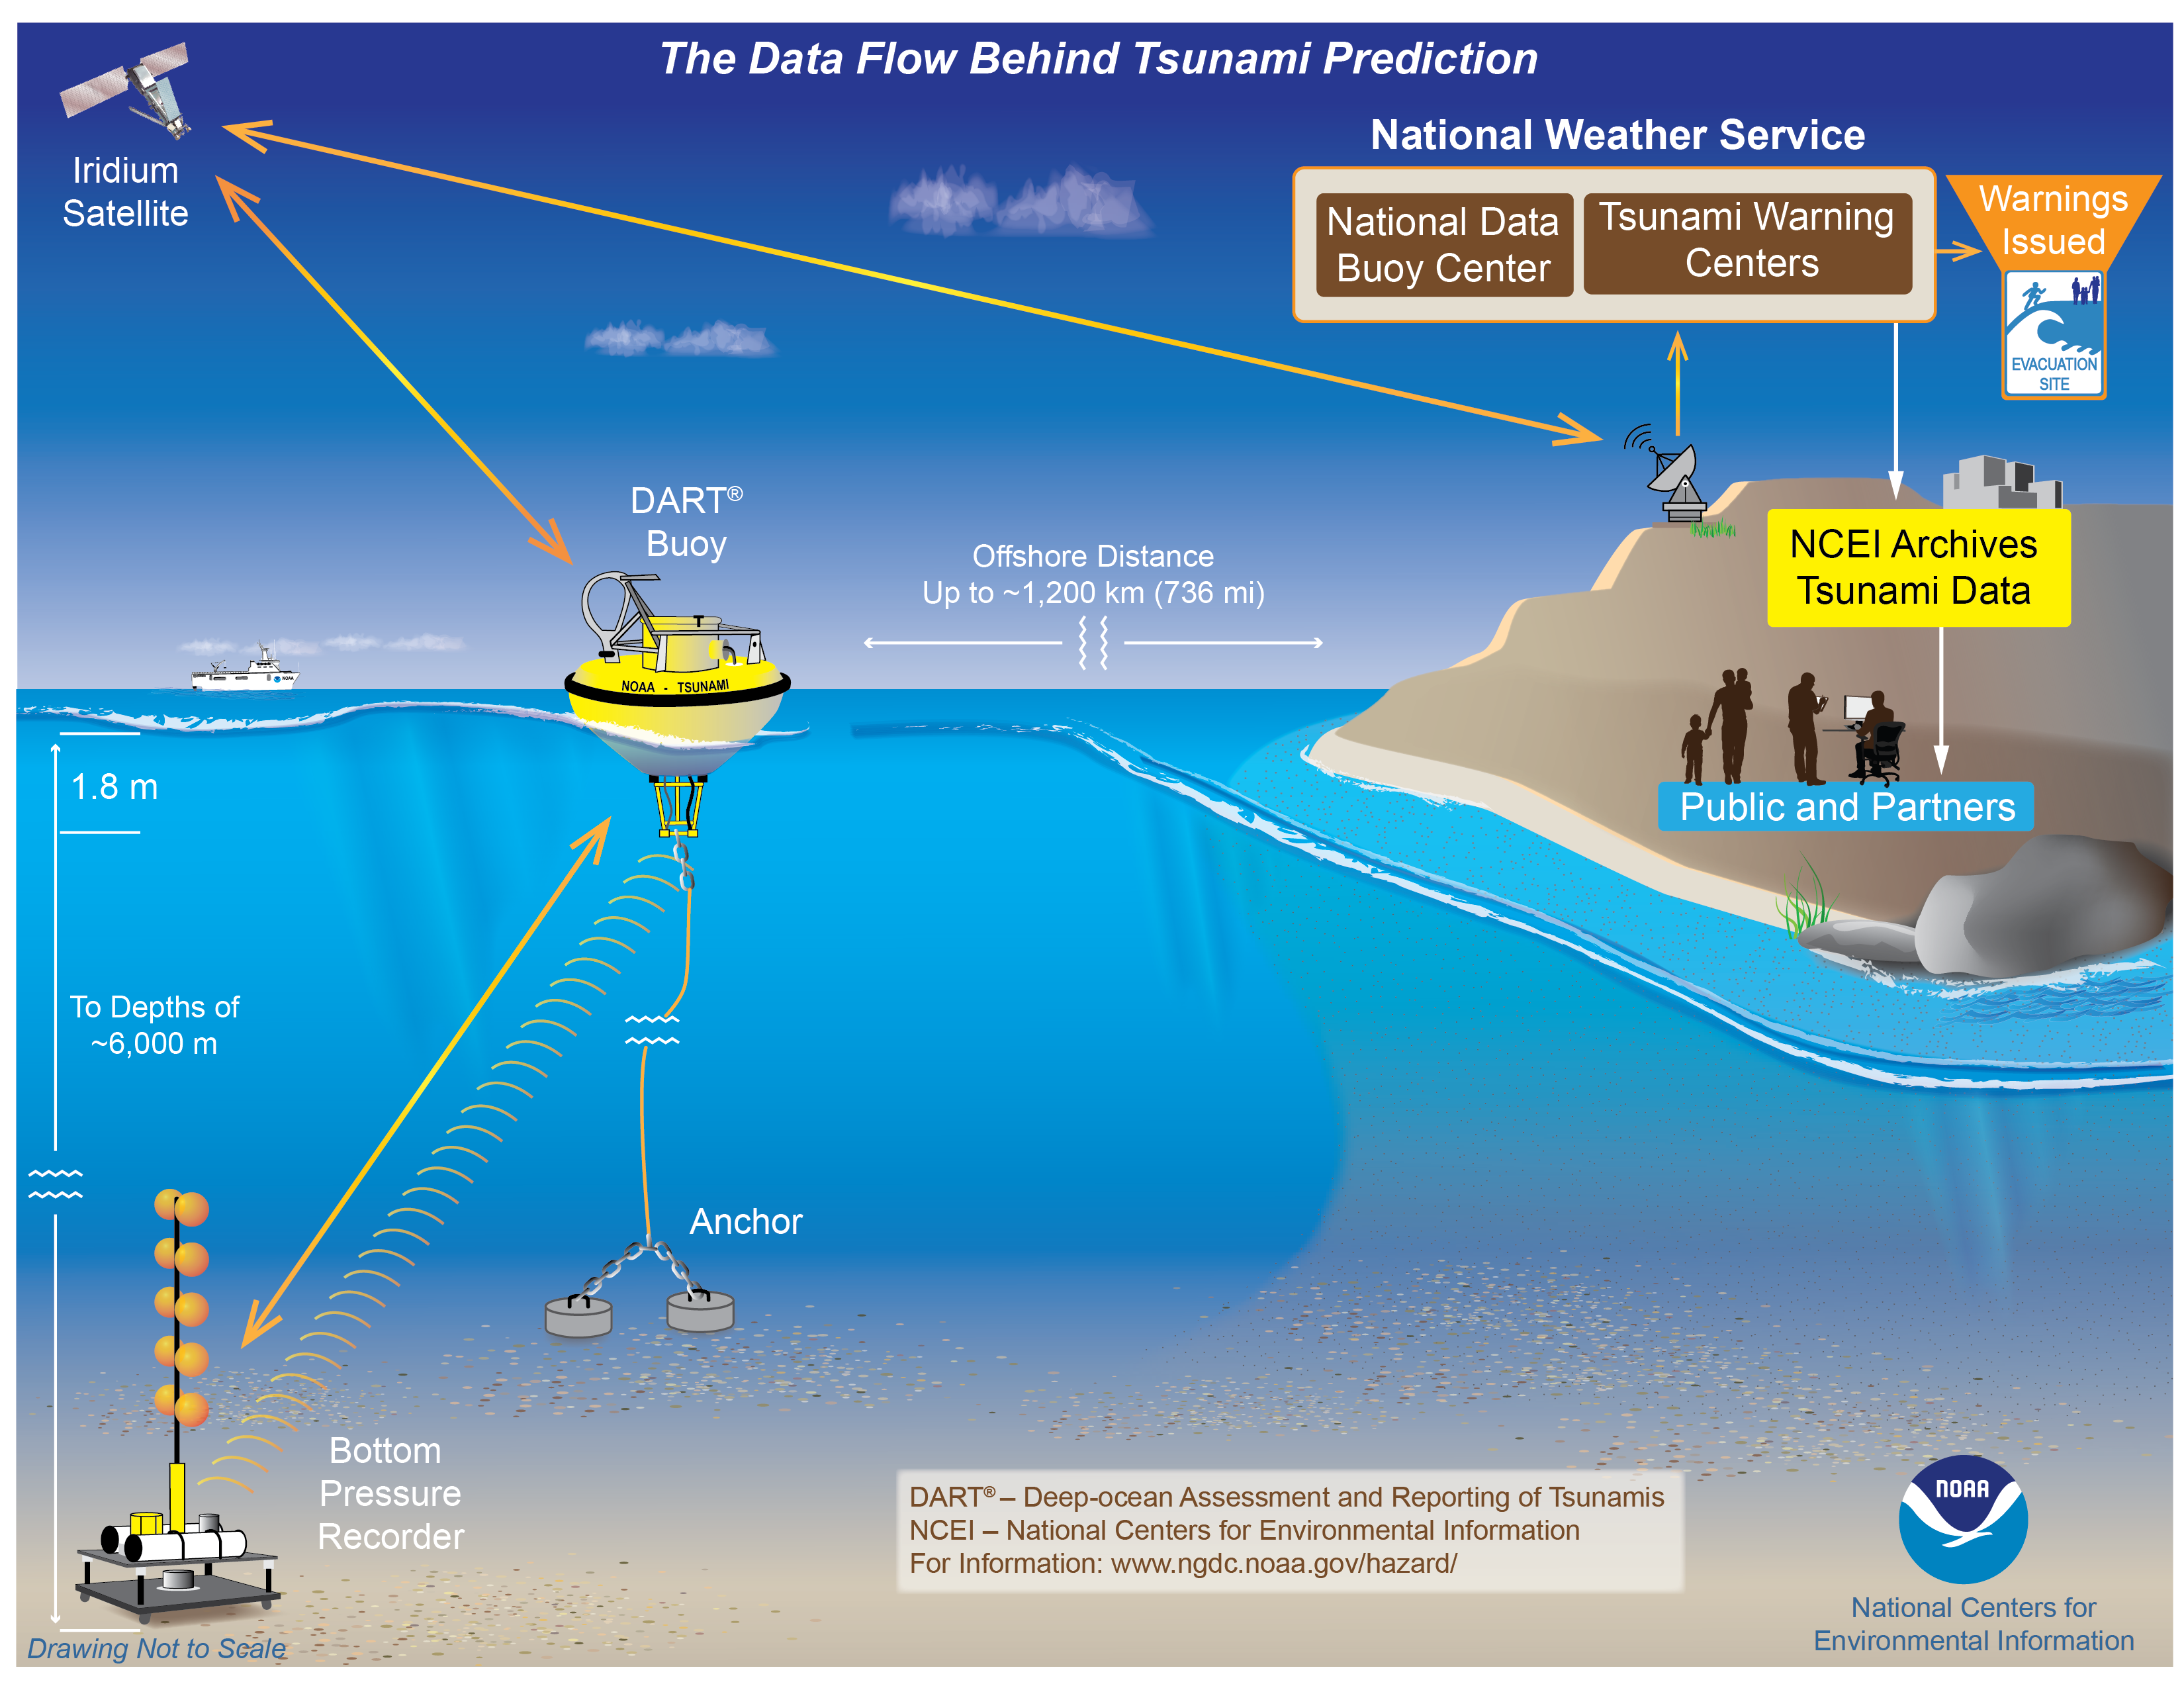
Anchored primarily in the Pacific Ocean, the DART® buoy system—equipped with bottom pressure recorders or BPRs—monitors wave changes that may indicate a hazard. A BPR measures slight changes in pressure that can indicate a disturbance. Changes in the ocean can be caused by underwater earthquakes, landslides, volcanoes, or other large impacts such as meteors.
The National Weather Service, the lead office for the NOAA National Data Buoy Center (NDBC) and the NOAA Tsunami Warning Centers, monitors real-time conditions to determine imminent risks. NCEI later places data from NDBC in its holdings for use by the scientific community to improve forecasts, warnings, and research, as well as to produce inundation maps and hazard assessments.
Ships also retrieve retrospective data from the BPRs on removable disks that store data at higher resolutions. NCEI stores both satellite and ship-collected data for future research and modeling.
DART® buoys are just one type of buoy in a worldwide network providing essential observations used in public safety products, including marine and tropical storm forecasts, as well as tsunami warnings. The data provided are real-time, high-quality meteorological, oceanographic, and environmental data.
[Map of DART® buoy locations. Red diamonds indicate U.S. buoys. Courtesy of NOAA National Data Buoy Center.]
Anchored primarily in the Pacific Ocean, the DART® buoy system—equipped with bottom pressure recorders or BPRs—monitors wave changes that may indicate a hazard. A BPR measures slight changes in pressure that can indicate a disturbance. Changes in the ocean can be caused by underwater earthquakes, landslides, volcanoes, or other large impacts such as meteors.
The National Weather Service, the lead office for the NOAA National Data Buoy Center (NDBC) and the NOAA Tsunami Warning Centers, monitors real-time conditions to determine imminent risks. NCEI later places data from NDBC in its holdings for use by the scientific community to improve forecasts, warnings, and research, as well as to produce inundation maps and hazard assessments.
Ships also retrieve retrospective data from the BPRs on removable disks that store data at higher resolutions. NCEI stores both satellite and ship-collected data for future research and modeling.
DART® buoys are just one type of buoy in a worldwide network providing essential observations used in public safety products, including marine and tropical storm forecasts, as well as tsunami warnings. The data provided are real-time, high-quality meteorological, oceanographic, and environmental data.
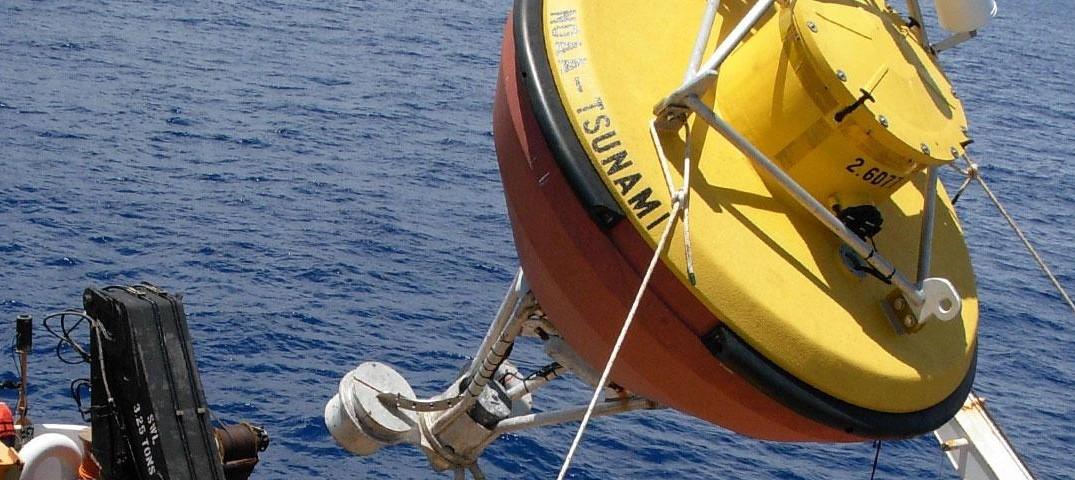
 [NCEI stores information and data about tsunamis for research and improvements in predictions. Courtesy of NOAA NCEI, Deb Misch.]
DART®: More Than a Pub Game
DART® buoys are to oceans what satellites are to space. Like satellites orbiting near and far from Earth, the buoys are positioned near and far from densely populated shorelines, up to 1,200 km from land. Locations are determined based on their historical risk for tsunami or seismic events. Because the ocean is so vast and subject to severe weather, buoys are designed to work independently in many types of harsh conditions.
Packed with battery-operated sensors, a buoy receives measurements from the BPR that indicate the distribution and frequency of sea-level height. Readings include: the date, the time, and the water pressure above the instrument. The rate of change from one reading to the next tells observers whether an event may be occurring. An occurrence outside the norm switches the buoy’s reporting system from “standard” to “event-mode,” increasing scheduled transmissions by acoustic link to those monitoring readings day and night. Observers can also send instructions to the system to collect readings more frequently. Thus, communications between land and buoy are bi-directional.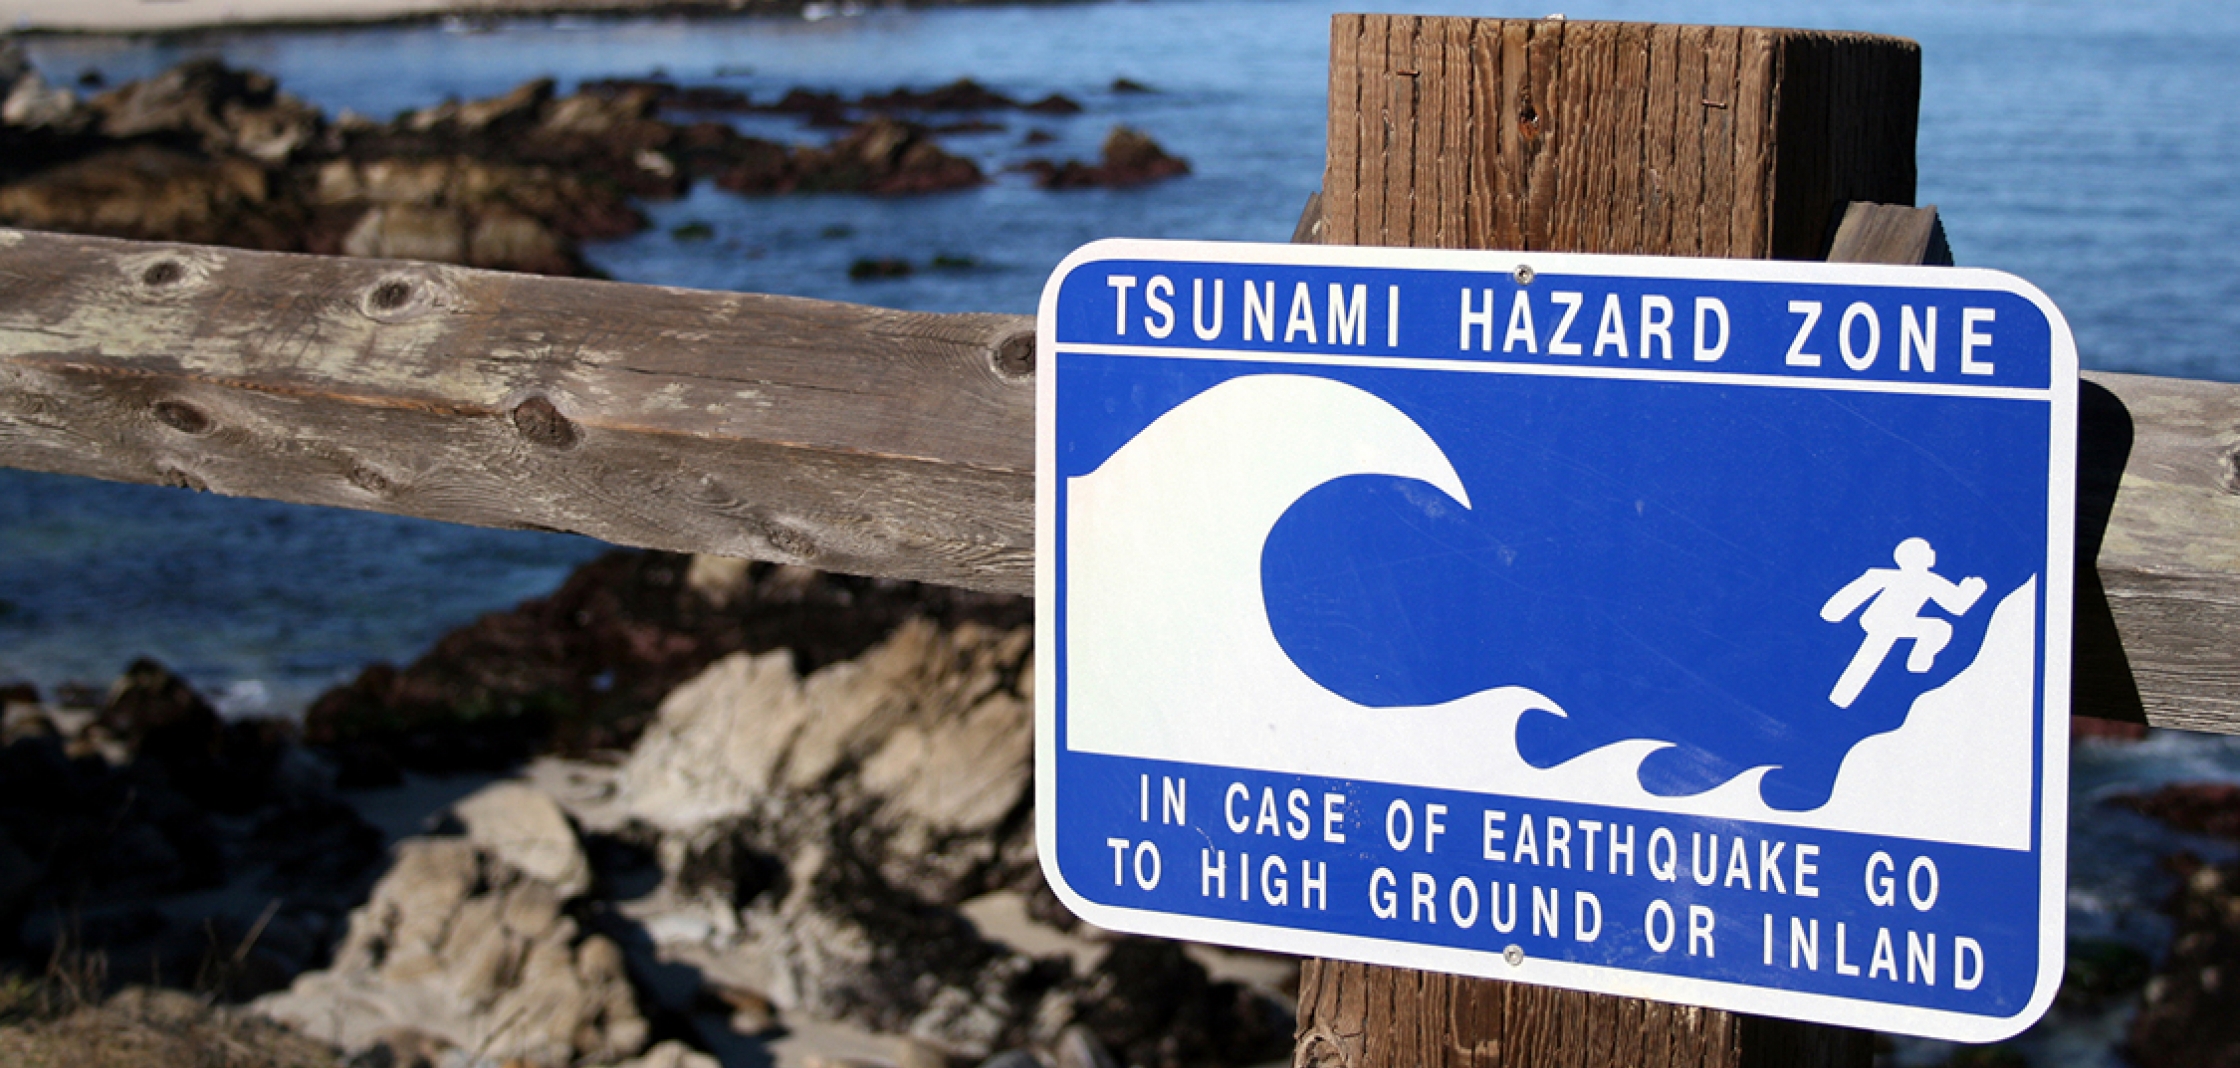
Tsunami Risk Assessments
NCEI catalogs information about past tsunamis in the Global Historical Tsunami Database, which NOAA uses to produce qualitative tsunami hazard assessments at regional levels. These assessments focus on locations where tsunami waves have been observed by eyewitnesses and are based on the distribution and frequency of runups, post-tsunami field surveys, tide gauges or deep ocean sensors, and deaths due to tsunamis.Though tsunamis are rare, their destruction far exceeds many types of hazards. Typically caused by earthquakes, tsunami waves can reach as high as four stories. One of the most catastrophic events in U.S. history occurred in Alaska. In March 1964, a devastating 9.2 magnitude earthquake and subsequent tsunamis ravaged coastal communities in Prince William Sound and claimed more than 130 lives.
Since then, many more tsunami events have been catalogued by NOAA across the globe. Other organizations use the data, including the NOAA Center for Tsunami Research and the International Tsunami Information Center, to name a few. NCEI data assist in planning for, responding to, and mitigating future events. Edited for WeatherNation by Mace Michaels


