Grading the 2019-2020 Winter Outlook
Special Stories
30 Mar 2020 2:00 AM
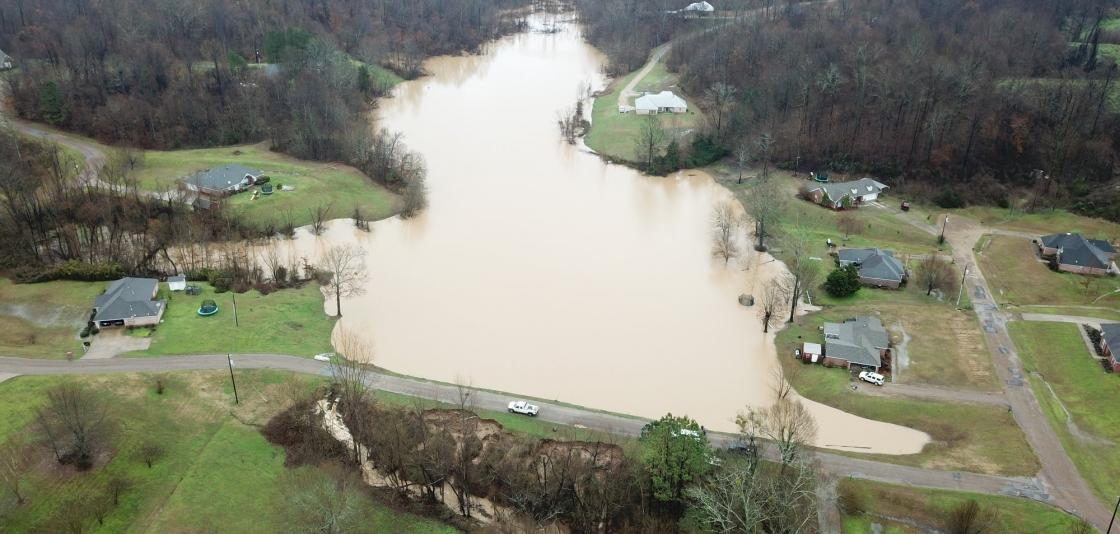
[February 11, 2020 — An aerial photo of a levee failure that flooded the Springridge Place Subdivision in Yazoo County, Mississippi, following heavy rainfall. Four homes and a church were threatened. From MS Emergency Management Agency via Facebook]
[From NOAA written by Tom Di Liberto] It’s March! A month I circle on the calendar every year because it means I get to write our verification post for the Climate Prediction Center’s Winter Outlook. Sometimes this article is full of deserved praise for an amazing forecast. Other times I spit hard truths about a not-so-great forecast, when that darn atmosphere decided to do something pretty unpredictable. Which will it be this year? Buckle yourself in as I go over just how well the forecast did for this past winter across the contiguous United States.
As a reminder, verification requires some math. So head to the many posts I’ve written on this topic (one, two, three, four, five) for a more in depth catch-up. And a quick reminder on seasonal outlooks: scientists assign a percent chance that the seasonal average temperature and total precipitation will fall into one of three categories—above average, below average, or near average. So each point on the map is predicting three things: the chance for above-, below- and near-average. It’s hard to layer three predictions on a single map, so the winter outlook map shows the favored category. If all categories have equal chances, then it’s white.
Ok, enough suspense. The 2019-2020 Winter Outlook did really well this past year for both temperature AND precipitation. WOOHOO! Let’s break it down individually before getting into some interesting things that happened this winter climate-wise.
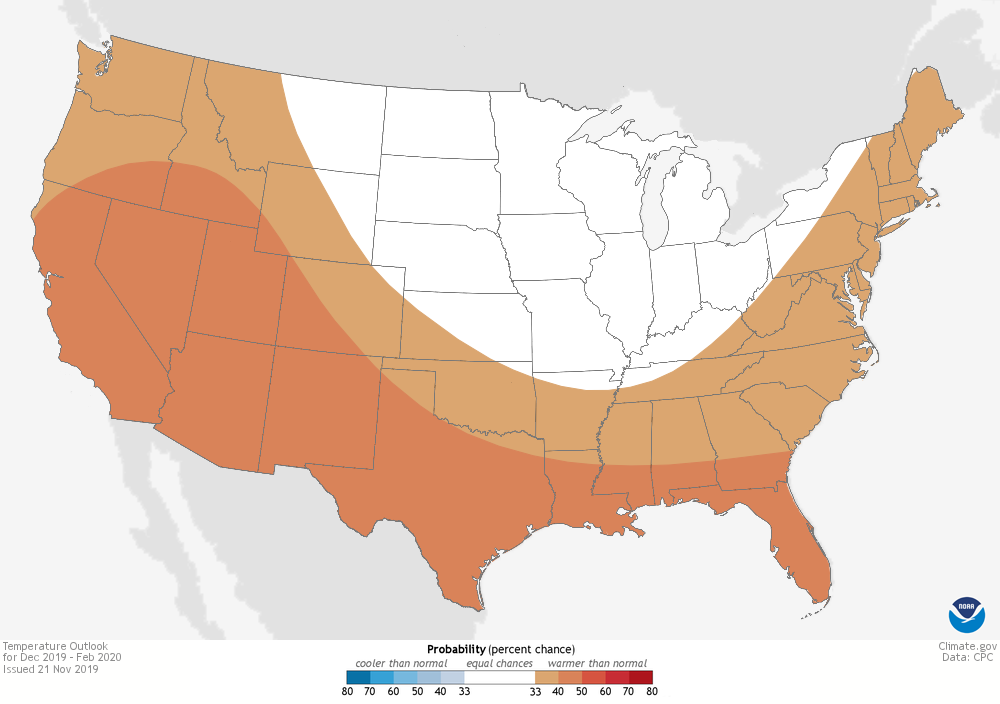 [Winter temperature outlook for December-February 2019-2020 issued on November 21, 2019. The colors denote places where the forecast odds favor a much colder than usual winter (blue colors) or much warmer than usual winter (red), or where the probability of a cold winter, a warm winter, or a near-normal winter are all equal (white). The darker the color, the stronger the chance of that outcome (not the bigger the departure from average). NOAA Climate map, based on data from NOAA CPC.]
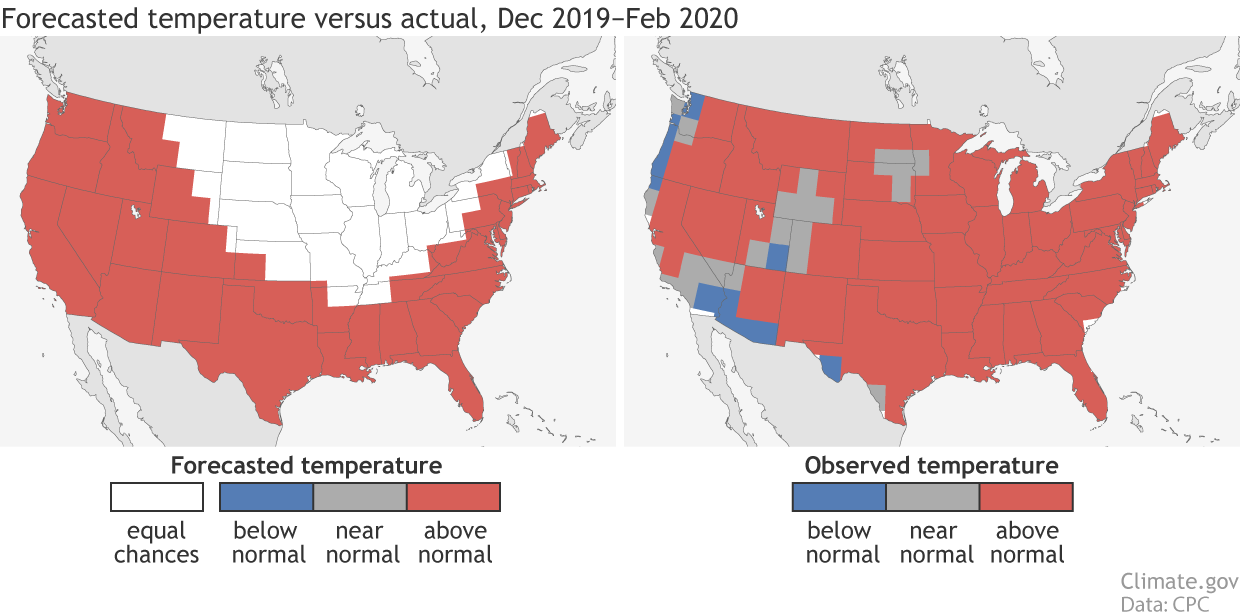 [(left) Temperature forecast for December-February 2019-20, made in mid-November. The colors show the forecast category with the highest probability. White areas are where all three outcomes (warm, cool, or average) were equally likely (each had a 33.3% chance of happening). (right) Observed temperature category for December-February 2019-20. NOAA Climate image based on CPC data.]
But let’s not just use our eyes to verify, as that can be misleading. CPC scientists instead use a verification metric known as the Heidke Skill Score (HSS). The HSS tallies up how often the outlook hit or missed the mark and then compares how often the forecast would have been right just by luck. Any HSS greater than 0 means that the outlook was better than just random guessing. The higher the number, the better the forecast.
The HSS for the 2019-2020 Winter Outlook was a 47 for the contiguous US and rose to over 70 if we just looked at areas where forecasters favored one category over the others (all forecasts that weren’t equal chances). To put this into perspective, this was the best winter outlook HSS in 14 years when looking at just the favored categories! And it was also far and away the best Winter Outlook temperature HSS during an ENSO-neutral winter since outlooks started in the mid-1990s (2). As ENSO and the trend are the largest sources of skill for seasonal outlooks, making an outlook during an ENSO-neutral period is generally harder. It’s like asking a chef to make a fancy dinner but removing his favorite pots and pans. All of which makes this winter’s forecast even more remarkable.
[(left) Temperature forecast for December-February 2019-20, made in mid-November. The colors show the forecast category with the highest probability. White areas are where all three outcomes (warm, cool, or average) were equally likely (each had a 33.3% chance of happening). (right) Observed temperature category for December-February 2019-20. NOAA Climate image based on CPC data.]
But let’s not just use our eyes to verify, as that can be misleading. CPC scientists instead use a verification metric known as the Heidke Skill Score (HSS). The HSS tallies up how often the outlook hit or missed the mark and then compares how often the forecast would have been right just by luck. Any HSS greater than 0 means that the outlook was better than just random guessing. The higher the number, the better the forecast.
The HSS for the 2019-2020 Winter Outlook was a 47 for the contiguous US and rose to over 70 if we just looked at areas where forecasters favored one category over the others (all forecasts that weren’t equal chances). To put this into perspective, this was the best winter outlook HSS in 14 years when looking at just the favored categories! And it was also far and away the best Winter Outlook temperature HSS during an ENSO-neutral winter since outlooks started in the mid-1990s (2). As ENSO and the trend are the largest sources of skill for seasonal outlooks, making an outlook during an ENSO-neutral period is generally harder. It’s like asking a chef to make a fancy dinner but removing his favorite pots and pans. All of which makes this winter’s forecast even more remarkable.
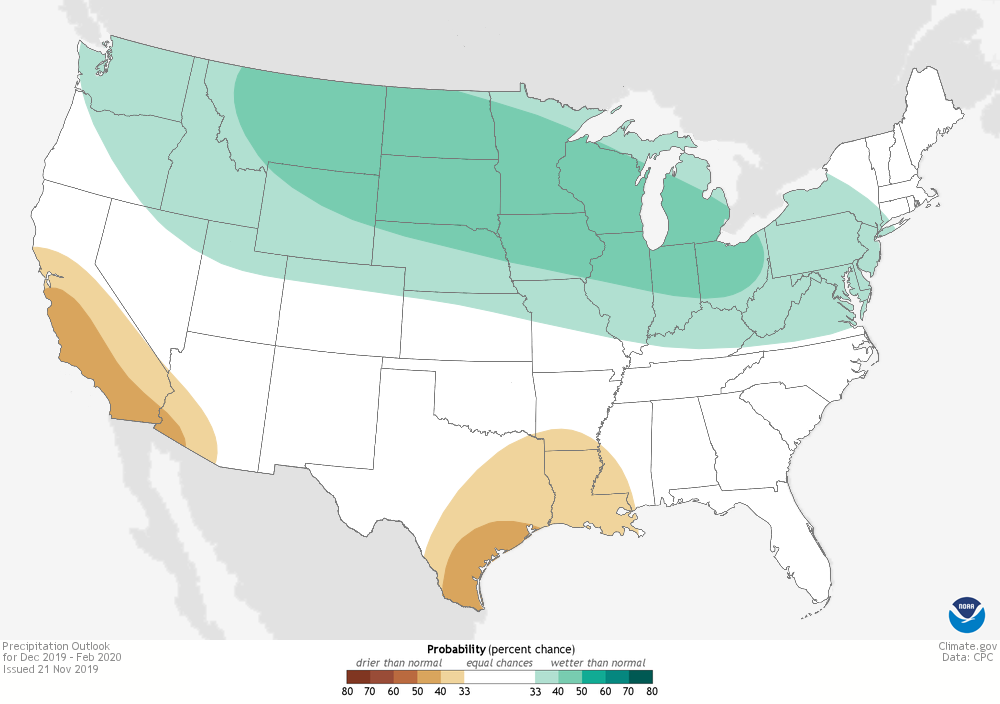 [Winter precipitation outlook for December-February 2019-2020 issued on November 21, 2019. The colors denote places where the forecast odds favor a much drier than usual winter (brown colors) or much wetter than usual winter (blue-green), or where the probability of a dry winter, a wet winter, or a near-normal winter are all equal (white). The darker the color, the stronger the chance of that outcome (not the bigger the departure from average) NOAA Climate map, based on data from NOAA CPC.]
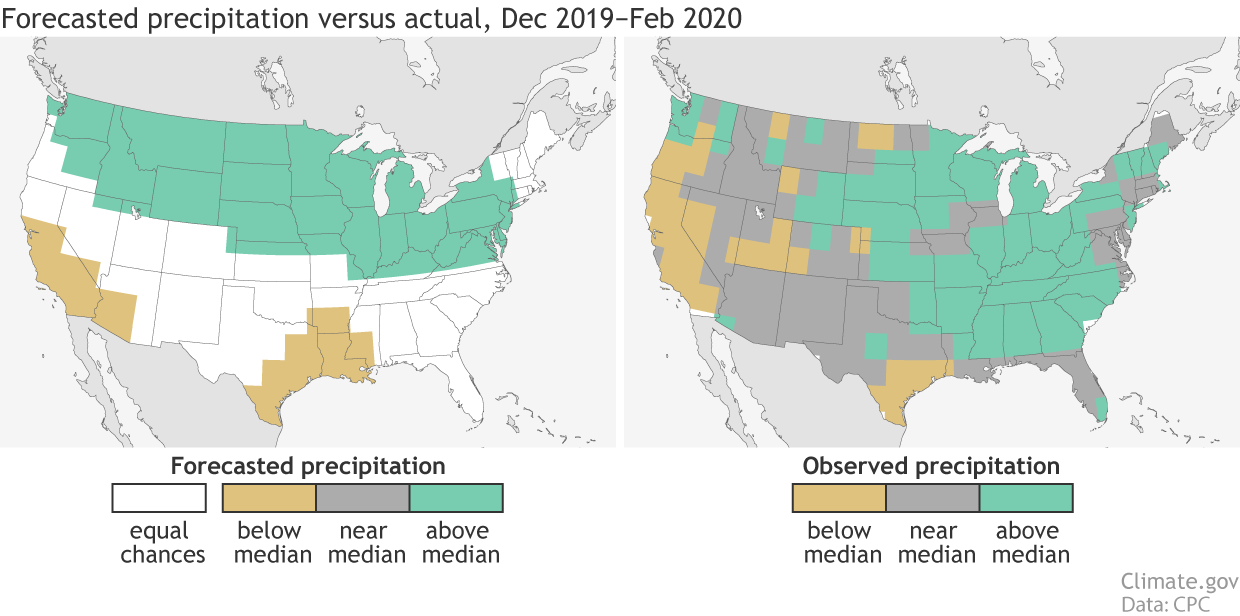 [(left) Precipitation forecast for December-February 2019-20, made in mid-November. The colors show the forecast category with the highest probability. White areas are where all three outcomes (wet, dry, average) were equally likely (each had a 33.3% chance of happening). (right) Observed precipitation category for December-February 2019-20. NOAA Climate image based on CPC data.]
The HSS for 2019-2020 winter precipitation outlook was 20, which rose to 34 when looking only at forecasts that were not equal chances. Remember, this grade isn’t like your term paper: anything above 0 is good! This puts this year’s outlook solidly in the camp of skillful forecasts, drastically outpacing the average winter outlook precipitation HSS in outlooks made back to 1996 (3).
[(left) Precipitation forecast for December-February 2019-20, made in mid-November. The colors show the forecast category with the highest probability. White areas are where all three outcomes (wet, dry, average) were equally likely (each had a 33.3% chance of happening). (right) Observed precipitation category for December-February 2019-20. NOAA Climate image based on CPC data.]
The HSS for 2019-2020 winter precipitation outlook was 20, which rose to 34 when looking only at forecasts that were not equal chances. Remember, this grade isn’t like your term paper: anything above 0 is good! This puts this year’s outlook solidly in the camp of skillful forecasts, drastically outpacing the average winter outlook precipitation HSS in outlooks made back to 1996 (3).
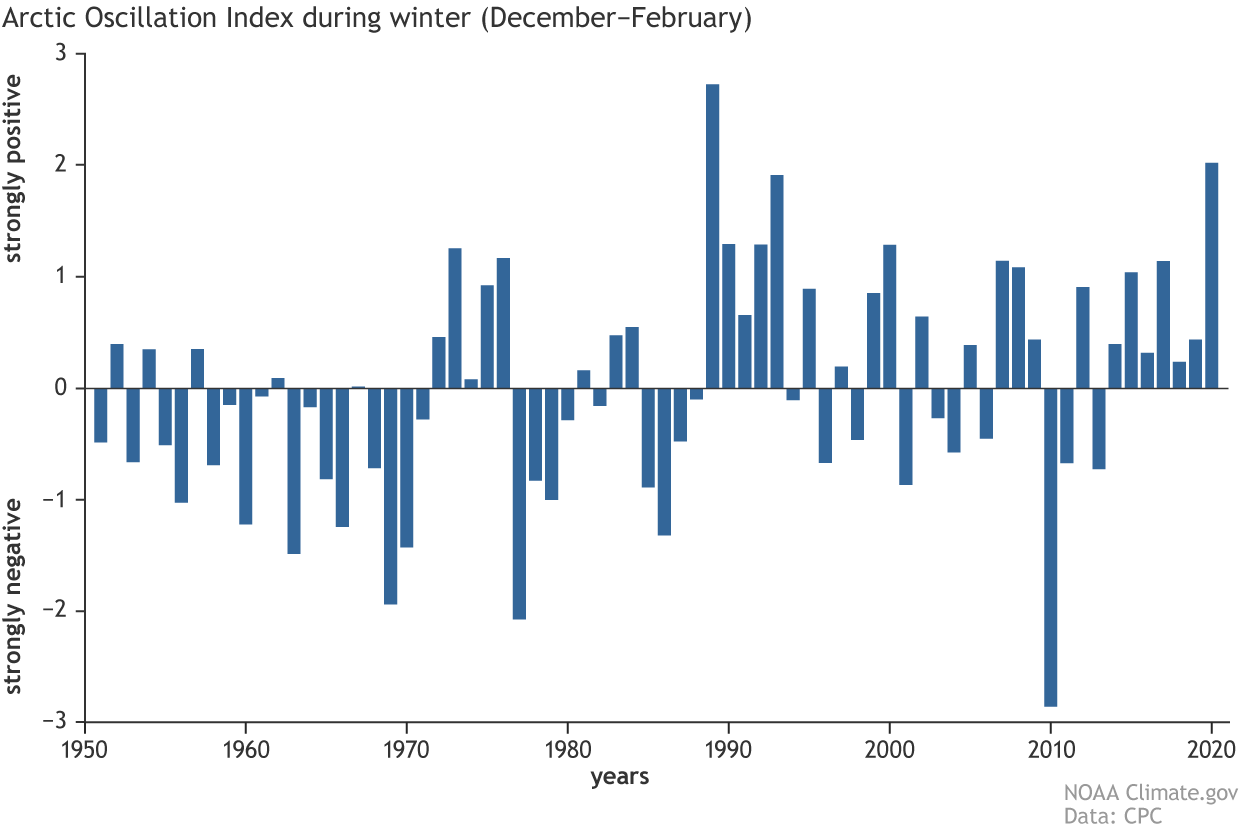 [Arctic Oscillation Index for the December-February period (northern hemisphere winter) from 1950 through 2020. Higher positive values reflect a strongly positive phase of the Arctic Oscillation while lower negative values reflect a strongly negative phase of the Arctic Oscillation. NOAA Climate image using data from NOAA's CPC.]
[Winter temperature outlook for December-February 2019-2020 issued on November 21, 2019. The colors denote places where the forecast odds favor a much colder than usual winter (blue colors) or much warmer than usual winter (red), or where the probability of a cold winter, a warm winter, or a near-normal winter are all equal (white). The darker the color, the stronger the chance of that outcome (not the bigger the departure from average). NOAA Climate map, based on data from NOAA CPC.]
It’s getting hot(ter than normal) in here – said literally almost everywhere.
When the Winter Outlook was finalized in November of 2019, scientists painted reds liberally across the map, indicating a tilt in the odds towards a warmer-than-average winter for the East and West Coast and the southern tier of the United States. Forecasters were leaning into this idea because they anticipated an ENSO-neutral winter, and so they expected that the long-term trends would mostly dominate. The rest of the country had equal odds for above-average, below-average, or near-average temperature (1). And warmth did extend across even more of the contiguous United States, with this past winter finishing as the sixth warmest on record. A warmer-than-average winter was observed by much of the Mountain West, and the central and eastern United States. The only localized areas that experienced a cooler-than-average or even near-average winter were coastal areas along the Pacific Northwest, southern areas in the U.S. Southwest, and locations in Wyoming and the Dakotas. Overall, that was a pretty good forecast, nailing the idea of a warmer-than-average winter for most of the country.
[(left) Temperature forecast for December-February 2019-20, made in mid-November. The colors show the forecast category with the highest probability. White areas are where all three outcomes (warm, cool, or average) were equally likely (each had a 33.3% chance of happening). (right) Observed temperature category for December-February 2019-20. NOAA Climate image based on CPC data.]
But let’s not just use our eyes to verify, as that can be misleading. CPC scientists instead use a verification metric known as the Heidke Skill Score (HSS). The HSS tallies up how often the outlook hit or missed the mark and then compares how often the forecast would have been right just by luck. Any HSS greater than 0 means that the outlook was better than just random guessing. The higher the number, the better the forecast.
The HSS for the 2019-2020 Winter Outlook was a 47 for the contiguous US and rose to over 70 if we just looked at areas where forecasters favored one category over the others (all forecasts that weren’t equal chances). To put this into perspective, this was the best winter outlook HSS in 14 years when looking at just the favored categories! And it was also far and away the best Winter Outlook temperature HSS during an ENSO-neutral winter since outlooks started in the mid-1990s (2). As ENSO and the trend are the largest sources of skill for seasonal outlooks, making an outlook during an ENSO-neutral period is generally harder. It’s like asking a chef to make a fancy dinner but removing his favorite pots and pans. All of which makes this winter’s forecast even more remarkable.
[Winter precipitation outlook for December-February 2019-2020 issued on November 21, 2019. The colors denote places where the forecast odds favor a much drier than usual winter (brown colors) or much wetter than usual winter (blue-green), or where the probability of a dry winter, a wet winter, or a near-normal winter are all equal (white). The darker the color, the stronger the chance of that outcome (not the bigger the departure from average) NOAA Climate map, based on data from NOAA CPC.]
How wet was this winter?
Precipitation is harder to forecast than temperature because it’s just more variable than temperature. One large weather event over just a few days can skew seasonal totals making things noisier. With that in mind, what did CPC think would happen this winter? The outlook had a tilt in the odds towards a wetter-than-average winter across the northern half of the United States, and a drier-than-average winter across California and the western Gulf of Mexico in Texas and Louisiana. In fact, much of that came true. It was drier than average across California and the western Gulf of Mexico, and a good portion of the northern tier of the contiguous US was wetter than average. The major difference between reality and the outlook was the extremely wet winter across the Southeast US, and near-average precipitation that fell in North Dakota, Montana and Idaho. But seriously, that is really splitting hairs.
[(left) Precipitation forecast for December-February 2019-20, made in mid-November. The colors show the forecast category with the highest probability. White areas are where all three outcomes (wet, dry, average) were equally likely (each had a 33.3% chance of happening). (right) Observed precipitation category for December-February 2019-20. NOAA Climate image based on CPC data.]
The HSS for 2019-2020 winter precipitation outlook was 20, which rose to 34 when looking only at forecasts that were not equal chances. Remember, this grade isn’t like your term paper: anything above 0 is good! This puts this year’s outlook solidly in the camp of skillful forecasts, drastically outpacing the average winter outlook precipitation HSS in outlooks made back to 1996 (3).
[Arctic Oscillation Index for the December-February period (northern hemisphere winter) from 1950 through 2020. Higher positive values reflect a strongly positive phase of the Arctic Oscillation while lower negative values reflect a strongly negative phase of the Arctic Oscillation. NOAA Climate image using data from NOAA's CPC.]
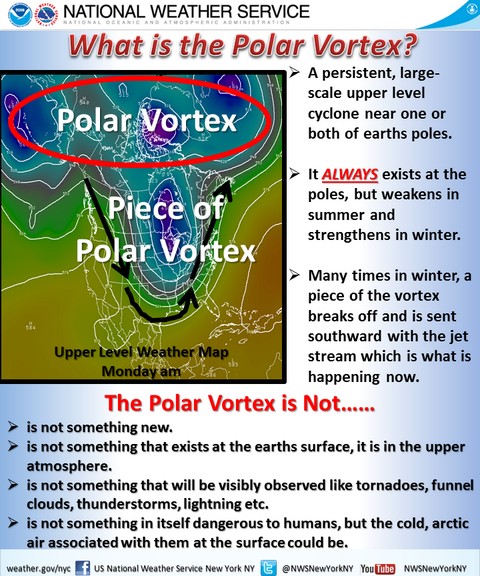
You’re going to mention the Polar Vortex aren’t you?
OF COURSE! It’s a post on winter. Plus, this allows me to be all science-splainy. Did you know that both the tropospheric and stratospheric polar vortexes were really strong this winter? And that when we hear about the polar vortex in the news unleashing cold temperatures across the US, it’s because the tropospheric vortex is really weak? Well… it’s true! Read about the finer details of the polar vortex in this great post. One way we can measure the strength of the tropospheric polar vortex is to take a look at the strength of the Arctic Oscillation (AO). And twice during February, the AO index hit all-time daily highs. Overall, the AO for the December-February season was close to the second highest since 1950. A positive AO, and strong polar vortex means that jet stream was farther north than normal, leading to the cold air remaining across the far north. This jet stream configuration resulted in a colder-than-average winter in Alaska and northwestern Canada while contributing to the warmer-than-average contiguous US (4).
The last word
The warmth across the United States followed a pattern set across the entire planet as this past northern hemisphere winter (December-February) was the second warmest on record back to 1880, behind only the El Niño-fueled winter of 2015-2016. The fact that this past winter finished #2 globally during an ENSO-neutral period is amazing, and consistent with a warming world. But bringing this back to the contiguous US and this outlook, the final word is this was a pretty great winter outlook for the contiguous United States. It’s that simple.Footnotes
(1) Equal chances are made when the forecasters feel there is no clear signal in any direction as to what will happen with temperatures or precipitation amounts. This could be due to a lack of confidence in the signal or a mixed signal being given by the models the forecasters look at. (2) Since 1996, there have been seven winters that occurred during an ENSO-Neutral period. (3) The average precipitation HSS for all forecast points was 18 and for just locations where forecasters favored a category, the average HSS was 8. (4) As with most things climate-related, there is some nuance here. CPC’s AO index doesn’t measure all aspects of the tropospheric polar vortex. It is but one measure of the anomalies in the tropospheric polar vortex. There are other climate patterns that can also relate to some more regional changes in the polar vortex, like the Pacific North American Pattern (PNA). The key fact is that these leading climate patterns (AO, PNA) are referring to anomalies (departures from average) in the polar vortex but the polar vortex itself is always there, spinning around. The AO index does, though, explain the largest fraction of anomalous variability in the polar vortex, and did a good job in describing the stronger polar vortex we saw this winter. Edited for WeatherNation by Meteorologist Mace MichaelsAll Weather News
More
Hurricane Flossie Continues to Weaken
Hurricane FlossieThe National Hurricane Cente
3 Jul 2025 2:50 AM

NHC Monitoring Front in the Southeast Ahead of 4th of July
Later this week, a frontal boundary is expect
3 Jul 2025 1:00 AM

Northern Plains to Upper Midwest Severe Storms Threaten Holiday Travel
NORTHERN PLAINS - A frontal system is expecte
3 Jul 2025 1:00 AM


Northwest Heat Met With Thunderstorm Risk
NORTHWEST - Today, portions of Montana are un
3 Jul 2025 12:00 AM

Near Seasonal Temperatures for Many Come July 4th!
AAA is expecting over 70 million travelers to
2 Jul 2025 6:40 PM

Severe Weather Threat Continues in the Midwest
It has been an active, severe season across t
30 Jun 2025 9:00 PM