JPSS Satellites Provide Unique Perspective of Hurricane Laura

news image
Special Stories
28 Sep 2020 2:00 AM
[Written by NOAA]  About two hours after Hurricane Laura made landfall last month on August 27th, hammering the Louisiana and Texas coasts with 150 mile-per-hour winds and an “unsurvivable” storm surge, the VIIRS instrument on the Suomi-NPP satellite captured the above image of the storm. The infrared image shows intense circulation and a clearly defined eye just north of the Gulf coastline and east of the Texas border. This corresponding nighttime Day-Night Band image below, also captured by VIIRS at 2:51 am CDT, shows a lightning streak in the Gulf and some lights still on in parts of Lake Charles, La., and Beaumont, Tex. Nearly a million residents of Texas and Oklahoma ended up losing power from Laura.

By the afternoon of August 27th, Laura had been downgraded by the National Hurricane Center to a tropical storm, with maximum sustained winds at 65 miles per hour and water levels still elevated along the Gulf Coast. Since slamming into the coast, the storm destroyed buildings, blown windows out from high rises, downed trees and power lines, and ripped the top off a bridge. 42 people lost their lives in the U.S. from Laura.

The Advanced Technology Microwave Sounder (ATMS) on Suomi-NPP, provided “a glimpse into the inner structure of the storm, showing well-defined circulation with convection completely surrounding it, with the coldest cloud temperatures centered on the northeast side of the eye,” according to William Straka III, a researcher for the Cooperative Institute for Meteorological Satellite Studies at the University of Wisconsin-Madison.

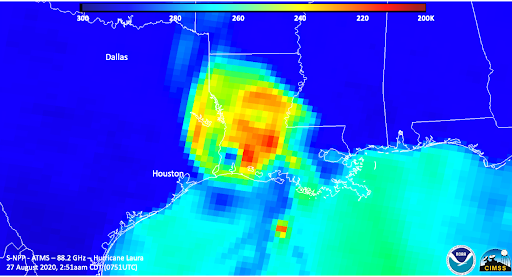
This is also where the most intense rain rates were found by the Microwave Integrated Retrieval System (MiRS) Rain Rate product, which is derived from ATMS, and part of the Climate Prediction Center morphing method (CMORPH2), a NOAA product that provides precipitation estimates from satellites.

The following animation shows the temperature differences between the core of the hurricane and its surrounding atmosphere, as observed by ATMS on the Suomi-NPP and NOAA-20 satellites as the storm gathered strength and intensified. This kind of warm core is typical to the structure of a hurricane, as described in this article from the journal Geophysical Research Letters. The larger the area of the core and the higher the temperature difference between the warm core and the area surrounding it, the more precipitation is produced.

According to NOAA, the peak coastal storm surge was measured at 12 to 21 feet, inundating many areas along the coast.

Edited for WeatherNation by Mace Michaels

All Weather News
More
Cold Blast Prompts Frost and Freeze Alerts

Cold Blast Prompts Frost and Freeze Alerts

WHAT TO EXPECTA blast of cold air has brought

21 Apr 2026 2:00 AM
Active Week Ahead for the West Coast

Active Week Ahead for the West Coast

CALIFORNIA - Rain has begun in California and

21 Apr 2026 1:55 AM
Severe Thunderstorms Ramp Back Up This Week

Severe Thunderstorms Ramp Back Up This Week

While the severe thunderstorm risk ends with

21 Apr 2026 1:40 AM
Extreme Drought Leads To Fire Concerns Across The Nation

Extreme Drought Leads To Fire Concerns Across The Nation

SOUTHEASTOver 96% of the Southeast is in mode

21 Apr 2026 1:20 AM
Record Snow, Record Rain, Rising Rivers

Record Snow, Record Rain, Rising Rivers

Flooding turned serious over the last week ac

20 Apr 2026 4:20 PM
Looking Back at Last Week's Severe Weather Outbreak

Looking Back at Last Week's Severe Weather Outbreak

Tornadoes, hail, wind, and rain slammed the M

20 Apr 2026 4:10 PM
Last Day of East Coast Record Heat, Big Cool Down on the Way

Last Day of East Coast Record Heat, Big Cool Down on the Way

High pressure has been dominant on the East C

19 Apr 2026 1:20 AM