NOAA and Community Scientists to Map Hottest Parts of 13 Cities This Summer
Special Stories
15 Jun 2020 2:00 AM
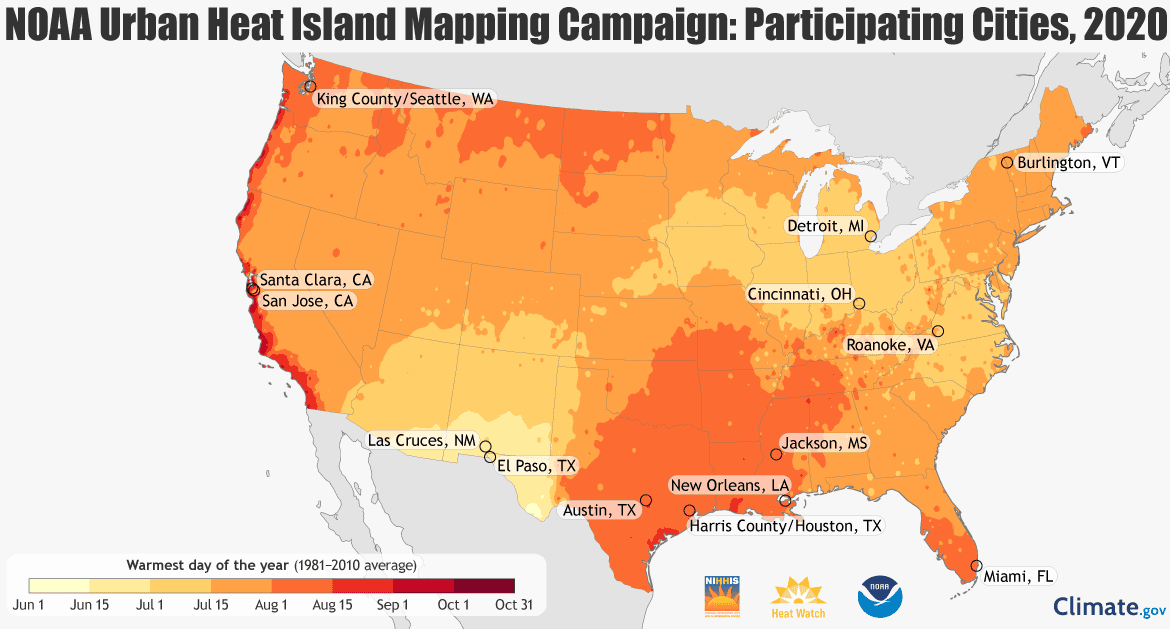
[This map shows the locations of the 2020 urban heat island mapping campaigns cohort. The background shows the average window for the day of the year with the highest maximum temperature based on the 1981-2010 U.S. Climate Normals, the nation’s official record of recent climate. The colors show date ranges progressing from June 1 (lightest yellow) through September 30 (darkest red). The darker the color, the later in the year the hottest day typically arrives. Credit: NOAA Climate.gov using data from NOAA NCEI.]
[Written by NOAA] Running barefoot from scorching asphalt to cool grass in the summertime as a kid, you likely learned how cityscapes tend to get much warmer than green spaces. Extreme heat can be fatal, and buildings and pavement increase its threat, making some parts of cities up to 20°F hotter than other parts.
This summer, citizen scientists will map these hot spots, known as “urban heat islands,” in 13 cities across the country to help communities identify areas where they can take action to protect people from heat stress.
The mapping campaigns build on three years of past campaigns that have produced urban heat maps for 11 other U.S. cities. They are part of a collaborative project supported by NOAA’s Climate Program Office (CPO) and jointly coordinated by the National Integrated Heat Health Information System (NIHHIS) — a NOAA and Centers for Disease Control and Prevention effort — and CAPA Strategies LLC. They
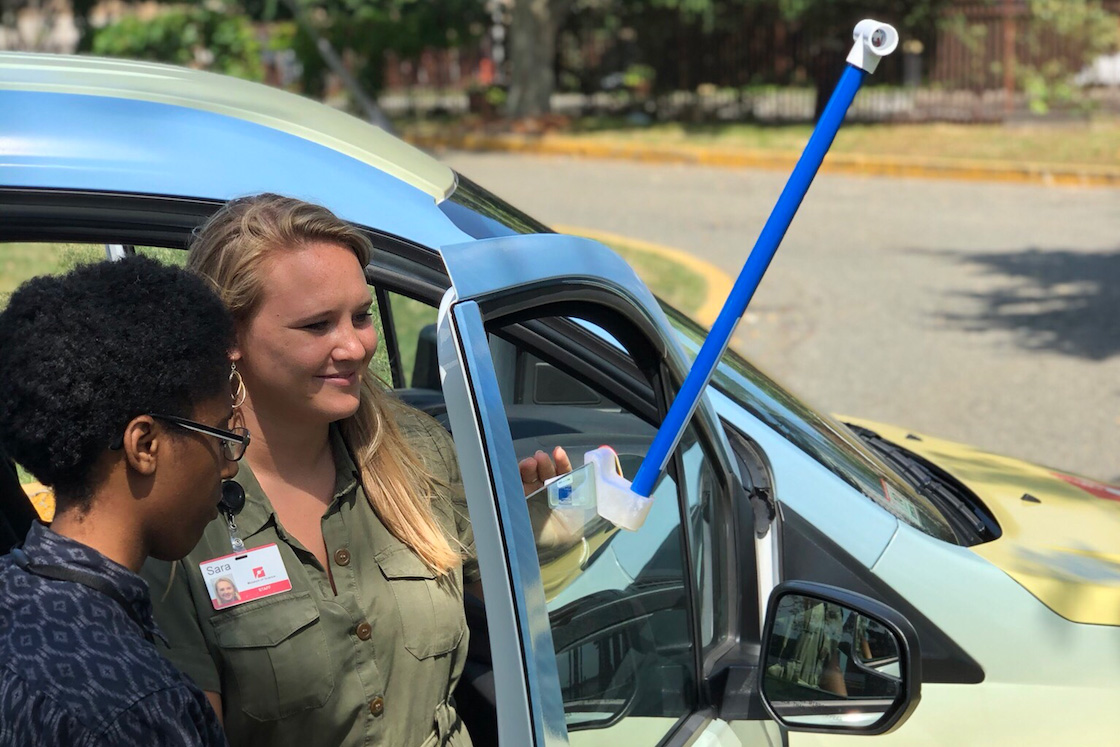 [Sara Benson (right) and Roxanne Lee (left), of Boston's Museum of Science, using a CAPA Heat Strategies sensor to investigate the July 20, 2019, extreme heat in Boston, Brookline, and Cambridge, Massachusetts during the 2019 campaign. Credit: Photo courtesy of Boston's Museum of Science.]
“Our mapping campaigns engage residents in the scientific process, while teaching them about the Urban Heat Island effect — the extreme temperature difference between cities and surrounding rural areas — and ways to mitigate risk,” said Hunter Jones, Climate and Health Project Manager with NIHHIS and CPO. “They also produce data sets that are directly useful for managing heat exposure in cities to prevent heat-related suffering and death.”
During one of the hottest days of the year in each of the 13 cities, volunteers will drive prescribed routes in the morning, afternoon, and evening with custom-engineered heat sensors mounted on their own cars. Once per second, the sensors will record temperature and humidity, as well as the exact time and location along the route.
Using the data collected, the CAPA team will produce detailed urban heat maps for the 13 cities that will help city officials and community groups identify specific neighborhoods that are vulnerable to extreme heat. The cities can then determine whether and how to implement strategies like adding trees and green roofs, varying the height of new buildings to increase airflow and create shade canyons, and providing more access to public water parks and air-conditioned spaces.
[Sara Benson (right) and Roxanne Lee (left), of Boston's Museum of Science, using a CAPA Heat Strategies sensor to investigate the July 20, 2019, extreme heat in Boston, Brookline, and Cambridge, Massachusetts during the 2019 campaign. Credit: Photo courtesy of Boston's Museum of Science.]
“Our mapping campaigns engage residents in the scientific process, while teaching them about the Urban Heat Island effect — the extreme temperature difference between cities and surrounding rural areas — and ways to mitigate risk,” said Hunter Jones, Climate and Health Project Manager with NIHHIS and CPO. “They also produce data sets that are directly useful for managing heat exposure in cities to prevent heat-related suffering and death.”
During one of the hottest days of the year in each of the 13 cities, volunteers will drive prescribed routes in the morning, afternoon, and evening with custom-engineered heat sensors mounted on their own cars. Once per second, the sensors will record temperature and humidity, as well as the exact time and location along the route.
Using the data collected, the CAPA team will produce detailed urban heat maps for the 13 cities that will help city officials and community groups identify specific neighborhoods that are vulnerable to extreme heat. The cities can then determine whether and how to implement strategies like adding trees and green roofs, varying the height of new buildings to increase airflow and create shade canyons, and providing more access to public water parks and air-conditioned spaces.
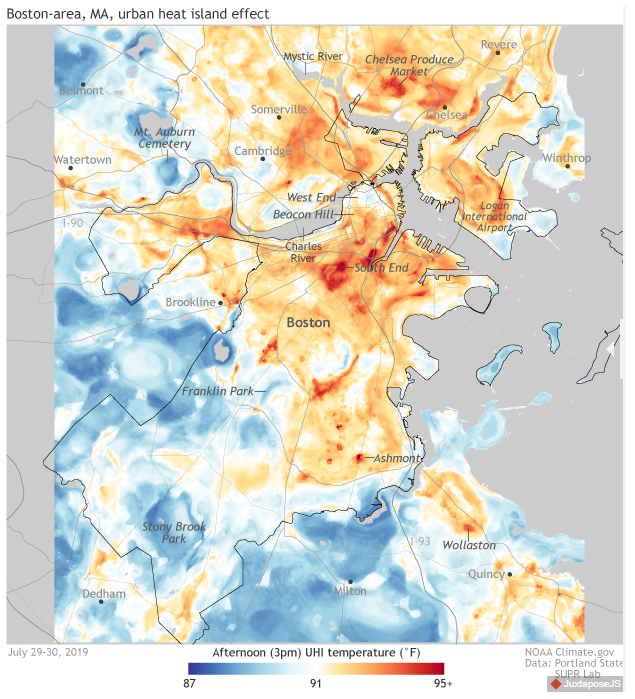 [A temperature map of Boston, Massachusetts from July 29-30, 2019. Temperature data are colored in shades of blue (coolest half of the day's temperature range) to red (warmest half). Credit: NOAA Climate, based on data courtesy of Portland State University.]
Extreme heat kills over 600 Americans per year, but with such strategies these deaths are preventable. One study showed that implementing an urban heat island mitigation measure reduces the annual heat-related death rate by 15%.
Due to COVID-19, this year CAPA and its partners have developed plans to observe physical distancing practices by running these campaigns with no in-person interactions. Safety measures will include shipping sterilized sensing gear and hosting online training sessions with the local campaign teams.
The summer 2020 cities selected were the highest-ranked applicants in a competitive process that considered which communities had the greatest need, most promising partnerships, and the clearest applications for the mapping results. Each campaign will be led by a team of local partners in each city such as city sustainability offices, environmental non-governmental organizations, health departments, and volunteer citizen scientists.
https://youtu.be/p556kx_At98
The mapping campaigns are just the beginning of beneficial outcomes from these efforts. Past campaigns and datasets have seeded workshops on urban heat at museums, new research into urban forestry approaches, and exploration of interventions and potential policy changes within city governments to protect against urban heat stress.
“With climate projections of more intense and more frequent heat waves, the effects of urban heat islands on communities will likely be a growing concern across the country,” said Jones. “These campaigns will provide actionable information for cities to increase their resilience to extreme heat.”
Edited for WeatherNation by Mace Michaels
[A temperature map of Boston, Massachusetts from July 29-30, 2019. Temperature data are colored in shades of blue (coolest half of the day's temperature range) to red (warmest half). Credit: NOAA Climate, based on data courtesy of Portland State University.]
Extreme heat kills over 600 Americans per year, but with such strategies these deaths are preventable. One study showed that implementing an urban heat island mitigation measure reduces the annual heat-related death rate by 15%.
Due to COVID-19, this year CAPA and its partners have developed plans to observe physical distancing practices by running these campaigns with no in-person interactions. Safety measures will include shipping sterilized sensing gear and hosting online training sessions with the local campaign teams.
The summer 2020 cities selected were the highest-ranked applicants in a competitive process that considered which communities had the greatest need, most promising partnerships, and the clearest applications for the mapping results. Each campaign will be led by a team of local partners in each city such as city sustainability offices, environmental non-governmental organizations, health departments, and volunteer citizen scientists.
https://youtu.be/p556kx_At98
The mapping campaigns are just the beginning of beneficial outcomes from these efforts. Past campaigns and datasets have seeded workshops on urban heat at museums, new research into urban forestry approaches, and exploration of interventions and potential policy changes within city governments to protect against urban heat stress.
“With climate projections of more intense and more frequent heat waves, the effects of urban heat islands on communities will likely be a growing concern across the country,” said Jones. “These campaigns will provide actionable information for cities to increase their resilience to extreme heat.”
Edited for WeatherNation by Mace Michaels
[Sara Benson (right) and Roxanne Lee (left), of Boston's Museum of Science, using a CAPA Heat Strategies sensor to investigate the July 20, 2019, extreme heat in Boston, Brookline, and Cambridge, Massachusetts during the 2019 campaign. Credit: Photo courtesy of Boston's Museum of Science.]
“Our mapping campaigns engage residents in the scientific process, while teaching them about the Urban Heat Island effect — the extreme temperature difference between cities and surrounding rural areas — and ways to mitigate risk,” said Hunter Jones, Climate and Health Project Manager with NIHHIS and CPO. “They also produce data sets that are directly useful for managing heat exposure in cities to prevent heat-related suffering and death.”
During one of the hottest days of the year in each of the 13 cities, volunteers will drive prescribed routes in the morning, afternoon, and evening with custom-engineered heat sensors mounted on their own cars. Once per second, the sensors will record temperature and humidity, as well as the exact time and location along the route.
Using the data collected, the CAPA team will produce detailed urban heat maps for the 13 cities that will help city officials and community groups identify specific neighborhoods that are vulnerable to extreme heat. The cities can then determine whether and how to implement strategies like adding trees and green roofs, varying the height of new buildings to increase airflow and create shade canyons, and providing more access to public water parks and air-conditioned spaces.
[A temperature map of Boston, Massachusetts from July 29-30, 2019. Temperature data are colored in shades of blue (coolest half of the day's temperature range) to red (warmest half). Credit: NOAA Climate, based on data courtesy of Portland State University.]
Extreme heat kills over 600 Americans per year, but with such strategies these deaths are preventable. One study showed that implementing an urban heat island mitigation measure reduces the annual heat-related death rate by 15%.
Due to COVID-19, this year CAPA and its partners have developed plans to observe physical distancing practices by running these campaigns with no in-person interactions. Safety measures will include shipping sterilized sensing gear and hosting online training sessions with the local campaign teams.
The summer 2020 cities selected were the highest-ranked applicants in a competitive process that considered which communities had the greatest need, most promising partnerships, and the clearest applications for the mapping results. Each campaign will be led by a team of local partners in each city such as city sustainability offices, environmental non-governmental organizations, health departments, and volunteer citizen scientists.
https://youtu.be/p556kx_At98
The mapping campaigns are just the beginning of beneficial outcomes from these efforts. Past campaigns and datasets have seeded workshops on urban heat at museums, new research into urban forestry approaches, and exploration of interventions and potential policy changes within city governments to protect against urban heat stress.
“With climate projections of more intense and more frequent heat waves, the effects of urban heat islands on communities will likely be a growing concern across the country,” said Jones. “These campaigns will provide actionable information for cities to increase their resilience to extreme heat.”
Edited for WeatherNation by Mace MichaelsAll Weather News
More

Western Heat Continues With Some Relief
A large dome of hot high pressure remains acr
1 Jul 2025 11:00 PM

NHC Monitoring Front in the Southeast Ahead of 4th of July
SOUTHEAST - A frontal boundary moving through
1 Jul 2025 10:35 PM

Severe Storms For the East Coast Through Tuesday
A cold front is tapping into a moist air mass
1 Jul 2025 10:20 PM

Where Rain Could Dampen Holiday Travel Plans
AAA is expecting over 70 million travelers to
1 Jul 2025 4:35 PM

Severe Weather Threat Continues in the Midwest
It has been an active, severe season across t
30 Jun 2025 9:00 PM

Thunderstorms Possible in the Southeast Overnight
SOUTHEAST - Strong thunderstorms have develop
28 Jun 2025 2:40 AM