October La Niña Update: Advisory Continues
Special Stories
14 Oct 2020 2:00 AM
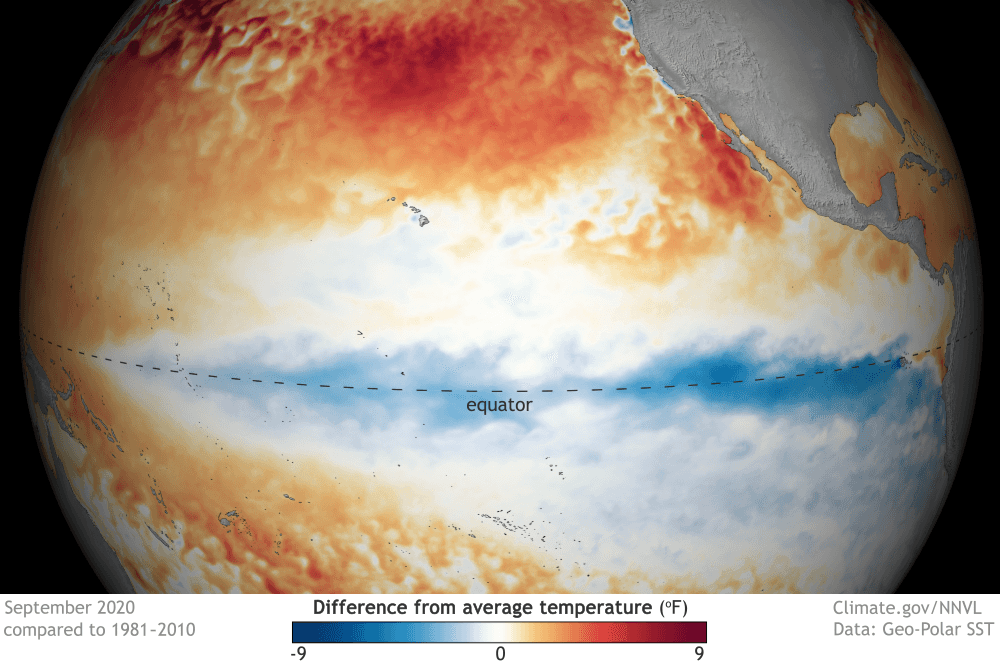
[September 2020 sea surface temperature departure from the 1981-2010 average. Lots of cool water at the equator in the Pacific. Image from Data Snapshots on NOAA Climate]
[From NOAA written by Emily Becker] La Niña’s reign continues in the tropical Pacific, with an approximately 85% chance of lasting through the winter. Forecasters currently think this La Niña will be on the stronger side.
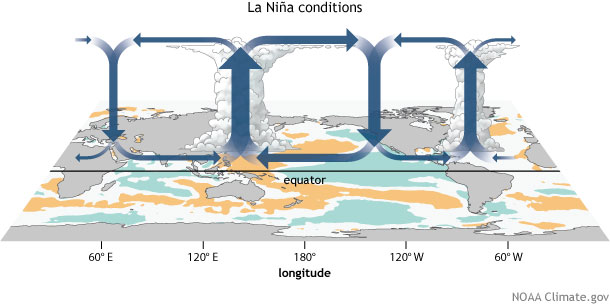 [Generalized Walker Circulation (December-February) anomaly during La Niña events, overlaid on map of average sea surface temperature anomalies. Anomalous ocean cooling (blue-green) in the central and eastern Pacific Ocean and warming over the western Pacific Ocean enhance the rising branch of the Walker circulation over the Maritime Continent and the sinking branch over the eastern Pacific Ocean. Enhanced rising motion is also observed over northern South America, while anomalous sinking motion is found over eastern Africa. NOAA Climate drawing by Fiona Martin.]
Near-surface winds along the tropical Pacific (the trade winds) were stronger than average through the month of September and into early October, as were upper-level winds over the east-central Pacific. The two indexes we use to measure the change in sea-level pressure between the western and eastern Pacific, the Southern Oscillation Index and the Equatorial Southern Oscillation Index were positive, indicating the presence of more rising air (lower surface pressure) over the west and more sinking air (higher surface pressure) over the east—more evidence of an enhanced Walker circulation.
[Generalized Walker Circulation (December-February) anomaly during La Niña events, overlaid on map of average sea surface temperature anomalies. Anomalous ocean cooling (blue-green) in the central and eastern Pacific Ocean and warming over the western Pacific Ocean enhance the rising branch of the Walker circulation over the Maritime Continent and the sinking branch over the eastern Pacific Ocean. Enhanced rising motion is also observed over northern South America, while anomalous sinking motion is found over eastern Africa. NOAA Climate drawing by Fiona Martin.]
Near-surface winds along the tropical Pacific (the trade winds) were stronger than average through the month of September and into early October, as were upper-level winds over the east-central Pacific. The two indexes we use to measure the change in sea-level pressure between the western and eastern Pacific, the Southern Oscillation Index and the Equatorial Southern Oscillation Index were positive, indicating the presence of more rising air (lower surface pressure) over the west and more sinking air (higher surface pressure) over the east—more evidence of an enhanced Walker circulation.
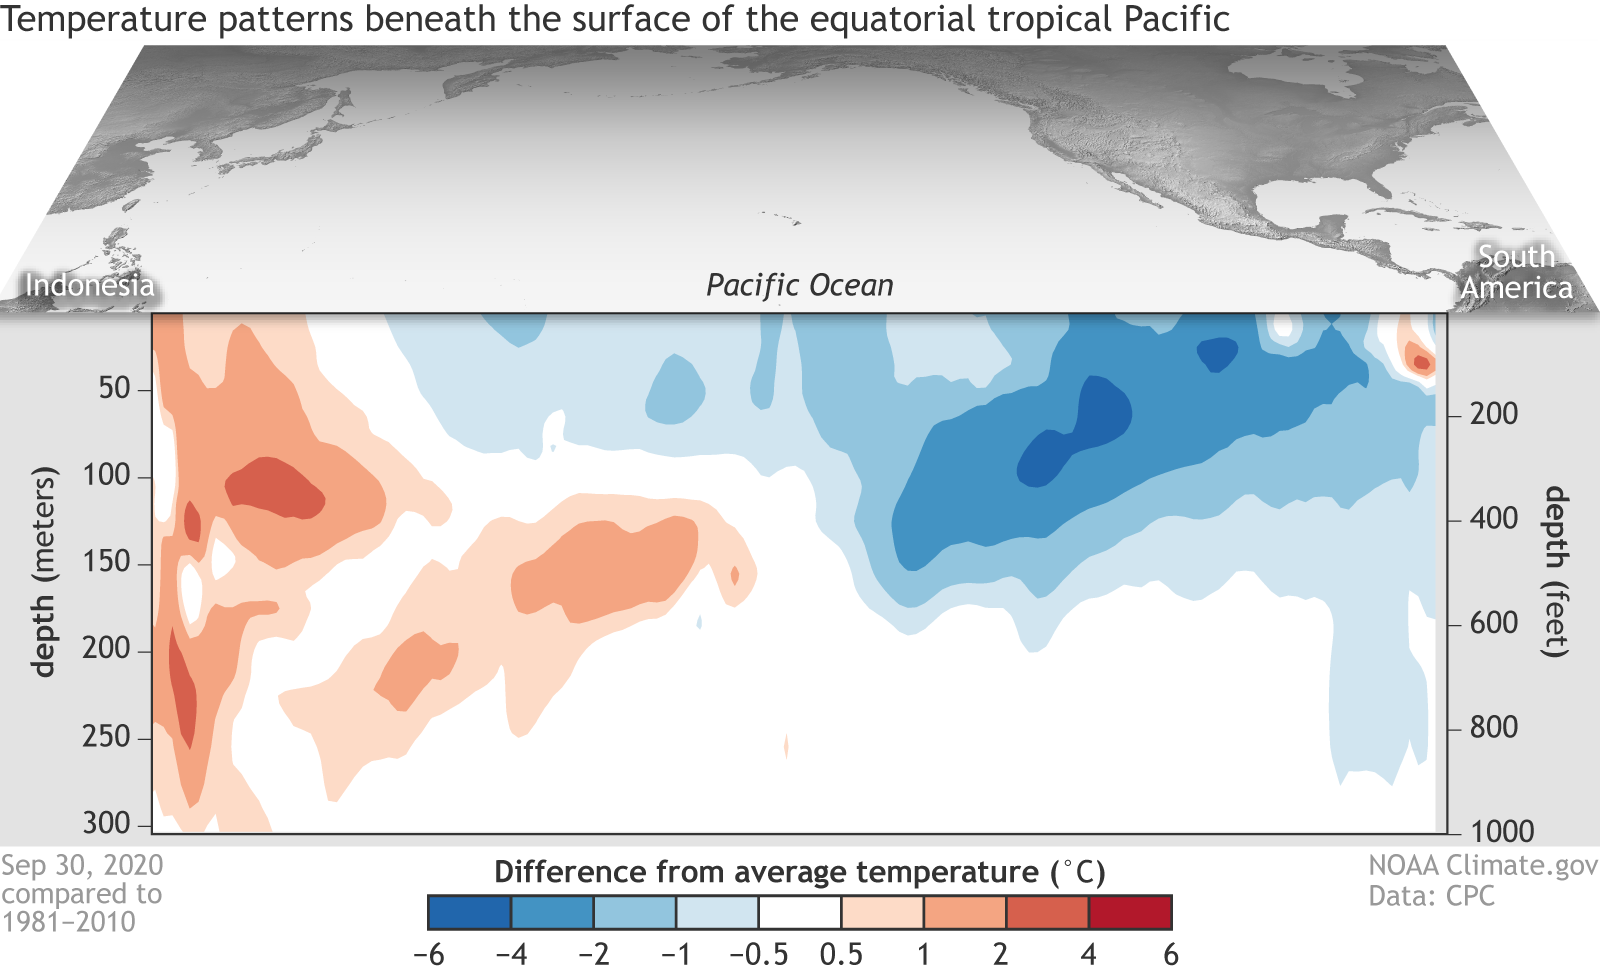 [Difference from average (1981-2010) temperatures in the upper 300 meters (980 feet) of the tropical Pacific Ocean for the 5-day period centered on September 30, 2020. The vertical axis is depth below the surface (meters) and the horizontal axis is longitude, from the western to eastern tropical Pacific. This cross-section is right along the equator. NOAA Climate figure from CPC.]
Several computer models are predicting the Oceanic Niño Index will be, at its peak in November–January, more than 1.0°C cooler than the long-term average. We don’t have specific strength definitions for ENSO, but generally, a deviation of more than 1.0°C (1.8°F) from the long-term mean is considered a moderate-to-strong event. Stronger ENSO events don’t necessarily increase the strength of global weather and climate impacts, but they do increase the likelihood that those impacts will occur.
[Difference from average (1981-2010) temperatures in the upper 300 meters (980 feet) of the tropical Pacific Ocean for the 5-day period centered on September 30, 2020. The vertical axis is depth below the surface (meters) and the horizontal axis is longitude, from the western to eastern tropical Pacific. This cross-section is right along the equator. NOAA Climate figure from CPC.]
Several computer models are predicting the Oceanic Niño Index will be, at its peak in November–January, more than 1.0°C cooler than the long-term average. We don’t have specific strength definitions for ENSO, but generally, a deviation of more than 1.0°C (1.8°F) from the long-term mean is considered a moderate-to-strong event. Stronger ENSO events don’t necessarily increase the strength of global weather and climate impacts, but they do increase the likelihood that those impacts will occur.
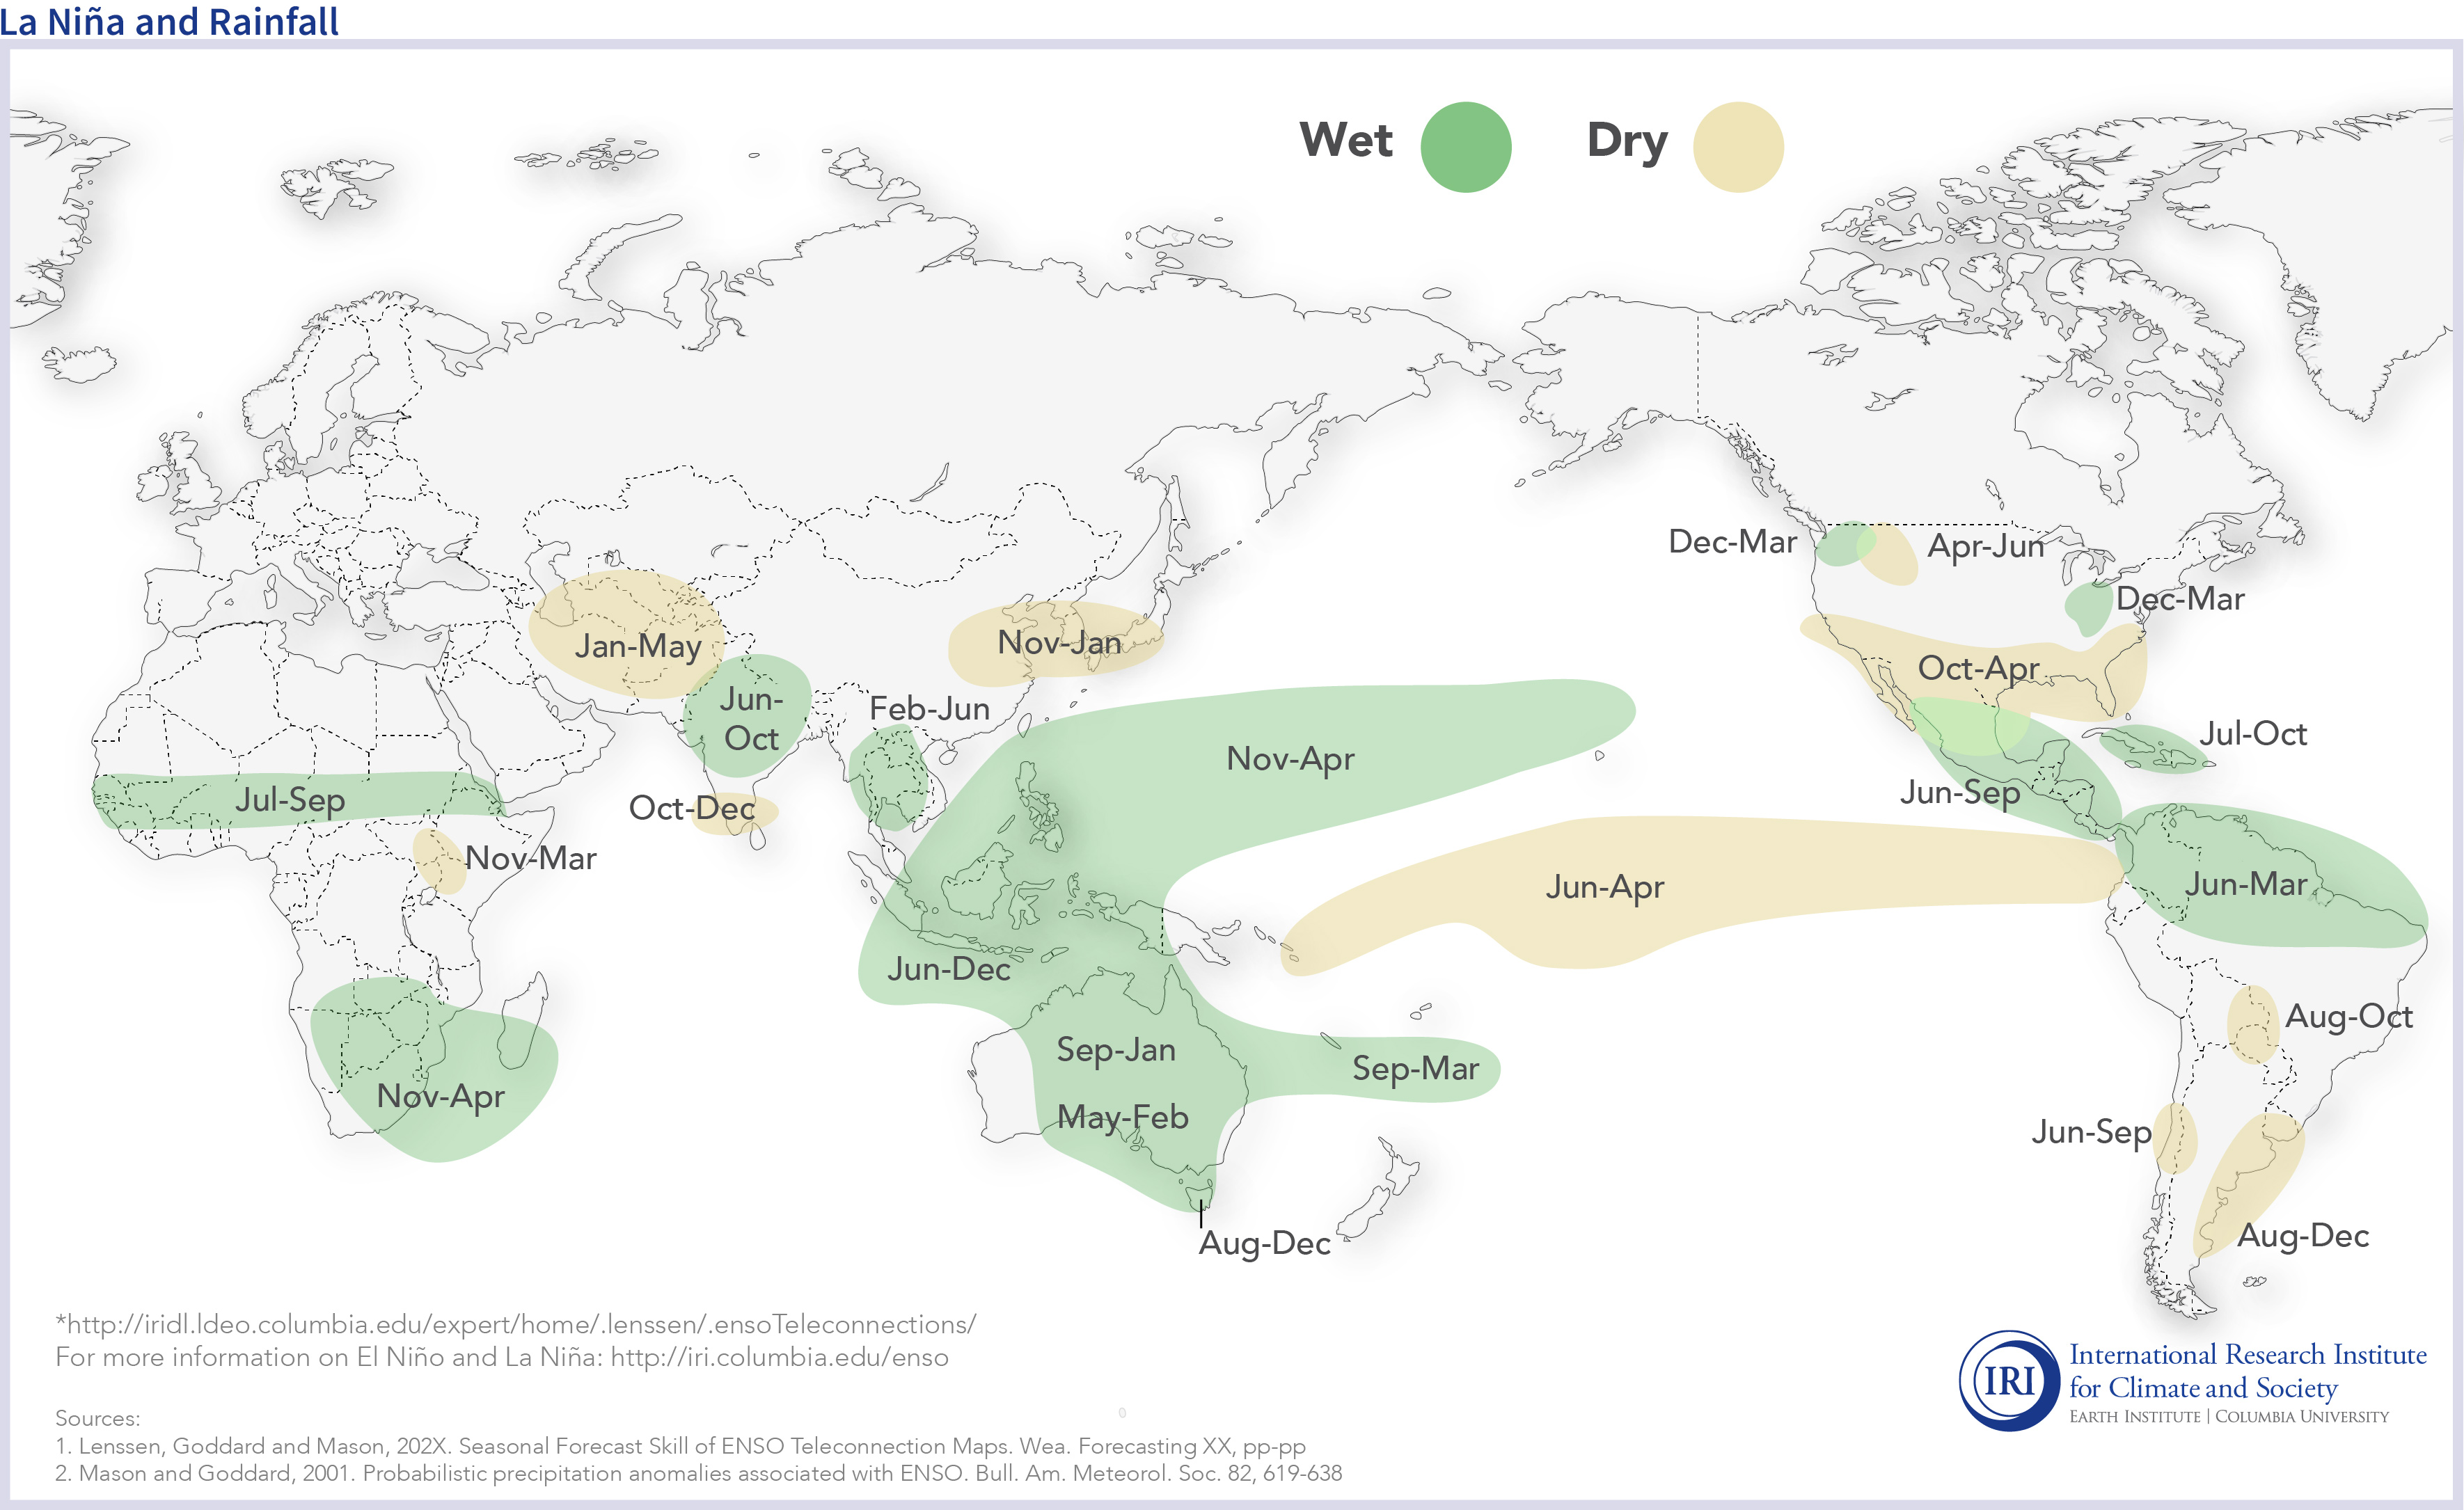 [La Niña conditions in the tropical Pacific are known to shift rainfall patterns in many different parts of the world. The regions and seasons shown on this map indicate typical but not guaranteed impacts of La Niña. For further information, consult the probabilistic information that the map is based on. Image from the International Research Institute for Climate and Society (IRI).]
Nathan’s team assembled this map, which may look familiar to ENSO Blog readers. While maps like these are very important for an overview of La Niña’s impacts, some people may need more information about how often the impacts occurred during past La Niña events. Fortunately, the IRI team has made this information available. You can select the three-month period, El Niño or La Niña, and above/below average precipitation, and the map will show you how often this impact has occurred. For example, 70% of past La Niña winters in Florida were drier than average. Warning—that maproom can be quite a time sink!
Turning impacts maps—either the one shown above, or probabilistic ones like on the IRI site—into an actual forecast can be a complicated process. (The second half of the IRI study assessed the accuracy of a few different forecasts based on ENSO impacts maps.) Official climate outlooks, like those from the Climate Prediction Center, take into consideration ENSO impacts, computer model forecasts, and knowledge of other climate patterns.
Edited for WeatherNation by Mace Michaels
[La Niña conditions in the tropical Pacific are known to shift rainfall patterns in many different parts of the world. The regions and seasons shown on this map indicate typical but not guaranteed impacts of La Niña. For further information, consult the probabilistic information that the map is based on. Image from the International Research Institute for Climate and Society (IRI).]
Nathan’s team assembled this map, which may look familiar to ENSO Blog readers. While maps like these are very important for an overview of La Niña’s impacts, some people may need more information about how often the impacts occurred during past La Niña events. Fortunately, the IRI team has made this information available. You can select the three-month period, El Niño or La Niña, and above/below average precipitation, and the map will show you how often this impact has occurred. For example, 70% of past La Niña winters in Florida were drier than average. Warning—that maproom can be quite a time sink!
Turning impacts maps—either the one shown above, or probabilistic ones like on the IRI site—into an actual forecast can be a complicated process. (The second half of the IRI study assessed the accuracy of a few different forecasts based on ENSO impacts maps.) Official climate outlooks, like those from the Climate Prediction Center, take into consideration ENSO impacts, computer model forecasts, and knowledge of other climate patterns.
Edited for WeatherNation by Mace Michaels
Let’s check in with the tropical Pacific
The temperature of the ocean surface in the Niño3.4 region was about 0.8°C cooler than the 1986–2015 average, according to the ERSSTv5 dataset. We monitor the Niño3.4 index with a few different temperature datasets—more on that here—but they are all comfortably below the La Niña threshold of -0.5°C. The three-month-average Niño3.4 index, called the Oceanic Niño Index (remember this for later!) was -0.6°C. The Oceanic Niño Index is our primary metric for the El Niño/Southern Oscillation, aka ENSO, the whole El Niño/La Niña ocean/atmosphere system. The atmosphere is responding to La Niña’s cooler-than-average ocean surface. A strengthened Walker circulation is what we expect with La Niña conditions, and it’s what we have: air rising vigorously over the very warm western Pacific, traveling eastward high up in the atmosphere, sinking over the cooler central-eastern Pacific, and traveling back westward near the surface.
[Generalized Walker Circulation (December-February) anomaly during La Niña events, overlaid on map of average sea surface temperature anomalies. Anomalous ocean cooling (blue-green) in the central and eastern Pacific Ocean and warming over the western Pacific Ocean enhance the rising branch of the Walker circulation over the Maritime Continent and the sinking branch over the eastern Pacific Ocean. Enhanced rising motion is also observed over northern South America, while anomalous sinking motion is found over eastern Africa. NOAA Climate drawing by Fiona Martin.]
Near-surface winds along the tropical Pacific (the trade winds) were stronger than average through the month of September and into early October, as were upper-level winds over the east-central Pacific. The two indexes we use to measure the change in sea-level pressure between the western and eastern Pacific, the Southern Oscillation Index and the Equatorial Southern Oscillation Index were positive, indicating the presence of more rising air (lower surface pressure) over the west and more sinking air (higher surface pressure) over the east—more evidence of an enhanced Walker circulation.
What’s on deck
Most of the dynamical computer model forecasts predict that La Niña will last through the winter and diminish in the spring. Also, there remains a substantial amount of cooler-than-average water under the surface of the central-eastern Pacific. This will provide a source of cooler water for the surface, giving confidence to the forecast that La Niña will continue.
[Difference from average (1981-2010) temperatures in the upper 300 meters (980 feet) of the tropical Pacific Ocean for the 5-day period centered on September 30, 2020. The vertical axis is depth below the surface (meters) and the horizontal axis is longitude, from the western to eastern tropical Pacific. This cross-section is right along the equator. NOAA Climate figure from CPC.]
Several computer models are predicting the Oceanic Niño Index will be, at its peak in November–January, more than 1.0°C cooler than the long-term average. We don’t have specific strength definitions for ENSO, but generally, a deviation of more than 1.0°C (1.8°F) from the long-term mean is considered a moderate-to-strong event. Stronger ENSO events don’t necessarily increase the strength of global weather and climate impacts, but they do increase the likelihood that those impacts will occur.
Speaking of impacts…
The altered atmospheric circulation of ENSO affects global weather (here’s how that works in general and La Niña in specific). Since ENSO can be predicted months ahead of time, a lot of research has gone into understanding the patterns of ENSO’s global weather impacts. The idea is that if we can predict ENSO, we can get an early picture of what global weather could look like months into the future. A recent study by some of our colleagues at the International Research Institute for Climate and Society (IRI), led by Nathan Lenssen, carefully re-assessed global precipitation (rain, snow, etc.) patterns during ENSO events. They looked at La Niña and El Niño impacts separately, because the impacts are not always opposite. Meaning, although El Niño may be related to a wet winter in one location, La Niña doesn’t necessarily mean a dry winter in that location. Their study included every ENSO event from 1951–2016 where the peak strength, represented by the Oceanic Niño Index, was at least 1.0°C (for El Niño) or -1.0°C (for La Niña). This excludes weak or borderline ENSO events, when the atmospheric changes are not as consistent.
[La Niña conditions in the tropical Pacific are known to shift rainfall patterns in many different parts of the world. The regions and seasons shown on this map indicate typical but not guaranteed impacts of La Niña. For further information, consult the probabilistic information that the map is based on. Image from the International Research Institute for Climate and Society (IRI).]
Nathan’s team assembled this map, which may look familiar to ENSO Blog readers. While maps like these are very important for an overview of La Niña’s impacts, some people may need more information about how often the impacts occurred during past La Niña events. Fortunately, the IRI team has made this information available. You can select the three-month period, El Niño or La Niña, and above/below average precipitation, and the map will show you how often this impact has occurred. For example, 70% of past La Niña winters in Florida were drier than average. Warning—that maproom can be quite a time sink!
Turning impacts maps—either the one shown above, or probabilistic ones like on the IRI site—into an actual forecast can be a complicated process. (The second half of the IRI study assessed the accuracy of a few different forecasts based on ENSO impacts maps.) Official climate outlooks, like those from the Climate Prediction Center, take into consideration ENSO impacts, computer model forecasts, and knowledge of other climate patterns.
Edited for WeatherNation by Mace MichaelsAll Weather News
More
Severe Storms For the East Coast Through Tuesday
A cold front moving through a moist airmass h
2 Jul 2025 1:00 AM


Western Heat Continues With Some Relief
A large dome of hot high pressure remains acr
1 Jul 2025 11:00 PM

NHC Monitoring Front in the Southeast Ahead of 4th of July
SOUTHEAST - A frontal boundary moving through
1 Jul 2025 10:35 PM

Where Rain Could Dampen Holiday Travel Plans
AAA is expecting over 70 million travelers to
1 Jul 2025 4:35 PM

Severe Weather Threat Continues in the Midwest
It has been an active, severe season across t
30 Jun 2025 9:00 PM