Satellites Observe Changes in Nighttime Lights Around New York City
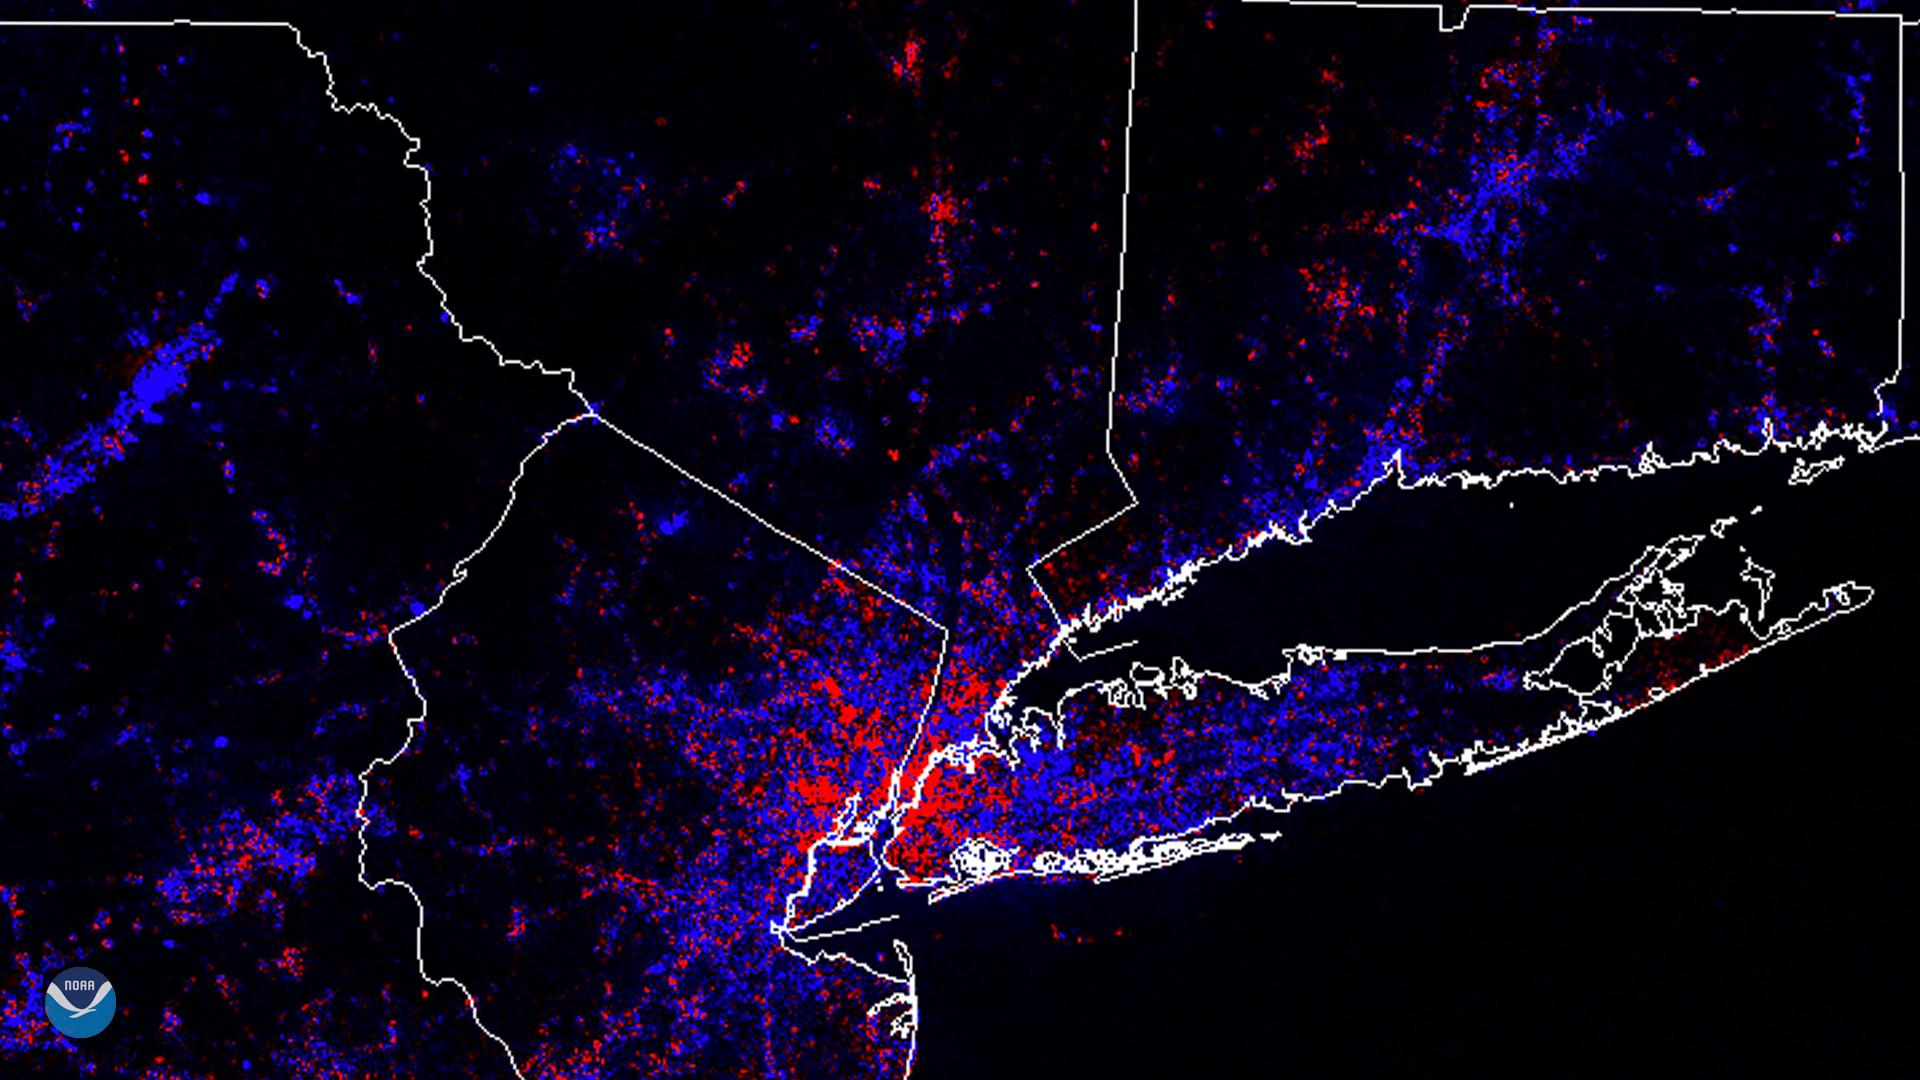
During this time, there was a noticeable decrease in nighttime lights in several locations, including Staten Island, central Long Island, Upstate New York, eastern Pennsylvania, and much of Connecticut. Elsewhere, nighttime illumination increased in some spots, like Manhattan, Brooklyn, northeastern New Jersey, extreme eastern Long Island, and central Massachusetts.
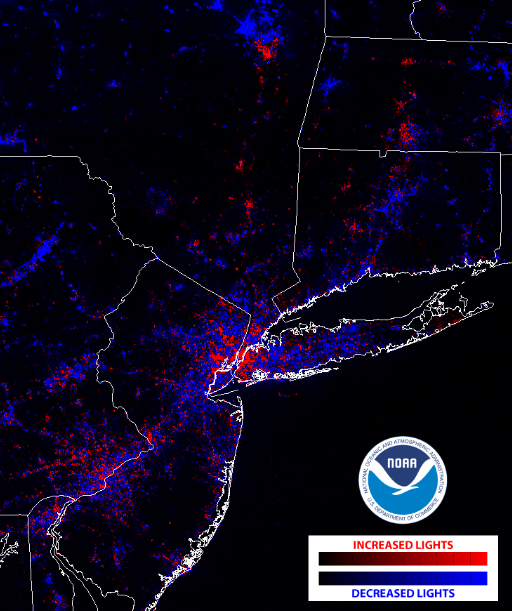
In explaining the slight uptick in illumination on the Hampton shores of Long Island, CIRA Senior Research Scientist Steve Miller speculates that these, “may be cases of people who usually live in NYC in the winter months having relocated to their summertime residences early, due to the slowdown.”
Chris Elvidge, former NOAA scientist and now at CSM, says the DNB has been used in the past to detect dimming of lights and power outages for individual events. “We’ve used it for hurricanes, earthquakes and in conflict zones,” Elvidge explains, “But the worldwide COVID-19 pandemic offers scientists their first opportunity to observe the dimming of lights across entire countries and continents.”
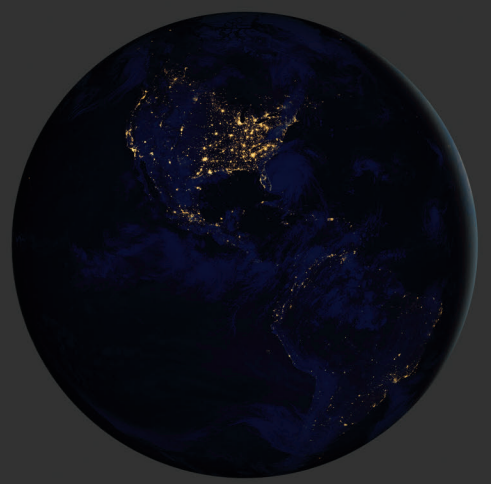 [View of North America lights from 2012]
“There is a story—or perhaps better put, a riddle—behind every DNB light change that we see at this stage of the pandemic,” Miller adds. “It’s tied to human behaviors, economic drivers, and vulnerabilities down to the local scale. From a practical perspective, what we learn from images like these can help inform planners on how best to ready ourselves for potential future pandemics. For example, significant light decreases can point to what businesses have closed during a pandemic, while light increases show areas of still-running critical infrastructure or show where people moved during it.”
The DNB sensor is part of the Visible Infrared Imaging Radiometer Suite (VIIRS), one of the key instruments onboard the Suomi NPP and NOAA-20 polar-orbiting satellites. For this composite image, DNB images were processed to identify and remove pixels containing clouds, aurora, airglow, lightning and other transient sources of light that would obscure the lights of human activity


