Satellites Show Air Quality Improves in California
Special Stories
20 Apr 2020 1:55 AM
[The TROPOspheric Monitoring Instrument (TROPOMI) is the satellite instrument on board the Copernicus Sentinel-5 Precursor satellite. The Sentinel-5 Precursor (S5P) is the first of the atmospheric composition Sentinels, launched on 13 October 2017, planned for a mission of seven years. From tropomi.eu]
[From NASASport written by Dr. Aaron Naeger] Preventative measures recently adopted to prevent further spread of COVID-19 in the U.S. have prompted an overall slowdown in economic activity and fewer vehicles on the roadways. Since combustion engine powered vehicles can represent a major source of nitrogen dioxide (NO2) emissions, less traffic on the roadways may lead to a significant reduction in NO2 concentrations and, as a result, fine particulate matter (Particulate Matter less than 2.5 microns in diameter or PM2.5) as NO2 emissions are a known precursor to PM formation.
The Tropospheric Monitoring Instrument (TROPOMI), launched in 2017 as part of the polar-orbiting European Space Agency’s (ESA) Sentinel-5 precursor (Sentinel-5P) satellite, has advanced our capability to monitor fine-scale emission sources, including vehicular emissions along traffic corridors, with unprecedented spatial resolution of 5.6 x 3.5 km2. Daily midday scans of TROPOMI over the densely populated cities and heavily trafficked corridors in California during March 2020 show how the adoption of stricter COVID-19 measures have impacted air quality in the state. To effectively examine the changes in air quality in California, we constructed weekday averaged NO2 maps for March at 0.05° grid spacing from high-quality, cloud-free retrievals provided by TROPOMI level 2 data. It is also important to note the role of natural weather variability on air pollutants during this seasonal transitional period, as warmer temperatures and higher mid-day solar angles lead to shorter NO2 lifetimes and generally lower NO2 column concentrations.
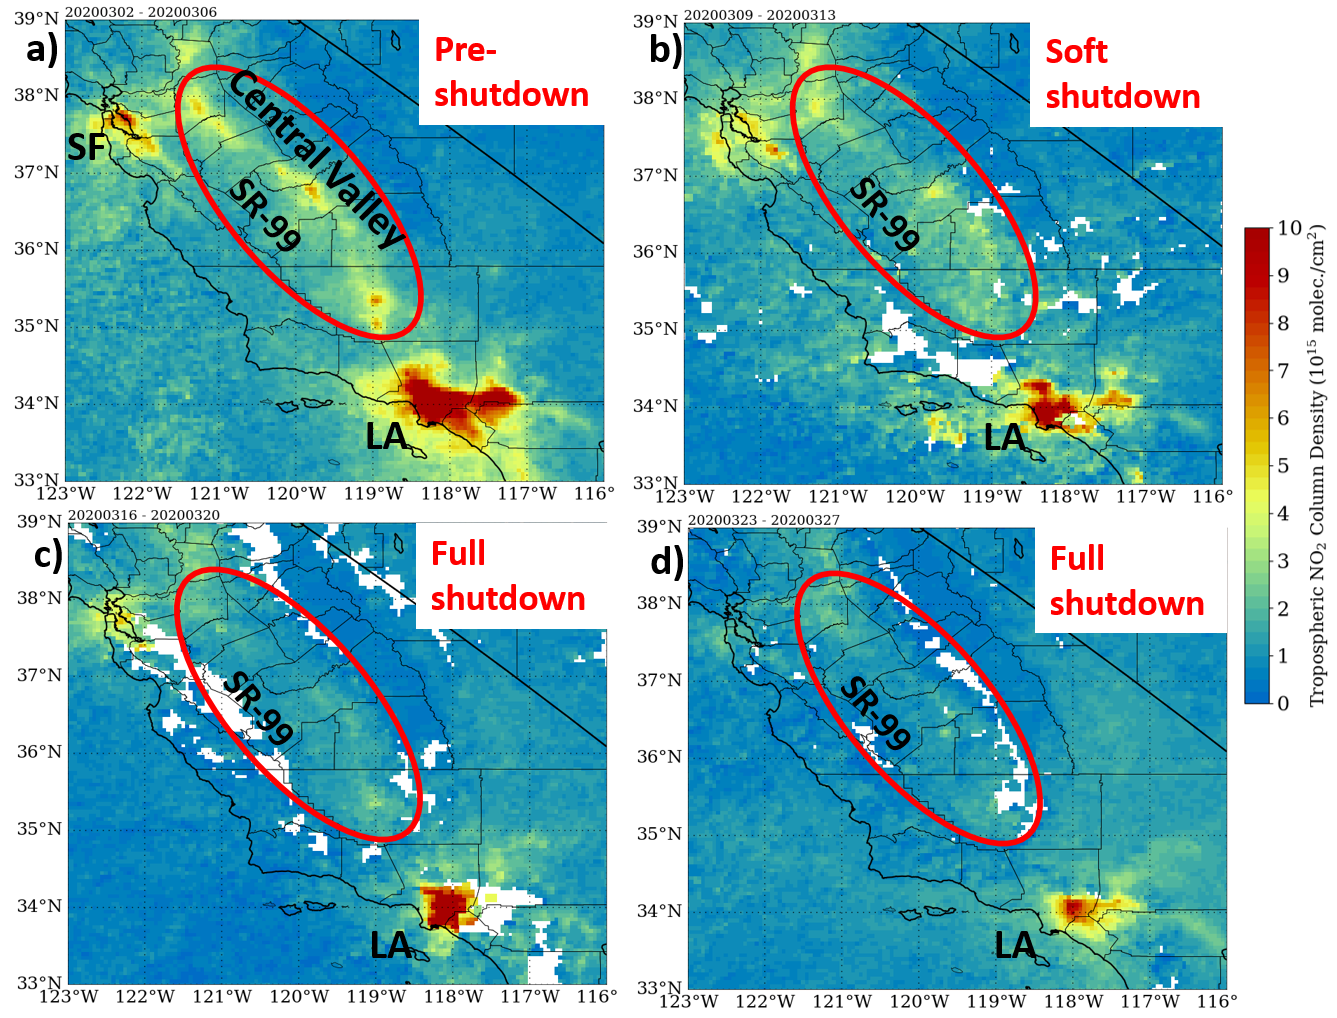 [Figure 1. a) Gridded 0.05 x 0.05° NO2 map from TROPOMI Offline (OFFL) L2 retrievals during 2-6 March 2020 (pre-shutdown) over California. b-d) Same as a), except valid for b) 9-13 March during soft shutdown measures, c) 16-20 March when “shelter in place” orders were announced, d) full period of “shelter in place” orders during 23-27 March. Panel d) generated using near real-time (NRT) product due to 7-10 day lag of OFFL product. From NASASport]
For the first weekday period of March (2-6 March) when COVID-19 measures were yet to be implemented, the largest tropospheric NO2 concentrations were observed in Los Angeles and bordering counties with a less prominent peak in NO2 around San Francisco (Fig. 1a). The TROPOMI scans also resolved areas of enhanced NO2 along the heavily trafficked corridor of State Route 99 (SR-99) in the Central Valley, particularly around the cities of Bakersfield and Fresno. As initial, soft COVID-19 measures were adopted by businesses in California during the second weekday period in March (9-13 March), TROPOMI observed strong reductions in tropospheric column NO2 around the large cities of Los Angeles and San Francisco along with noticeable decreases along SR-99 (Fig. 1b). As California announced statewide “shelter in place” orders during the third weekday period of March (16-20 March), further decreases in NO2 were apparent throughout all populated areas in the state and along SR-99 (Fig. 1c). Noticeable decreases in NO2 continued throughout much of the state during the fourth weekday period of March (23-27 March), especially around San Francisco (Fig. 1d). Overall, these observed reductions in TROPOMI NO2 throughout March are the result of decreased emissions on top of the seasonal changes in meteorological conditions.
[Figure 1. a) Gridded 0.05 x 0.05° NO2 map from TROPOMI Offline (OFFL) L2 retrievals during 2-6 March 2020 (pre-shutdown) over California. b-d) Same as a), except valid for b) 9-13 March during soft shutdown measures, c) 16-20 March when “shelter in place” orders were announced, d) full period of “shelter in place” orders during 23-27 March. Panel d) generated using near real-time (NRT) product due to 7-10 day lag of OFFL product. From NASASport]
For the first weekday period of March (2-6 March) when COVID-19 measures were yet to be implemented, the largest tropospheric NO2 concentrations were observed in Los Angeles and bordering counties with a less prominent peak in NO2 around San Francisco (Fig. 1a). The TROPOMI scans also resolved areas of enhanced NO2 along the heavily trafficked corridor of State Route 99 (SR-99) in the Central Valley, particularly around the cities of Bakersfield and Fresno. As initial, soft COVID-19 measures were adopted by businesses in California during the second weekday period in March (9-13 March), TROPOMI observed strong reductions in tropospheric column NO2 around the large cities of Los Angeles and San Francisco along with noticeable decreases along SR-99 (Fig. 1b). As California announced statewide “shelter in place” orders during the third weekday period of March (16-20 March), further decreases in NO2 were apparent throughout all populated areas in the state and along SR-99 (Fig. 1c). Noticeable decreases in NO2 continued throughout much of the state during the fourth weekday period of March (23-27 March), especially around San Francisco (Fig. 1d). Overall, these observed reductions in TROPOMI NO2 throughout March are the result of decreased emissions on top of the seasonal changes in meteorological conditions.All Weather News
More
East Gears Up for Stormy, Wet Weekend
A low pressure system crashing through the Mi
1 Aug 2026 11:35 AM


Flooding, Severe Storms Target the Midwest Again
After an active week of storms across the nor
1 Aug 2026 1:40 AM

After Reaching Category 5, Genevieve Weakens in the Pacific
PacificFausto is now a post-tropical cyclone.
31 Jul 2026 1:30 AM

Flooding Risk Increases as Heavy Rain Targets the Tri-State Area
Tuesday, heavy rainfall moved across the Nort
30 Jul 2026 12:25 AM

Severe Weather: Energy From the Midwest Now in the Southeast
UPPER MIDWEST - Through Monday, dangerous tor
29 Jul 2026 10:30 PM