The State of Hurricane Forecasting: A Look at Model and NHC Accuracy
Special Stories
25 Apr 2018 8:06 AM
From NOAA by John Cangialosi, Hurricane Specialist, National Hurricane Center
The National Hurricane Center (NHC) has the responsibility for issuing advisories and U.S. watches/warnings for tropical cyclones (TCs), which includes tropical depressions, tropical storms, and hurricanes, for the Atlantic and east Pacific basins. NHC has a long history of issuing advisories for TCs, with the first known recorded forecast being in 1954, when 24-hour predictions of a TC’s track were made. Since then, we’ve expanded our forecasts out in time and added predictions of TC intensity, size, and associated hazards, such as wind, storm surge, and rainfall. In addition, the lead times of tropical storm and hurricane watches and warnings have increased to give the public additional time to prepare for these potentially devastating events.
 [NHC official track errors (in nautical miles) for Atlantic tropical storms and hurricanes by decade.]
If that doesn’t seem impressive, let’s look at another example. The next graphic shows two circles centered on a point near Pensacola, Florida, with the blue one representing the average 48-hour track error in 1990 and the red one showing the average 48-hour error today. What it shows is that if NHC had made a forecast for a storm to be over Pensacola in 48 hours back in 1990, the TC would have ended up, on average, not exactly over Pensacola but somewhere on the blue circle. If NHC makes the same forecast today, now the storm ends up, on average, somewhere on the red circle. You can easily see that the NHC forecasts for the path of a TC today are much more accurate, on average, than they were decades ago, and these more accurate forecasts have helped narrow the warning areas, save lives, and make for more efficient and less costly evacuations.
[NHC official track errors (in nautical miles) for Atlantic tropical storms and hurricanes by decade.]
If that doesn’t seem impressive, let’s look at another example. The next graphic shows two circles centered on a point near Pensacola, Florida, with the blue one representing the average 48-hour track error in 1990 and the red one showing the average 48-hour error today. What it shows is that if NHC had made a forecast for a storm to be over Pensacola in 48 hours back in 1990, the TC would have ended up, on average, not exactly over Pensacola but somewhere on the blue circle. If NHC makes the same forecast today, now the storm ends up, on average, somewhere on the red circle. You can easily see that the NHC forecasts for the path of a TC today are much more accurate, on average, than they were decades ago, and these more accurate forecasts have helped narrow the warning areas, save lives, and make for more efficient and less costly evacuations.
 [A representation of the average NHC 48-hour track errors for the forecast of a storm centered over Pensacola, Florida, in 1990 (blue) and today (red).]
So, you might be wondering why the track forecasts are more accurate today than in the past. Well, the primary reason is the advancements in technology, specifically the improvements in the observing platforms (satellites, for example) and the various modeling systems we use to make forecasts. The amount and quality of data available to the models so they can paint an initial picture of the atmosphere have increased dramatically in the last 20 to 30 years. Also, the resolution and physics in the models we use today are far superior to what forecasters had available in the 1990s or prior decades, in part due to the tremendous improvements in computational capabilities. In addition, NHC has found ways to even beat the individual dynamical models by using a balance of statistical approaches and experience.
We often hear a lot of questions asking which model is the best one. Although some models are usually better than others, no model is perfect, and their performance varies from season to season and from storm to storm. Two of the most well-known models for weather forecasting are the U.S. National Weather Service’s Global Forecast System (GFS) and the European Centre for Medium-Range Weather Forecasts (ECMWF). The figure below shows a comparison of the NHC forecasts (OFCL, black) and forecasts from the GFS (GFSI, blue) and ECMWF (EMXI, red) models for Hurricanes Harvey, Irma, Maria, and Nate in 2017. In all of these cases, except for Hurricane Irma, OFCL performed as well as or better than GFSI and EMXI. Among the two models, EMXI beat GFSI for Harvey, Irma, and Nate, but GFSI beat EMXI for Maria.
[A representation of the average NHC 48-hour track errors for the forecast of a storm centered over Pensacola, Florida, in 1990 (blue) and today (red).]
So, you might be wondering why the track forecasts are more accurate today than in the past. Well, the primary reason is the advancements in technology, specifically the improvements in the observing platforms (satellites, for example) and the various modeling systems we use to make forecasts. The amount and quality of data available to the models so they can paint an initial picture of the atmosphere have increased dramatically in the last 20 to 30 years. Also, the resolution and physics in the models we use today are far superior to what forecasters had available in the 1990s or prior decades, in part due to the tremendous improvements in computational capabilities. In addition, NHC has found ways to even beat the individual dynamical models by using a balance of statistical approaches and experience.
We often hear a lot of questions asking which model is the best one. Although some models are usually better than others, no model is perfect, and their performance varies from season to season and from storm to storm. Two of the most well-known models for weather forecasting are the U.S. National Weather Service’s Global Forecast System (GFS) and the European Centre for Medium-Range Weather Forecasts (ECMWF). The figure below shows a comparison of the NHC forecasts (OFCL, black) and forecasts from the GFS (GFSI, blue) and ECMWF (EMXI, red) models for Hurricanes Harvey, Irma, Maria, and Nate in 2017. In all of these cases, except for Hurricane Irma, OFCL performed as well as or better than GFSI and EMXI. Among the two models, EMXI beat GFSI for Harvey, Irma, and Nate, but GFSI beat EMXI for Maria.
 [72-hour track errors from the NHC official forecast (black), the Global Forecast System model (GFSI, blue), and the European Centre for Medium-Range Weather Forecasting model (EMXI, red) for Hurricanes Harvey, Irma, Maria, and Nate.]
Over the past decade, the average track errors of GFSI and EMXI models have been quite close, so even though EMXI was the best-performing model most of the time in 2017, it does not mean that it will always be the best for every storm. The models that typically have the lowest errors are consensus aids, which blend several models together. Forecasters construct their own forecasts of how the storm will evolve, aided by model simulations and their knowledge of model strengthens and weaknesses.
Even though our track forecasts are much more accurate today – in fact preliminary estimates are that the 2017 Atlantic track forecasts set record low errors at all time periods – typical track errors currently start off at 37 n mi at 24 hours and then increase by about 35 n mi (40 mi ) per day of the forecast. This means that our 5-day track error is on average around 180 n mi (210 mi). So, keep that in mind and be sure to account for forecast uncertainty when using NHC forecasts next hurricane season.
[72-hour track errors from the NHC official forecast (black), the Global Forecast System model (GFSI, blue), and the European Centre for Medium-Range Weather Forecasting model (EMXI, red) for Hurricanes Harvey, Irma, Maria, and Nate.]
Over the past decade, the average track errors of GFSI and EMXI models have been quite close, so even though EMXI was the best-performing model most of the time in 2017, it does not mean that it will always be the best for every storm. The models that typically have the lowest errors are consensus aids, which blend several models together. Forecasters construct their own forecasts of how the storm will evolve, aided by model simulations and their knowledge of model strengthens and weaknesses.
Even though our track forecasts are much more accurate today – in fact preliminary estimates are that the 2017 Atlantic track forecasts set record low errors at all time periods – typical track errors currently start off at 37 n mi at 24 hours and then increase by about 35 n mi (40 mi ) per day of the forecast. This means that our 5-day track error is on average around 180 n mi (210 mi). So, keep that in mind and be sure to account for forecast uncertainty when using NHC forecasts next hurricane season.
 [National Weather Service WSR-88D Doppler radar from San Juan, Puerto Rico, at 5:15 pm EDT September 6, 2017, showing the double eyewall structure of Hurricane Irma, before the occurrence of an eyewall replacement.]
Given these complex factors and the fact that errors in the track can also affect the TC’s future intensity, we have not made as much progress in this area as we have for track forecasting. The next graphic (below) shows NHC average intensity errors for Atlantic tropical storms and hurricanes by decade starting in the 1970s. Note that only small improvements were made in the intensity predictions from the 1970s through the 2000s. A much more significant reduction in error has occurred in the current decade, which could mean that the recent investment in new models and techniques is beginning to pay off. Today’s intensity errors are close to 15 kt (17 mph) from 72 to 120 h. This number is on the order of one Saffir-Simpson category, so we often encourage those who could be affected by a TC to prepare for a storm one category stronger (on the Saffir-Simpson Hurricane Wind Scale) than what we are forecasting.
[National Weather Service WSR-88D Doppler radar from San Juan, Puerto Rico, at 5:15 pm EDT September 6, 2017, showing the double eyewall structure of Hurricane Irma, before the occurrence of an eyewall replacement.]
Given these complex factors and the fact that errors in the track can also affect the TC’s future intensity, we have not made as much progress in this area as we have for track forecasting. The next graphic (below) shows NHC average intensity errors for Atlantic tropical storms and hurricanes by decade starting in the 1970s. Note that only small improvements were made in the intensity predictions from the 1970s through the 2000s. A much more significant reduction in error has occurred in the current decade, which could mean that the recent investment in new models and techniques is beginning to pay off. Today’s intensity errors are close to 15 kt (17 mph) from 72 to 120 h. This number is on the order of one Saffir-Simpson category, so we often encourage those who could be affected by a TC to prepare for a storm one category stronger (on the Saffir-Simpson Hurricane Wind Scale) than what we are forecasting.
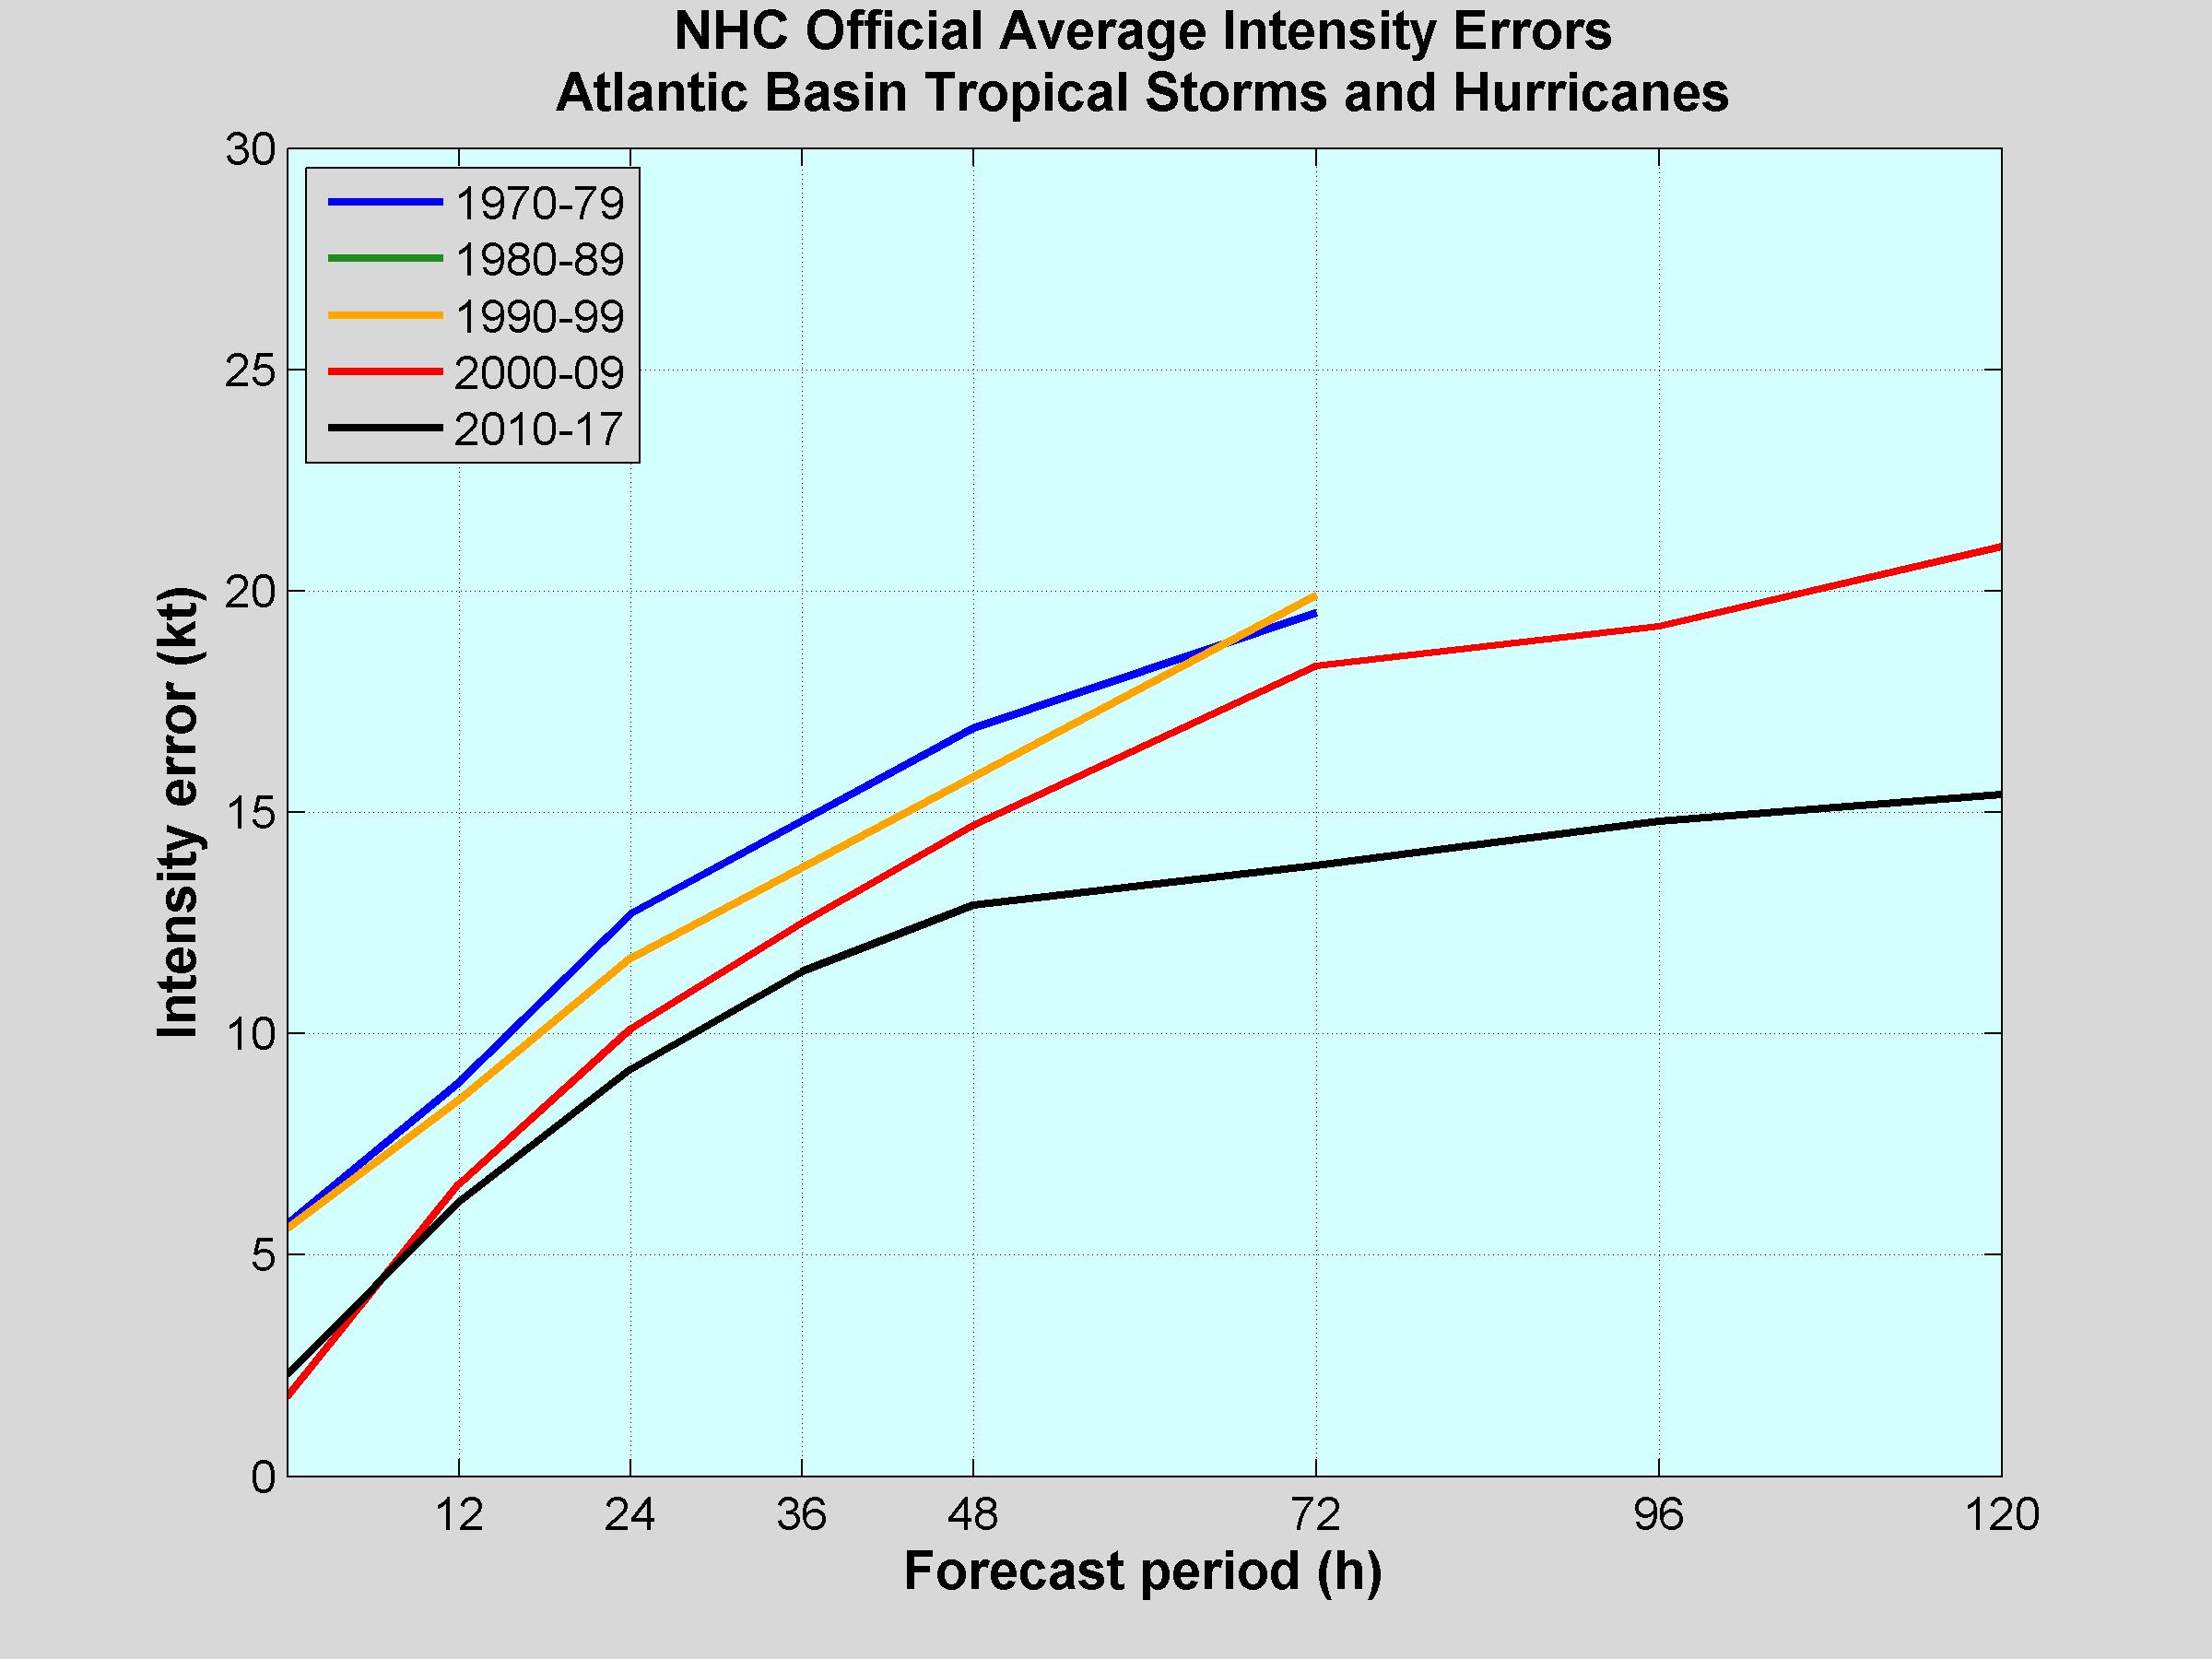 [NHC official intensity errors (in knots) for Atlantic tropical storms and hurricanes by decade.]
Although the GFS and ECMWF models are skillful for track forecasting and help us understand the environment around the TC, did you know that these models are typically inadequate to predict how strong a TC might become? Both the GFS and ECMWF are global models, and they cannot “see” sufficient detail within the storm to represent and predict the core winds in the hurricane’s eyewall. Therefore, we use different models to predict intensity, some that are run at high resolution specifically for TCs (e.g., Hurricane Weather Research and Forecasting [HWRF] model, Hurricanes in a Multi-scale Ocean-coupled Non-hydrostatic [HMON] model) and some that are statistical in nature (e.g., Statistical Hurricane Intensity Prediction Scheme [SHIPS], Logistic Growth Equation Model [LGEM]). The statistical models tell the forecaster what typically occurs for a TC in a specific location and environment based on past storm behavior. Even though the intensity models are improving, the gains in these models are much smaller than what has occurred in the models we use for track forecasting.
[NHC official intensity errors (in knots) for Atlantic tropical storms and hurricanes by decade.]
Although the GFS and ECMWF models are skillful for track forecasting and help us understand the environment around the TC, did you know that these models are typically inadequate to predict how strong a TC might become? Both the GFS and ECMWF are global models, and they cannot “see” sufficient detail within the storm to represent and predict the core winds in the hurricane’s eyewall. Therefore, we use different models to predict intensity, some that are run at high resolution specifically for TCs (e.g., Hurricane Weather Research and Forecasting [HWRF] model, Hurricanes in a Multi-scale Ocean-coupled Non-hydrostatic [HMON] model) and some that are statistical in nature (e.g., Statistical Hurricane Intensity Prediction Scheme [SHIPS], Logistic Growth Equation Model [LGEM]). The statistical models tell the forecaster what typically occurs for a TC in a specific location and environment based on past storm behavior. Even though the intensity models are improving, the gains in these models are much smaller than what has occurred in the models we use for track forecasting.
Track Forecasting (a.k.a., Where the Storm Will Go)
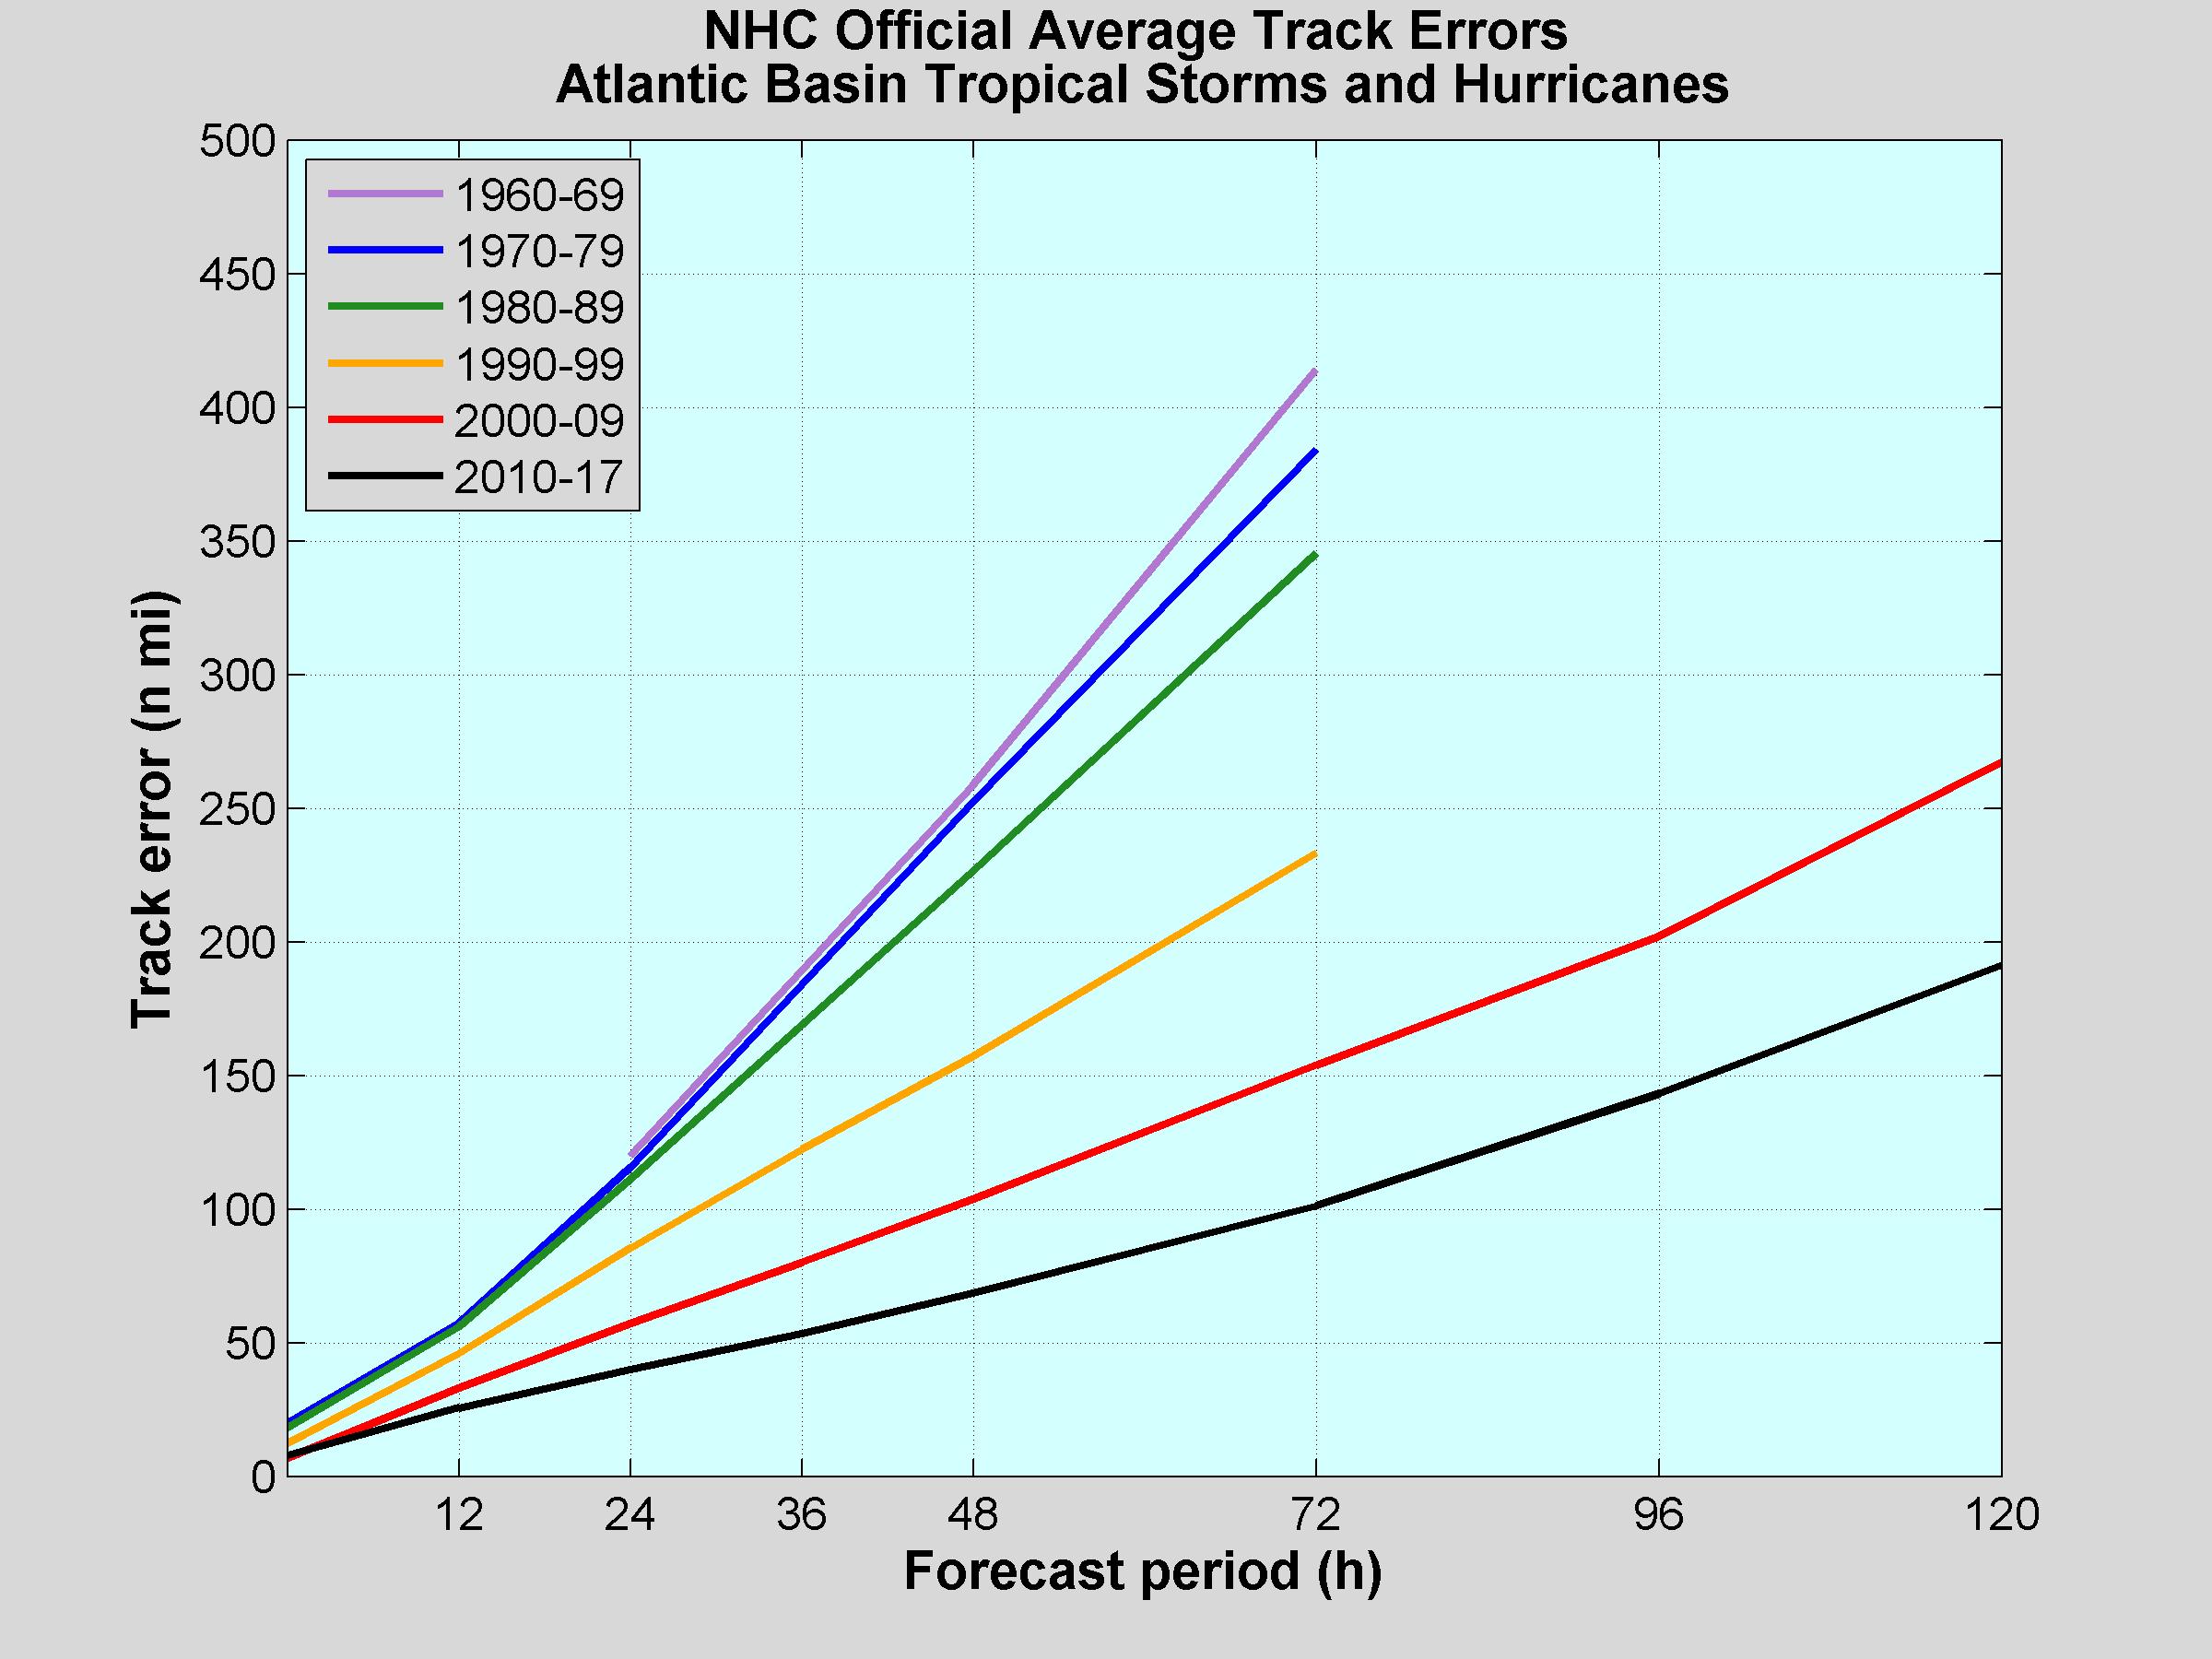
We are usually more confident in predicting the path of TCs as compared to predicting the strength or size of a TC. The primary reason for this is because the track of a TC is governed by forces larger than the tropical system itself, since the surrounding steering currents cover a much larger area than the hurricane. Because these nearby weather patterns are big, we can usually “see” them easily, and the global weather models do a fairly good job in predicting how these steering features might evolve over the course of a few days. The figure below shows the average NHC track forecast errors for tropical storms and hurricanes by decade beginning in the 1960s. You can see that there has been a steady reduction in the track errors over time, with the average errors in the current decade about 30-40% smaller than they were in the 2000s and about half of the size (or even smaller) than they were in the 1990s.
[NHC official track errors (in nautical miles) for Atlantic tropical storms and hurricanes by decade.]
If that doesn’t seem impressive, let’s look at another example. The next graphic shows two circles centered on a point near Pensacola, Florida, with the blue one representing the average 48-hour track error in 1990 and the red one showing the average 48-hour error today. What it shows is that if NHC had made a forecast for a storm to be over Pensacola in 48 hours back in 1990, the TC would have ended up, on average, not exactly over Pensacola but somewhere on the blue circle. If NHC makes the same forecast today, now the storm ends up, on average, somewhere on the red circle. You can easily see that the NHC forecasts for the path of a TC today are much more accurate, on average, than they were decades ago, and these more accurate forecasts have helped narrow the warning areas, save lives, and make for more efficient and less costly evacuations.
[A representation of the average NHC 48-hour track errors for the forecast of a storm centered over Pensacola, Florida, in 1990 (blue) and today (red).]
So, you might be wondering why the track forecasts are more accurate today than in the past. Well, the primary reason is the advancements in technology, specifically the improvements in the observing platforms (satellites, for example) and the various modeling systems we use to make forecasts. The amount and quality of data available to the models so they can paint an initial picture of the atmosphere have increased dramatically in the last 20 to 30 years. Also, the resolution and physics in the models we use today are far superior to what forecasters had available in the 1990s or prior decades, in part due to the tremendous improvements in computational capabilities. In addition, NHC has found ways to even beat the individual dynamical models by using a balance of statistical approaches and experience.
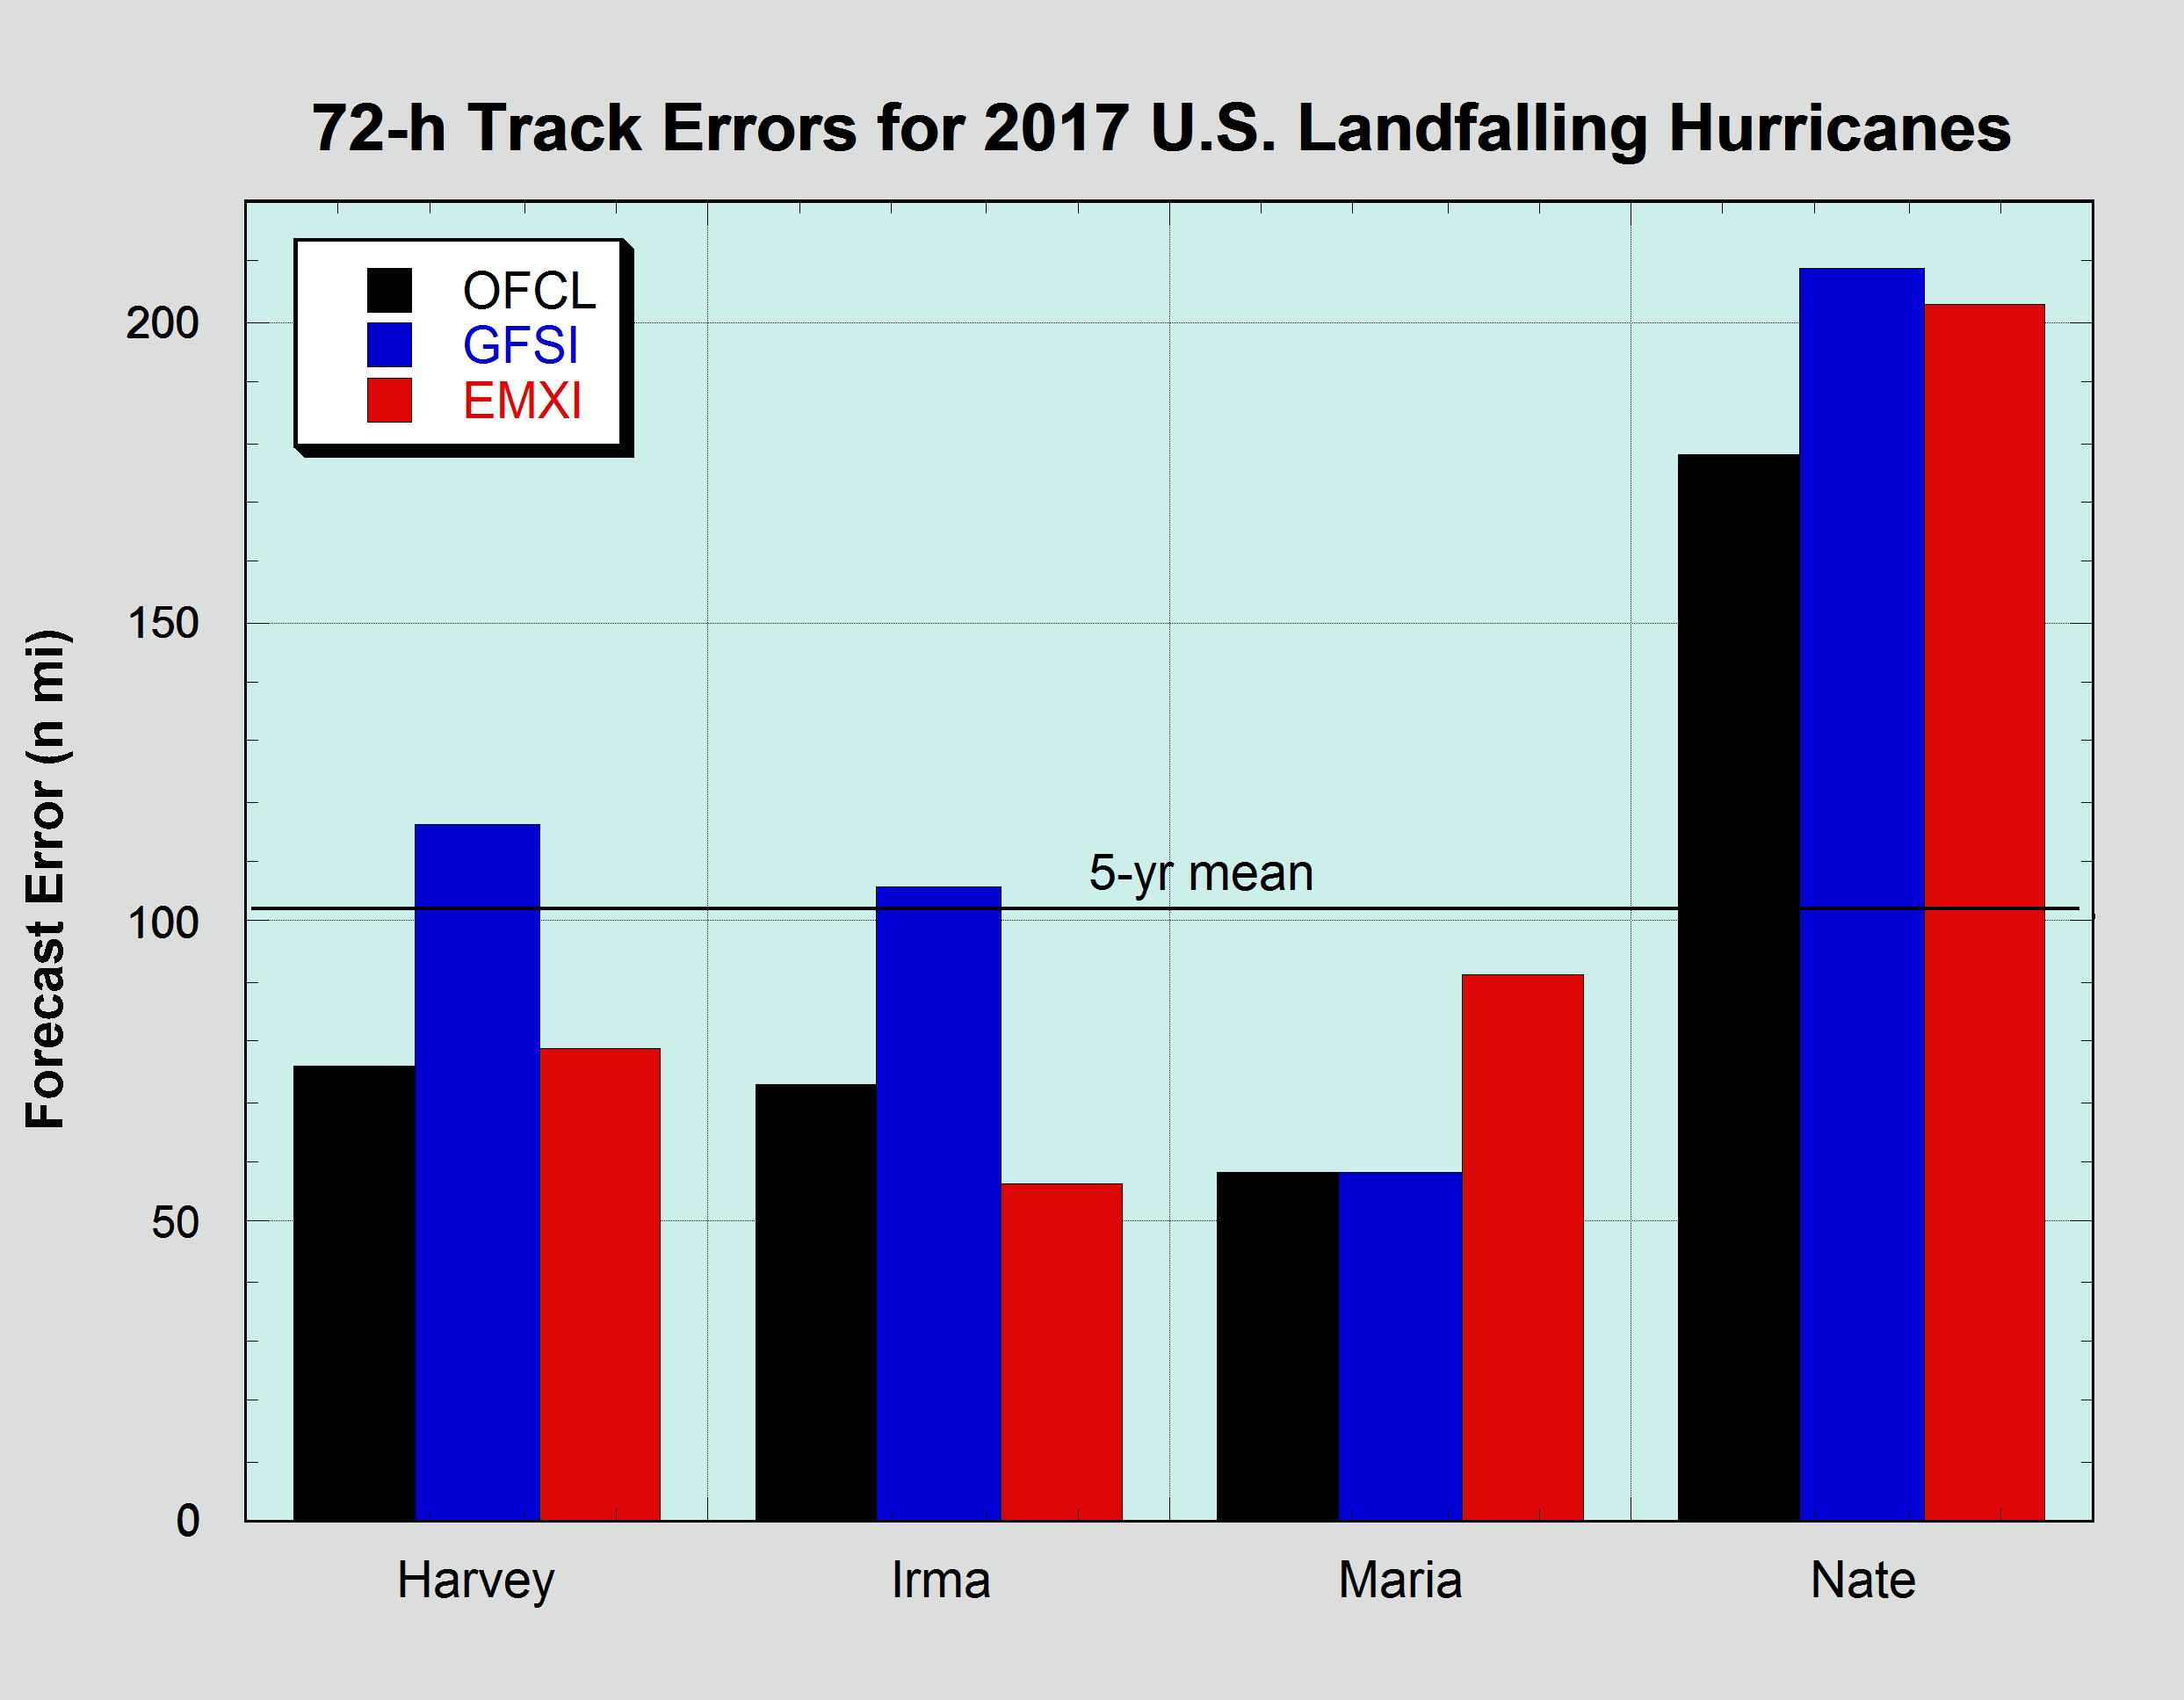
We often hear a lot of questions asking which model is the best one. Although some models are usually better than others, no model is perfect, and their performance varies from season to season and from storm to storm. Two of the most well-known models for weather forecasting are the U.S. National Weather Service’s Global Forecast System (GFS) and the European Centre for Medium-Range Weather Forecasts (ECMWF). The figure below shows a comparison of the NHC forecasts (OFCL, black) and forecasts from the GFS (GFSI, blue) and ECMWF (EMXI, red) models for Hurricanes Harvey, Irma, Maria, and Nate in 2017. In all of these cases, except for Hurricane Irma, OFCL performed as well as or better than GFSI and EMXI. Among the two models, EMXI beat GFSI for Harvey, Irma, and Nate, but GFSI beat EMXI for Maria.
[72-hour track errors from the NHC official forecast (black), the Global Forecast System model (GFSI, blue), and the European Centre for Medium-Range Weather Forecasting model (EMXI, red) for Hurricanes Harvey, Irma, Maria, and Nate.]
Over the past decade, the average track errors of GFSI and EMXI models have been quite close, so even though EMXI was the best-performing model most of the time in 2017, it does not mean that it will always be the best for every storm. The models that typically have the lowest errors are consensus aids, which blend several models together. Forecasters construct their own forecasts of how the storm will evolve, aided by model simulations and their knowledge of model strengthens and weaknesses.
Even though our track forecasts are much more accurate today – in fact preliminary estimates are that the 2017 Atlantic track forecasts set record low errors at all time periods – typical track errors currently start off at 37 n mi at 24 hours and then increase by about 35 n mi (40 mi ) per day of the forecast. This means that our 5-day track error is on average around 180 n mi (210 mi). So, keep that in mind and be sure to account for forecast uncertainty when using NHC forecasts next hurricane season.
Intensity Forecasting (a.k.a., How Strong the Storm Will Get)
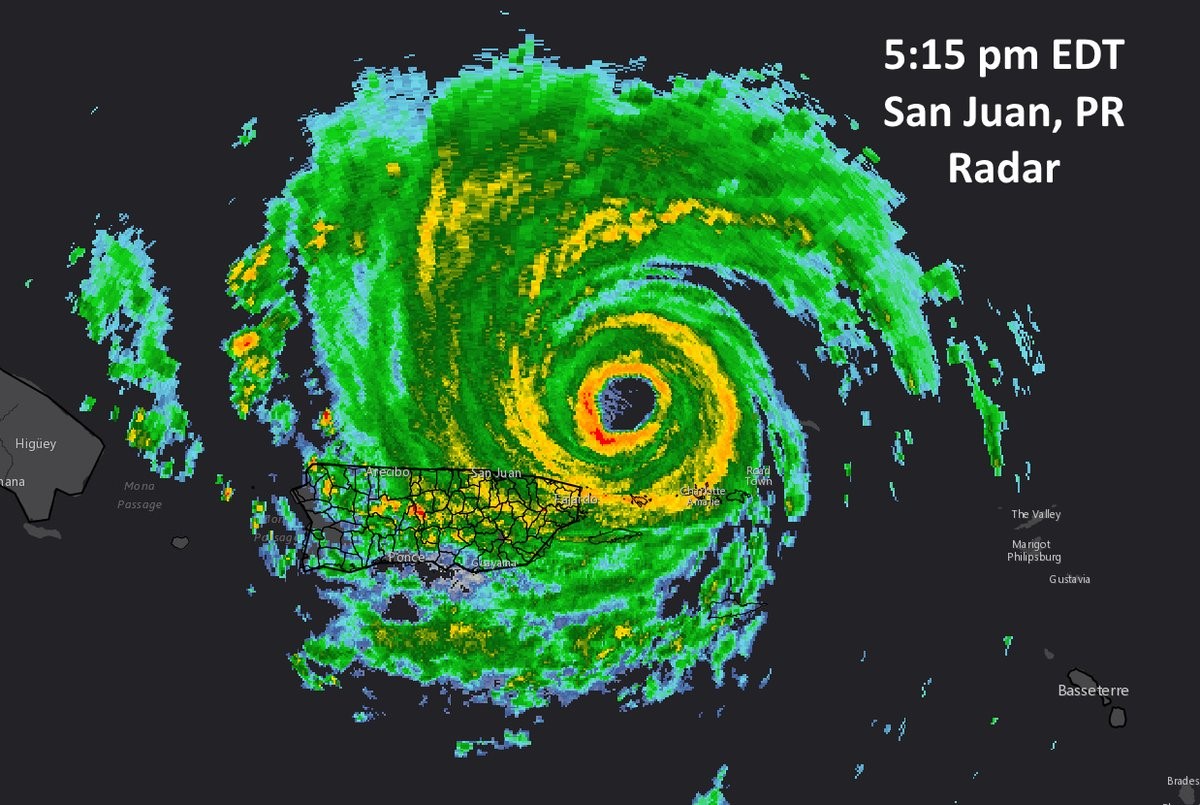
Predicting the intensity of a tropical storm or hurricane is usually more challenging than forecasting its track. This is because the intensity of these weather systems is affected by factors that are both big and small. On the large scale, vertical wind shear (the change of wind speed and direction with height) and the amount of moisture in the atmosphere greatly affect the amount or organization of the thunderstorm activity that the TC can produce. Ocean temperatures also affect the system’s intensity, with temperatures below 80° F usually being too cool to sustain significant thunderstorm activity. However, smaller-scale features can also be at play. One of the more complex phenomena that affects a TC’s intensity is an eyewall replacement cycle. Initially, when two eyewalls, one inside the other, are present, the hurricane’s wind field will begin to expand, and as the inner eyewall dies, the hurricane’s peak winds start to weaken. However, if the second eyewall contracts, the hurricane can often re-intensify. The radar image below of Hurricane Irma (2017) was taken at the beginning of an eyewall replacement cycle, when the hurricane had a double eyewall structure.
[National Weather Service WSR-88D Doppler radar from San Juan, Puerto Rico, at 5:15 pm EDT September 6, 2017, showing the double eyewall structure of Hurricane Irma, before the occurrence of an eyewall replacement.]
Given these complex factors and the fact that errors in the track can also affect the TC’s future intensity, we have not made as much progress in this area as we have for track forecasting. The next graphic (below) shows NHC average intensity errors for Atlantic tropical storms and hurricanes by decade starting in the 1970s. Note that only small improvements were made in the intensity predictions from the 1970s through the 2000s. A much more significant reduction in error has occurred in the current decade, which could mean that the recent investment in new models and techniques is beginning to pay off. Today’s intensity errors are close to 15 kt (17 mph) from 72 to 120 h. This number is on the order of one Saffir-Simpson category, so we often encourage those who could be affected by a TC to prepare for a storm one category stronger (on the Saffir-Simpson Hurricane Wind Scale) than what we are forecasting.
[NHC official intensity errors (in knots) for Atlantic tropical storms and hurricanes by decade.]
Although the GFS and ECMWF models are skillful for track forecasting and help us understand the environment around the TC, did you know that these models are typically inadequate to predict how strong a TC might become? Both the GFS and ECMWF are global models, and they cannot “see” sufficient detail within the storm to represent and predict the core winds in the hurricane’s eyewall. Therefore, we use different models to predict intensity, some that are run at high resolution specifically for TCs (e.g., Hurricane Weather Research and Forecasting [HWRF] model, Hurricanes in a Multi-scale Ocean-coupled Non-hydrostatic [HMON] model) and some that are statistical in nature (e.g., Statistical Hurricane Intensity Prediction Scheme [SHIPS], Logistic Growth Equation Model [LGEM]). The statistical models tell the forecaster what typically occurs for a TC in a specific location and environment based on past storm behavior. Even though the intensity models are improving, the gains in these models are much smaller than what has occurred in the models we use for track forecasting.
Will the errors keep decreasing?
The short answer is they likely won’t forever. At some point the forecasts made by NHC and other forecasting centers will likely reach the limits of predictability. No one knows for sure what those limits are or when they will be reached, but researchers are still providing great information that is helping NHC make steady advancements as discussed above. If you want more information on the models, please visit the following page for details: http://www.nhc.noaa.gov/modelsummary.shtml and for more information on the NHC and model verification please visit the following page: http://www.nhc.noaa.gov/verification/ Edited for WeatherNation by Meteorologist Mace MichaelsAll Weather News
More
Severe Storms For the East Coast Through Tuesday
Frontal systems have been crossing the northe
30 Jun 2025 9:00 PM

Severe Weather Threat Continues in the Midwest
It has been an active, severe season across t
30 Jun 2025 9:00 PM


Hurricane Center Monitoring Florida for Tropical Development
Residents and visitors to the Southeast will
30 Jun 2025 3:05 PM

Where Rain Could Dampen Holiday Travel Plans
AAA is expecting over 70 million travelers to
30 Jun 2025 3:00 PM

Barry Makes Landfall, Watching Flossie Next
While the Eastern Pacific has made most of th
30 Jun 2025 10:50 AM

Thunderstorms Possible in the Southeast Overnight
SOUTHEAST - Strong thunderstorms have develop
28 Jun 2025 2:40 AM