Twenty Years of Drought Examined
Special Stories
30 May 2022 5:25 AM
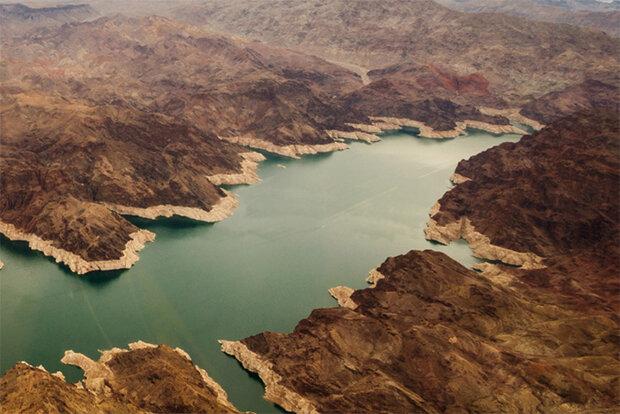
[This aerial view of Lake Mead shows declining water levels. Credit: NOAA Drought Task Force]
[Written by NOAA NCEI] If you live in the United States, you’ve probably experienced some type of drought over the past two decades. Drought impacts look different in different areas of the country and can range from water shortages and restrictions to crop damage and other major agricultural losses. The weekly U.S. Drought Monitor (USDM) takes into account numerous meteorological and hydrological observations, environmental indices, impacts, and knowledge from local experts then rates the severity of drought across the United States including Puerto Rico and the U.S. and Affiliated Pacific Islands.
It is vital for scientists to understand changes in drought over time, especially in the context of climate change. A lack of standardized drought categories and descriptions has been the biggest barrier to this task, which is where the USDM comes in. It categorizes drought severity, beginning with Abnormally Dry (DO) and escalates up to Exceptional Drought (D4). Besides being used to characterize weekly drought status since it was created in 1999, scientists from NCEI, the Cooperative Institute for Satellite Earth System Studies (CISESS), and the National Drought Mitigation Center (NDMC) have now used it in a new study that categorizes the last two decades of drought in the U.S.
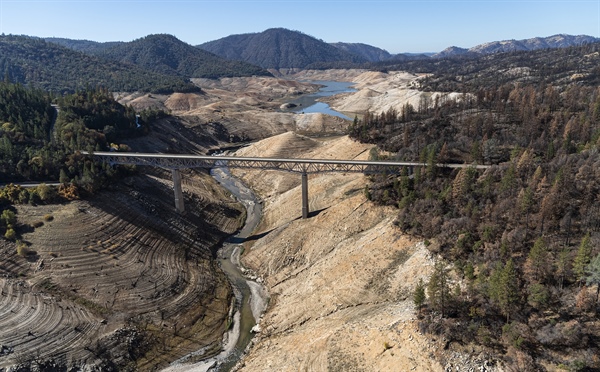 [A visibly low water level is present in this aerial view of Enterprise Bridge in Butte County. Photo taken 28 October, 2021. Andrew Innerarity/California Department of Water Resources.]
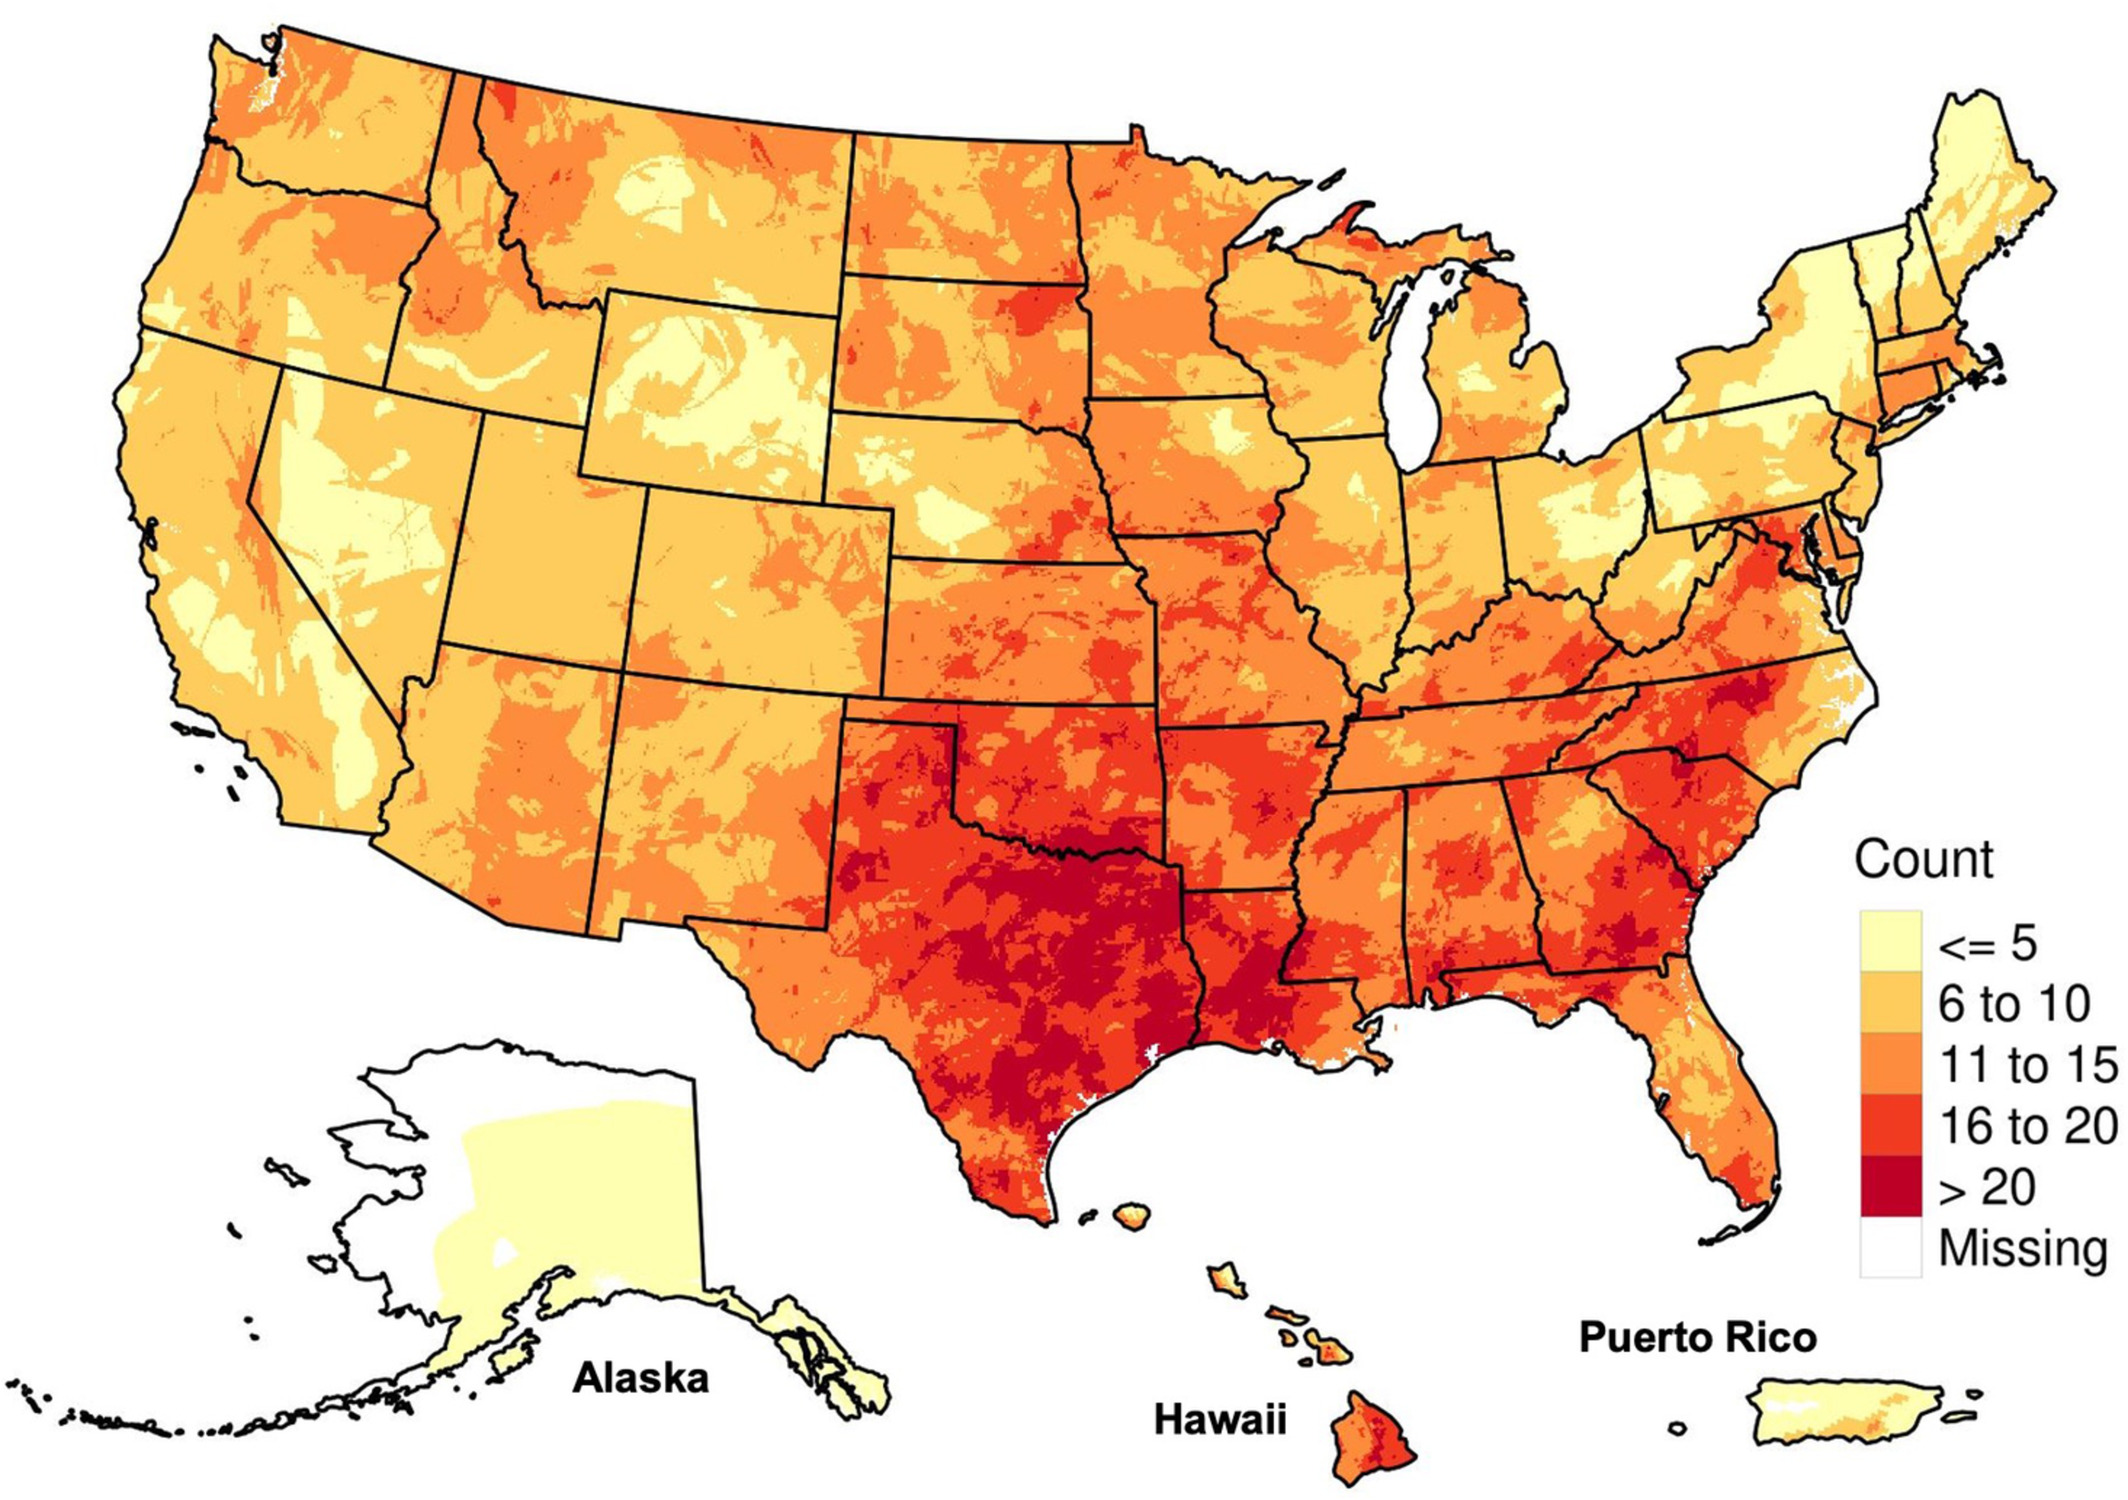 [Drought event counts from 2000 through 2019. Areas never experiencing a drought event are indicated in white. From NOAA]
The study also notes that the most severe drought in the twenty-year record was the 2012 drought, when more than 21% of the U.S. experienced its largest number of weeks at or above Extreme Drought (D3) conditions. The western U.S. has also not only spent more time in drought than the eastern U.S., but has also spent more time in Extreme Drought (D3) or greater.
[Drought event counts from 2000 through 2019. Areas never experiencing a drought event are indicated in white. From NOAA]
The study also notes that the most severe drought in the twenty-year record was the 2012 drought, when more than 21% of the U.S. experienced its largest number of weeks at or above Extreme Drought (D3) conditions. The western U.S. has also not only spent more time in drought than the eastern U.S., but has also spent more time in Extreme Drought (D3) or greater.
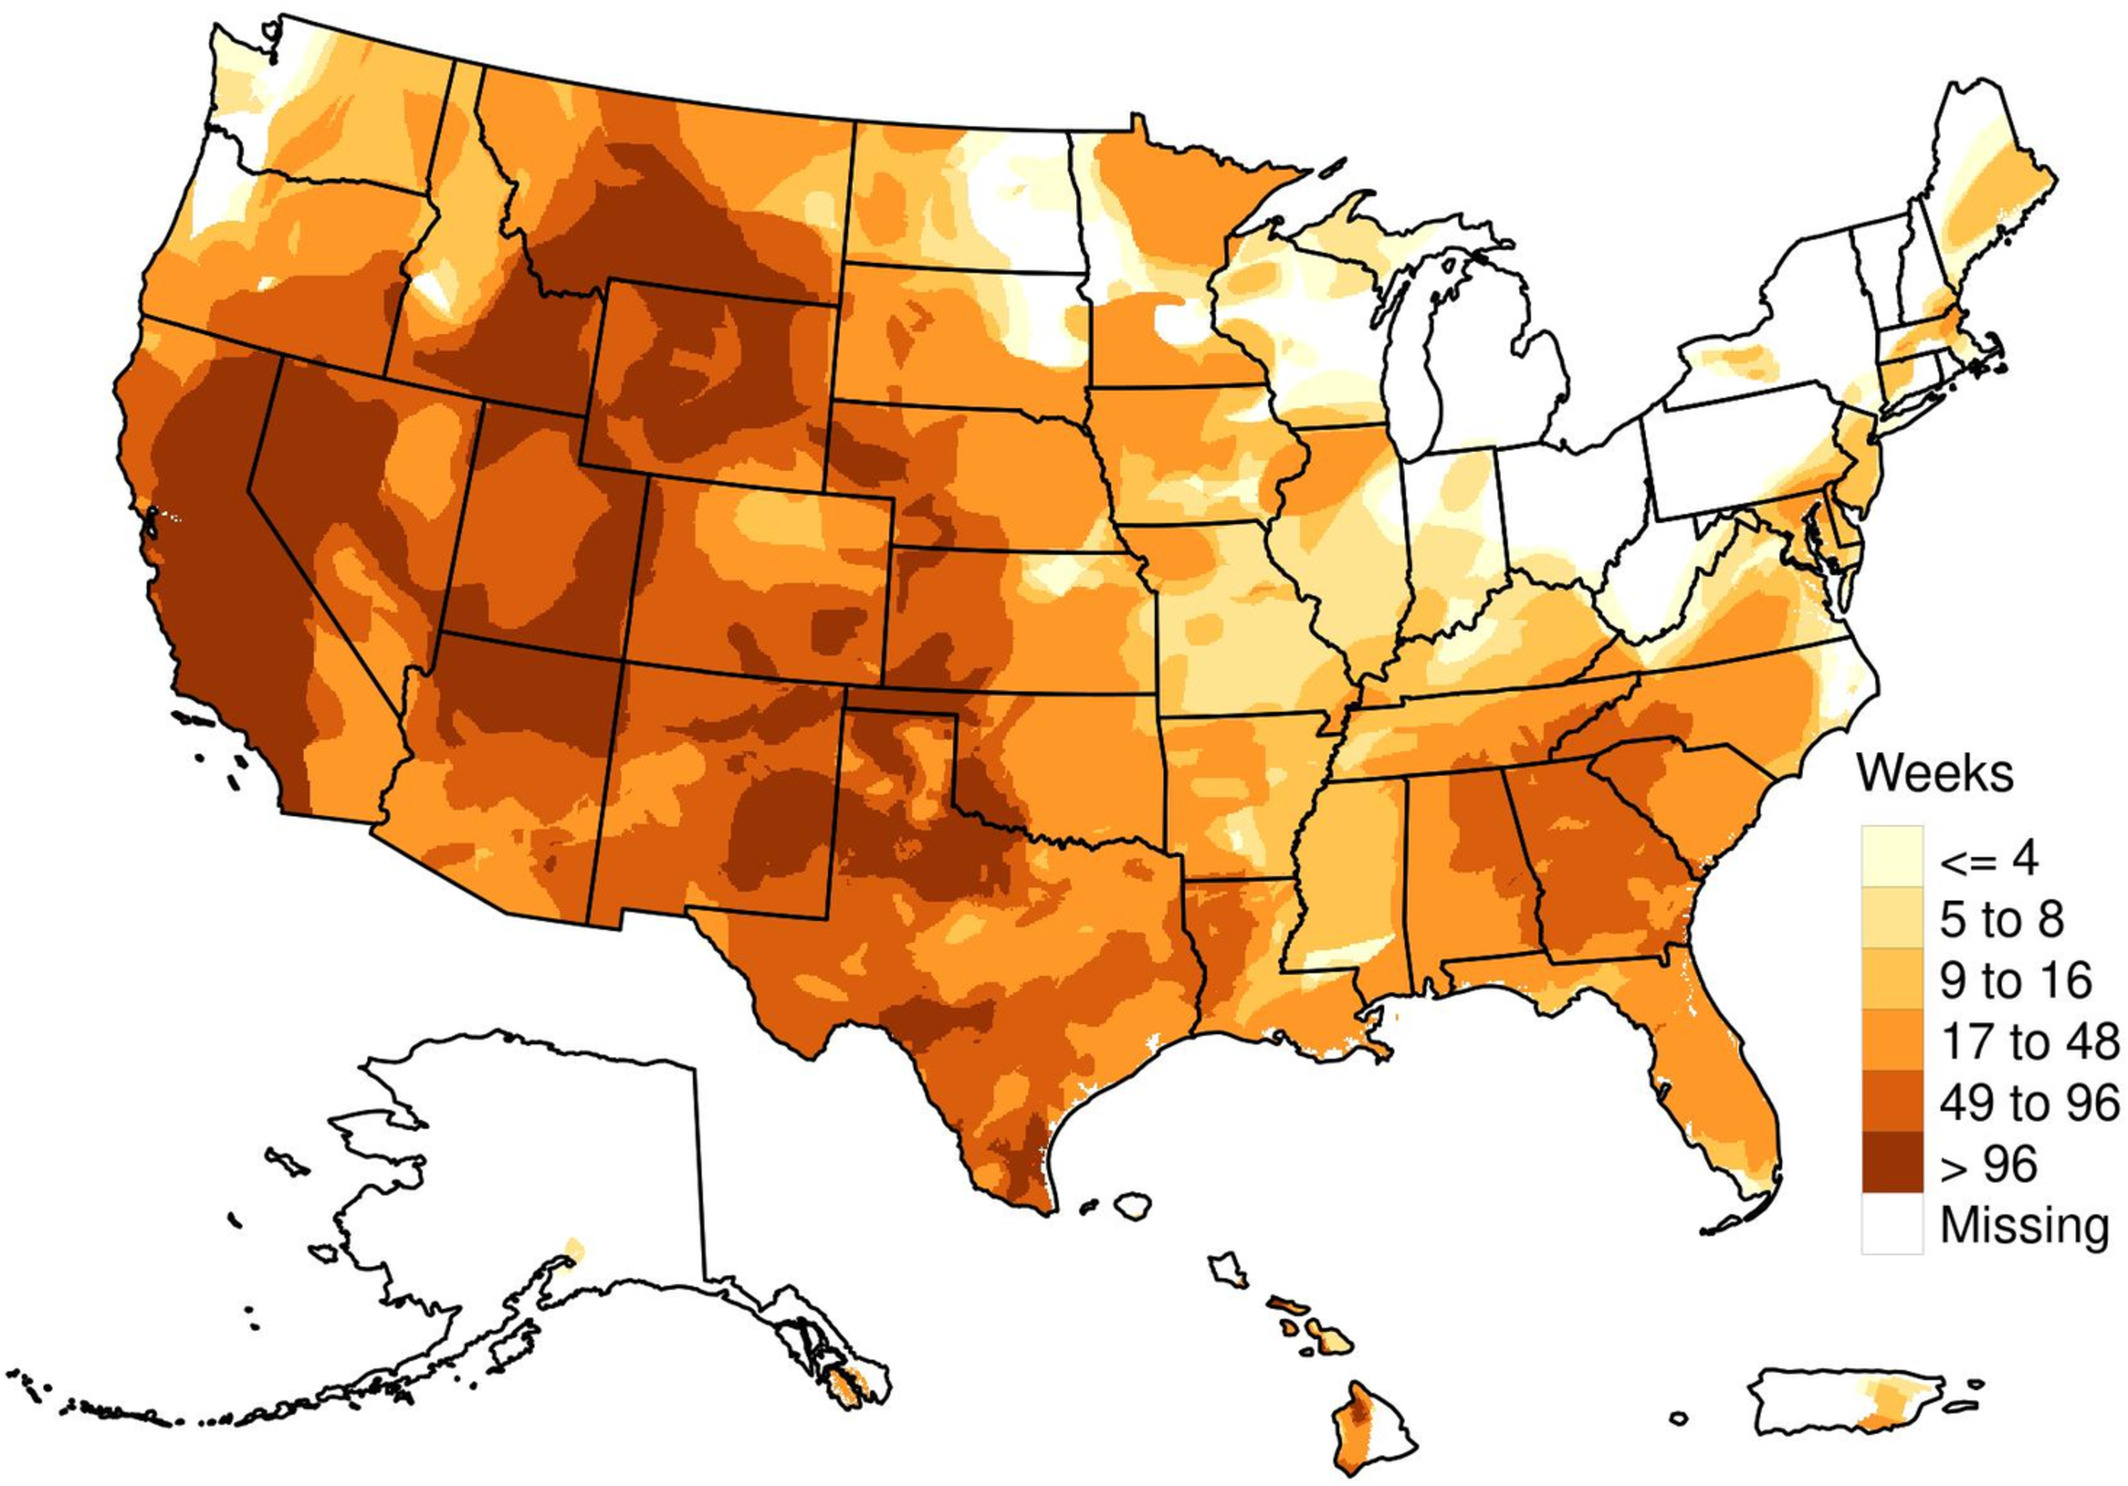 [Total number of drought weeks at or greater than Extreme Drought (D3) status from 2000 to 2019. Areas having no drought weeks exceeding D3 status were set to missing. From NOAA]
Characterizing U.S. Drought
The new study is groundbreaking in that it uses the USDM, one of the most holistic drought descriptors, to characterize drought in the U.S. Many other drought indices, though they are beneficial in specific circumstances, tell an incomplete story of drought. Using the USDM to characterize past drought therefore paints a more complete picture of its nature and impacts. The study analyzes all drought events on record in the USDM and is one of the most complete of its kind, as well as being one of the first to analyze drought characteristics in Alaska, Hawaii, and Puerto Rico. Critical “moments” in drought evolution, such as onset and termination, are also identified and used in the study to describe drought. These points can be difficult to determine, but play a critical role in understanding and following how a drought changes over time, from development to onset and through termination and amelioration.
[A visibly low water level is present in this aerial view of Enterprise Bridge in Butte County. Photo taken 28 October, 2021. Andrew Innerarity/California Department of Water Resources.]
Duration and Frequency of Drought
The results of the study show significant geographical differences in drought across the United States. The results of the study show significant geographical differences in drought across the United States. Over the past twenty years, the western U.S. has seen fewer but longer duration droughts than the eastern U.S., where droughts generally did not last as long but were more frequent. Drought also developed more slowly in the West, while “flash drought,” or drought that develops or intensifies quickly due to both a lack of precipitation and high temperatures, was much more common in the East. The study also found that flash droughts made up 9.8% of droughts. Areas of the eastern U.S. north of Kentucky and Virginia generally saw less drought overall.
[Drought event counts from 2000 through 2019. Areas never experiencing a drought event are indicated in white. From NOAA]
The study also notes that the most severe drought in the twenty-year record was the 2012 drought, when more than 21% of the U.S. experienced its largest number of weeks at or above Extreme Drought (D3) conditions. The western U.S. has also not only spent more time in drought than the eastern U.S., but has also spent more time in Extreme Drought (D3) or greater.
[Total number of drought weeks at or greater than Extreme Drought (D3) status from 2000 to 2019. Areas having no drought weeks exceeding D3 status were set to missing. From NOAA]
ArcGIS Map Viewer
The study’s authors have also designed an interactive viewer that displays maps to help analyze drought and view the data used by the authors. Users can click any point on the map to find out how many droughts have occurred in that location, as well as the number of droughts in each category (D1–D4). The viewer provides a quick and easy way for decision-makers to gain an understanding of historical drought in their area, and can prompt further questions into the local impacts of drought and how to better prepare for future droughts.Future Drought Studies
Though drought is not preventable, characterizing and understanding past drought allows federal, state, and local entities to better prepare, respond, and minimize drought impacts when it does develop. Sustainable water management planning is an example. Additionally, the nature of drought is changing due to climate change, with drought in many areas becoming more severe, frequent, or widespread, or a combination of these. This study also provides a basis and framework for continued study of drought in the 50 States and Puerto Rico, its evolution, and strategies for resilience.All Weather News
More

More Storms for the East Through Monday
A low-pressure system that moved through the
3 Aug 2026 12:20 PM


After Reaching Category 5, Genevieve Weakens in the Pacific
PacificGenevieve formed last Friday south of
3 Aug 2026 12:30 AM

Flooding, Severe Storms Target the Midwest Again
After an active week of storms across the nor
1 Aug 2026 1:40 AM

Flooding Risk Increases as Heavy Rain Targets the Tri-State Area
Tuesday, heavy rainfall moved across the Nort
30 Jul 2026 12:25 AM